Student Population by Gender
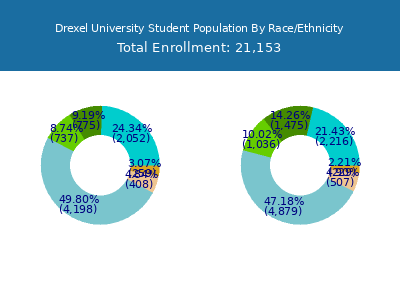
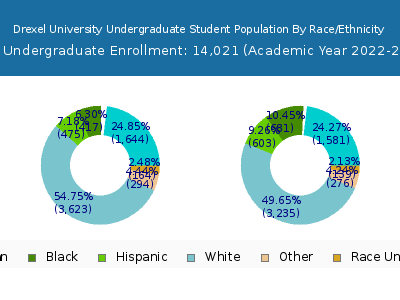
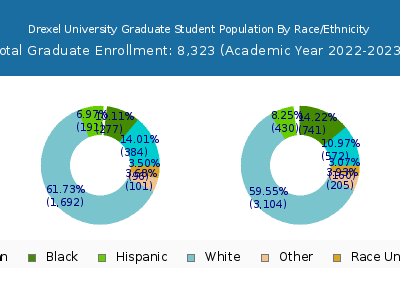
Drexel University has a total of 22,344 enrolled students for the academic year 2022-2023. 14,021 students have enrolled in undergraduate programs and 8,323 students joined graduate programs.
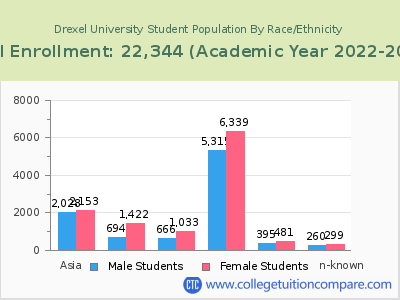
By gender, 10,174 male and 12,170 female students (the male-female ratio is 46:54) are attending the school. The gender distribution is based on the 2022-2023 data.
| Total | Undergraduate | Graduate | |
|---|---|---|---|
| Total | 22,344 | 14,021 | 8,323 |
| Men | 10,174 | 7,164 | 3,010 |
| Women | 12,170 | 6,857 | 5,313 |
Student Distribution by Race/Ethnicity
| Race | Total | Men | Women |
|---|---|---|---|
| American Indian or Native American | 11 | 7 | 4 |
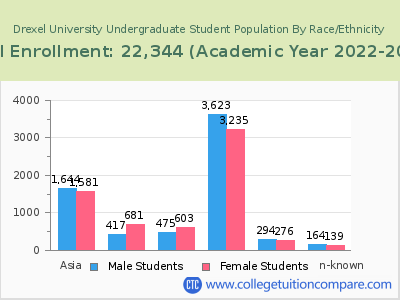
| Asian | 4,216 | 2,041 | 2,175 |
| Black | 2,055 | 675 | 1,380 |
| Hispanic | 1,686 | 673 | 1,013 |
| Native Hawaiian or Other Pacific Islanders | 11 | 6 | 5 |
| White | 10,616 | 4,831 | 5,785 |
| Two or more races | 887 | 399 | 488 |
| Race Unknown | 553 | 267 | 286 |
| Race | Total | Men | Women |
|---|---|---|---|
| American Indian or Native American | 9 | 7 | 2 |
| Asian | 3,262 | 1,664 | 1,598 |
| Black | 1,131 | 434 | 697 |
| Hispanic | 1,114 | 494 | 620 |
| Native Hawaiian or Other Pacific Islanders | 4 | 2 | 2 |
| White | 6,288 | 3,332 | 2,956 |
| Two or more races | 587 | 306 | 281 |
| Race Unknown | 338 | 188 | 150 |
| Race | Total | Men | Women |
|---|---|---|---|
| American Indian or Native American | 1 | 0 | 1 |
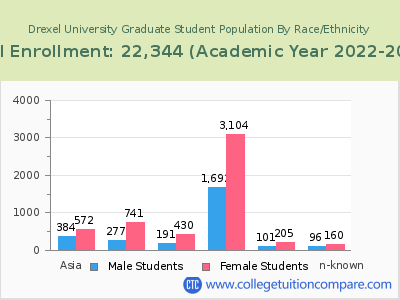
| Asian | 90 | 42 | 48 |
| Black | 81 | 25 | 56 |
| Hispanic | 60 | 22 | 38 |
| Native Hawaiian or Other Pacific Islanders | 0 | 0 | 0 |
| White | 248 | 89 | 159 |
| Two or more races | 30 | 16 | 14 |
| Race Unknown | 15 | 6 | 9 |
Student Age Distribution
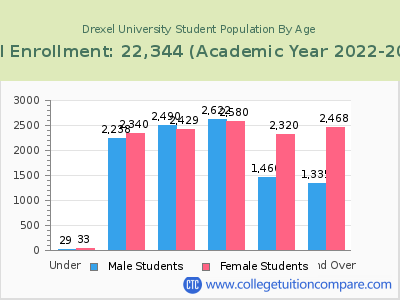
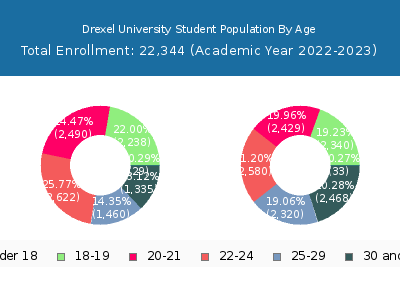
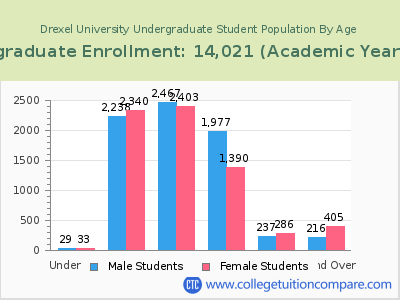
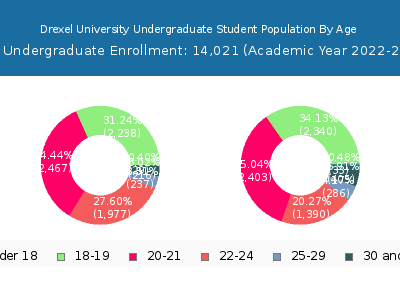
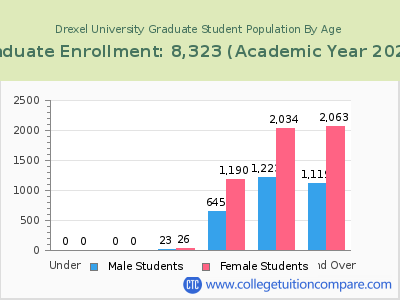
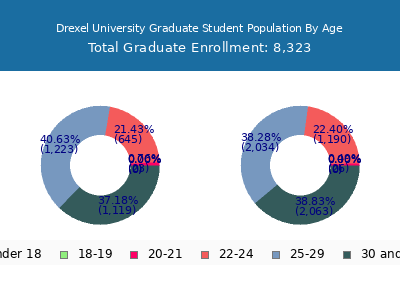
By age, Drexel has 62 students under 18 years old and 26 students over 65 years old. There are 14,761 students under 25 years old, and 7,583 students over 25 years old out of 22,344 total students.
In undergraduate programs, 62 students are younger than 18 and 7 students are older than 65. Drexel has 12,877 undergraduate students aged under 25 and 1,144 students aged 25 and over.
It has 1,884 graduate students aged under 25 and 6,439 students aged 25 and over.
| Age | Total | Men | Women |
|---|---|---|---|
| Under 18 | 62 | 33 | 29 |
| 18-19 | 4,578 | 2,340 | 2,238 |
| 20-21 | 4,919 | 2,429 | 2,490 |
| 22-24 | 5,202 | 2,580 | 2,622 |
| 25-29 | 3,780 | 2,320 | 1,460 |
| 30-34 | 1,509 | 929 | 580 |
| 35-39 | 889 | 571 | 318 |
| 40-49 | 927 | 647 | 280 |
| 50-64 | 452 | 301 | 151 |
| Over 65 | 26 | 20 | 6 |
| Age | Total | Men | Women |
|---|---|---|---|
| Under 18 | 62 | 33 | 29 |
| 18-19 | 4,578 | 2,340 | 2,238 |
| 20-21 | 4,870 | 2,403 | 2,467 |
| 22-24 | 3,367 | 1,390 | 1,977 |
| 25-29 | 523 | 286 | 237 |
| 30-34 | 274 | 163 | 111 |
| 35-39 | 134 | 83 | 51 |
| 40-49 | 140 | 100 | 40 |
| 50-64 | 66 | 53 | 13 |
| Over 65 | 7 | 6 | 1 |
| Age | Total | Men | Women |
|---|
Online Student Enrollment
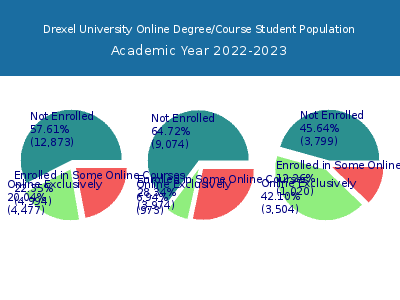
Distance learning, also called online education, is very attractive to students, especially who want to continue education and work in field. At Drexel University, 4,477 students are enrolled exclusively in online courses and 4,994 students are enrolled in some online courses.
2,127 students lived in Pennsylvania or jurisdiction in which the school is located are enrolled exclusively in online courses and 2,350 students live in other State or outside of the United States.
| All Students | Enrolled Exclusively Online Courses | Enrolled in Some Online Courses | |
|---|---|---|---|
| All Students | 22,344 | 4,477 | 4,994 |
| Undergraduate | 14,021 | 973 | 3,974 |
| Graduate | 8,323 | 3,504 | 1,020 |
| Pennsylvania Residents | Other States in U.S. | Outside of U.S. | |
|---|---|---|---|
| All Students | 2,127 | 2,350 | 0 |
| Undergraduate | 588 | 385 | 0 |
| Graduate | 1,539 | 1,965 | 0 |
Transfer-in Students (Undergraduate)
Among 14,021 enrolled in undergraduate programs, 574 students have transferred-in from other institutions. The percentage of transfer-in students is 4.09%.455 students have transferred in as full-time status and 119 students transferred in as part-time status.
| Number of Students | |
|---|---|
| Regular Full-time | 12,415 |
| Transfer-in Full-time | 455 |
| Regular Part-time | 1,032 |
| Transfer-in Part-time | 119 |
