Student Population by Gender
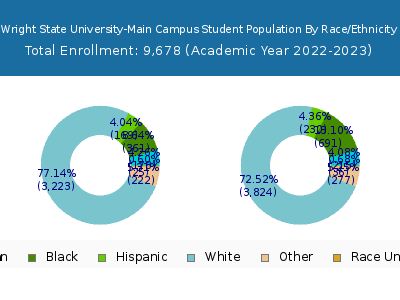
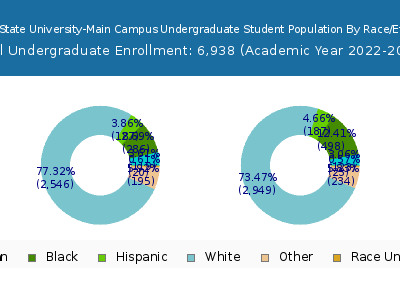
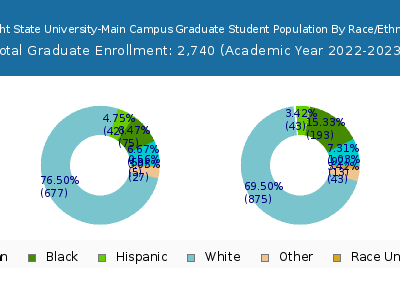
Wright State University-Main Campus has a total of 9,678 enrolled students for the academic year 2022-2023. 6,938 students have enrolled in undergraduate programs and 2,740 students joined graduate programs.
By gender, 4,389 male and 5,289 female students (the male-female ratio is 45:55) are attending the school. The gender distribution is based on the 2022-2023 data.
| Total | Undergraduate | Graduate | |
|---|---|---|---|
| Total | 9,678 | 6,938 | 2,740 |
| Men | 4,389 | 3,100 | 1,289 |
| Women | 5,289 | 3,838 | 1,451 |
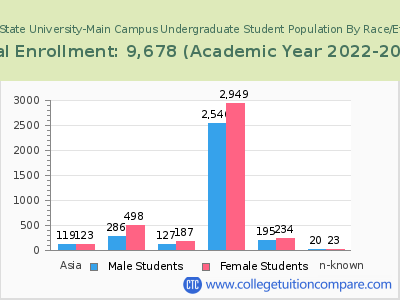
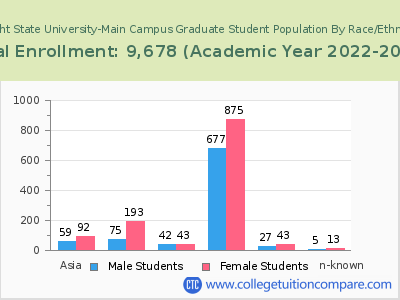
Student Distribution by Race/Ethnicity
| Race | Total | Men | Women |
|---|---|---|---|
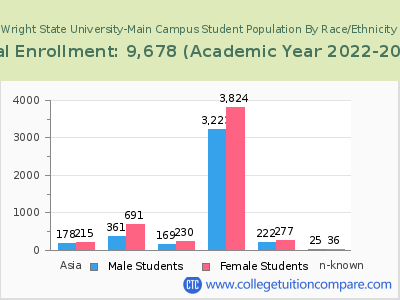
| American Indian or Native American | 13 | 9 | 4 |
| Asian | 379 | 161 | 218 |
| Black | 1,020 | 346 | 674 |
| Hispanic | 406 | 183 | 223 |
| Native Hawaiian or Other Pacific Islanders | 4 | 4 | 0 |
| White | 6,294 | 2,868 | 3,426 |
| Two or more races | 478 | 203 | 275 |
| Race Unknown | 45 | 17 | 28 |
| Race | Total | Men | Women |
|---|---|---|---|
| American Indian or Native American | 13 | 9 | 4 |
| Asian | 231 | 102 | 129 |
| Black | 791 | 284 | 507 |
| Hispanic | 327 | 145 | 182 |
| Native Hawaiian or Other Pacific Islanders | 2 | 2 | 0 |
| White | 5,002 | 2,295 | 2,707 |
| Two or more races | 400 | 174 | 226 |
| Race Unknown | 23 | 10 | 13 |
| Race | Total | Men | Women |
|---|---|---|---|
| American Indian or Native American | 3 | 3 | 0 |
| Asian | 19 | 8 | 11 |
| Black | 89 | 33 | 56 |
| Hispanic | 35 | 15 | 20 |
| Native Hawaiian or Other Pacific Islanders | 0 | 0 | 0 |
| White | 517 | 241 | 276 |
| Two or more races | 36 | 18 | 18 |
| Race Unknown | 1 | 0 | 1 |
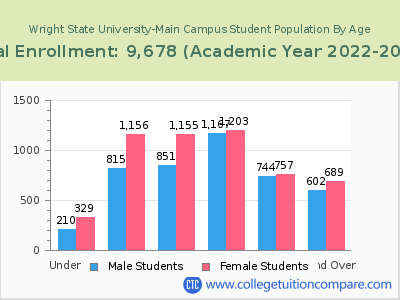
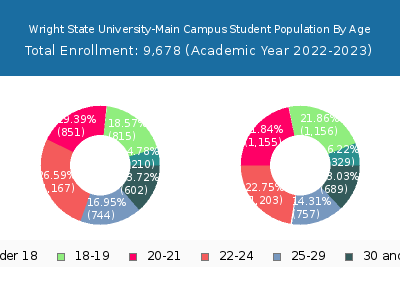
Student Age Distribution
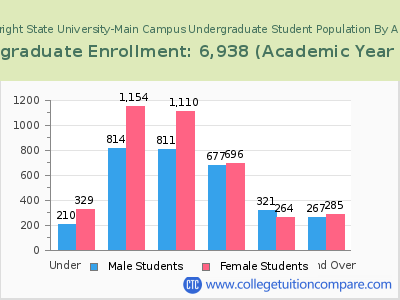
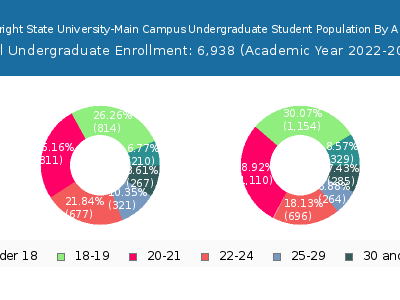
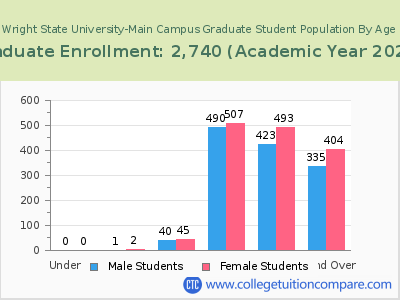
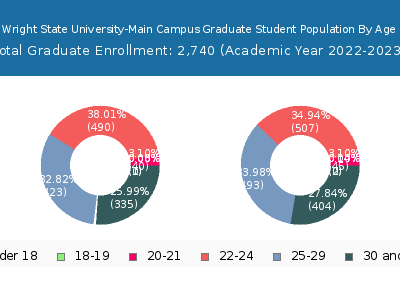
By age, Wright State University-Main Campus has 539 students under 18 years old and 4 students over 65 years old. There are 6,886 students under 25 years old, and 2,792 students over 25 years old out of 9,678 total students.
In undergraduate programs, 539 students are younger than 18 and 1 students are older than 65. Wright State University-Main Campus has 5,801 undergraduate students aged under 25 and 1,137 students aged 25 and over.
It has 1,085 graduate students aged under 25 and 1,655 students aged 25 and over.
| Age | Total | Men | Women |
|---|---|---|---|
| Under 18 | 539 | 329 | 210 |
| 18-19 | 1,971 | 1,156 | 815 |
| 20-21 | 2,006 | 1,155 | 851 |
| 22-24 | 2,370 | 1,203 | 1,167 |
| 25-29 | 1,501 | 757 | 744 |
| 30-34 | 531 | 264 | 267 |
| 35-39 | 308 | 159 | 149 |
| 40-49 | 303 | 180 | 123 |
| 50-64 | 145 | 86 | 59 |
| Over 65 | 4 | 0 | 4 |
| Age | Total | Men | Women |
|---|---|---|---|
| Under 18 | 539 | 329 | 210 |
| 18-19 | 1,968 | 1,154 | 814 |
| 20-21 | 1,921 | 1,110 | 811 |
| 22-24 | 1,373 | 696 | 677 |
| 25-29 | 585 | 264 | 321 |
| 30-34 | 232 | 109 | 123 |
| 35-39 | 130 | 58 | 72 |
| 40-49 | 128 | 79 | 49 |
| 50-64 | 61 | 39 | 22 |
| Over 65 | 1 | 0 | 1 |
| Age | Total | Men | Women |
|---|
Online Student Enrollment
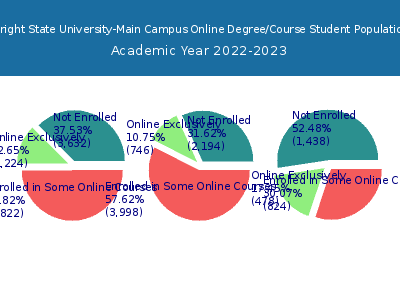
Distance learning, also called online education, is very attractive to students, especially who want to continue education and work in field. At Wright State University-Main Campus, 1,224 students are enrolled exclusively in online courses and 4,822 students are enrolled in some online courses.
1,156 students lived in Ohio or jurisdiction in which the school is located are enrolled exclusively in online courses and 68 students live in other State or outside of the United States.
| All Students | Enrolled Exclusively Online Courses | Enrolled in Some Online Courses | |
|---|---|---|---|
| All Students | 9,678 | 1,224 | 4,822 |
| Undergraduate | 6,938 | 746 | 3,998 |
| Graduate | 2,740 | 478 | 824 |
| Ohio Residents | Other States in U.S. | Outside of U.S. | |
|---|---|---|---|
| All Students | 1,156 | 64 | 4 |
| Undergraduate | 714 | 30 | 2 |
| Graduate | 442 | 34 | 2 |
Transfer-in Students (Undergraduate)
Among 6,938 enrolled in undergraduate programs, 705 students have transferred-in from other institutions. The percentage of transfer-in students is 10.16%.551 students have transferred in as full-time status and 154 students transferred in as part-time status.
| Number of Students | |
|---|---|
| Regular Full-time | 4,596 |
| Transfer-in Full-time | 551 |
| Regular Part-time | 1,637 |
| Transfer-in Part-time | 154 |
