Graduation Rates in Reasonable Completion Time
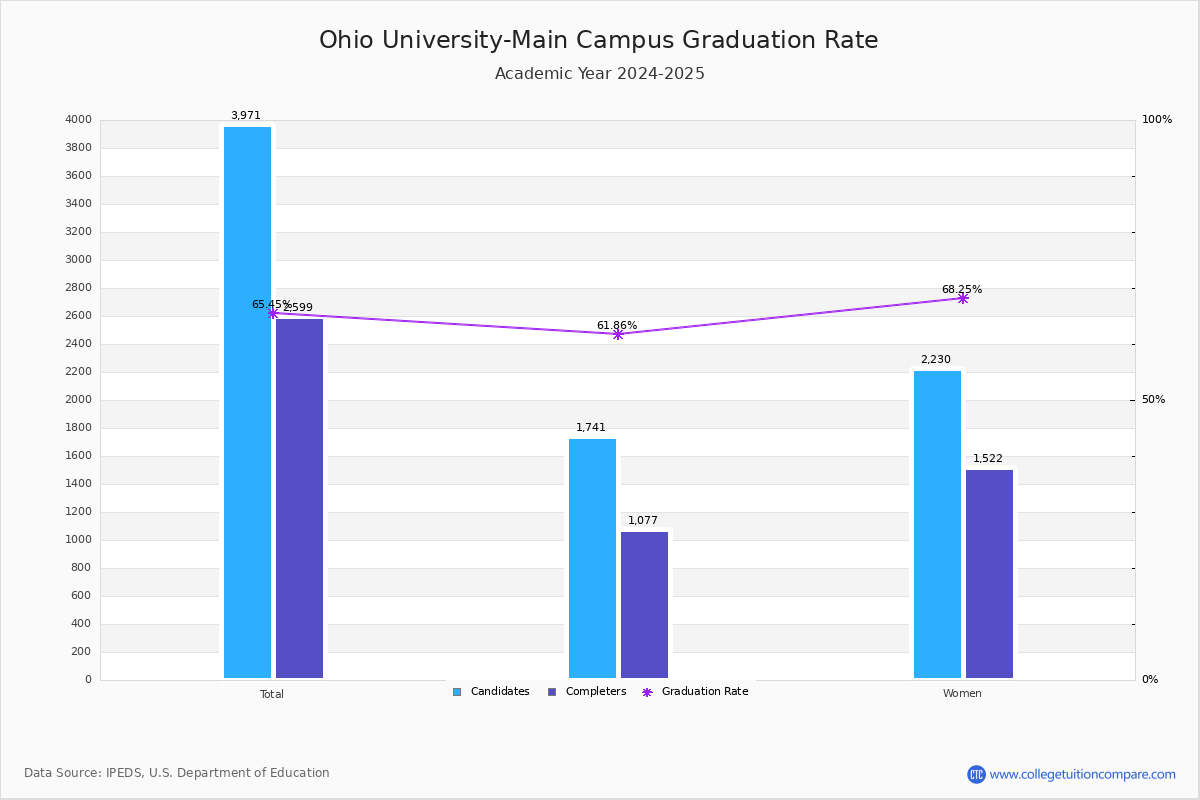
For the academic year 2022-2023, 2,789 students out of 4,287 candidates have completed their courses within 150% normal time (i.e. in 6 years for 4-year BS degree) at Ohio University-Main Campus.
By gender, 1,193 male and 1,596 female students graduated the school last year completing their jobs in the period. Its graduation rate is around the average rate when comparing similar colleges' rate of 71.52% (public Research University with very high research activity).
| Candidates | Completers | Graduation Rates | |
|---|---|---|---|
| Total | 4,287 | 2,789 | 65.06% |
| Men | 1,903 | 1,193 | 62.69% |
| Women | 2,384 | 1,596 | 66.95% |
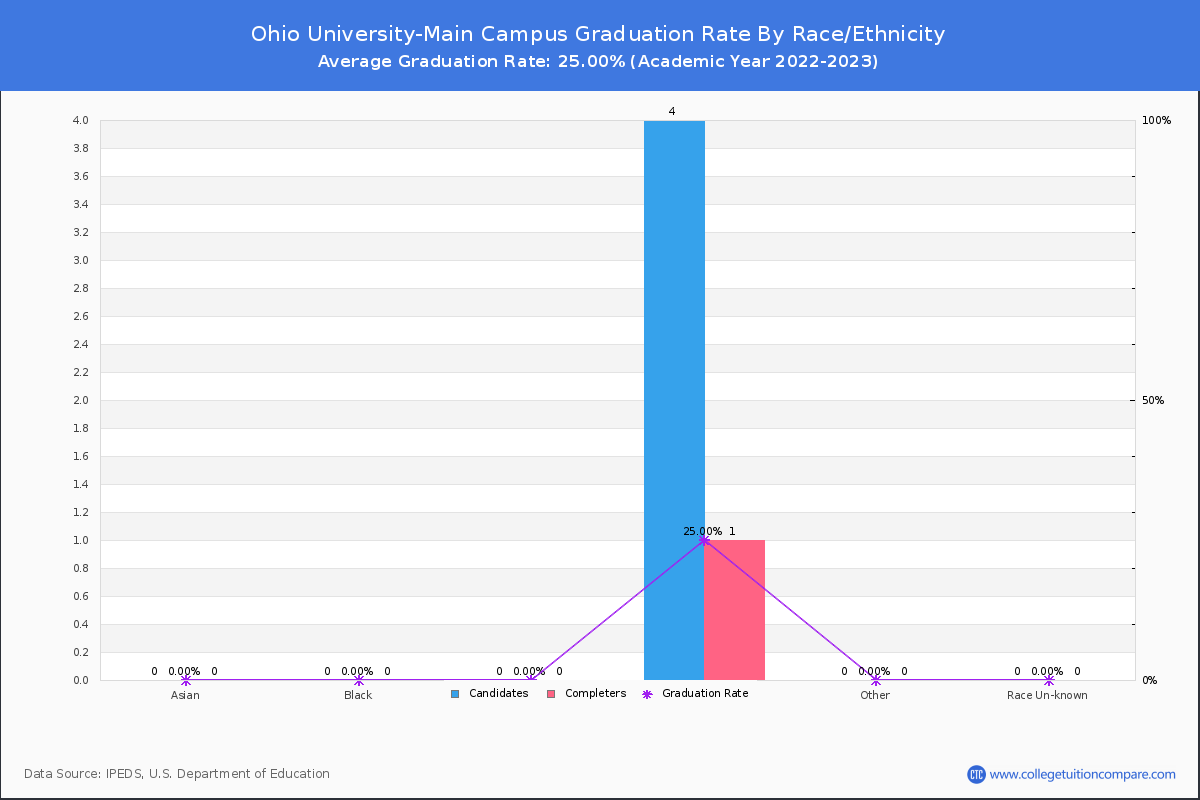
Graduation Rate By Race/Ethnicity
The following table shows graduation rate by race and at Ohio University-Main Campus.
- American Indian or Alaska Native: 40.00%
- Asian: 68.09%
- Black (Non-Hispanic): 58.33%
- Hispanic: 61.94%
- White: 66.17%
- Two or More Race: 54.95%
- Unknown: 68.29%
| Total | Male | Female | |
|---|---|---|---|
| American Indian or Alaska Native | 40.00%(2/5) | 33.33%(1/3) | 50.00%(1/2) |
| Asian | 68.09%(32/47) | 66.67%(14/21) | 69.23%(18/26) |
| Black (Non-Hispanic) | 58.33%(140/240) | 55.17%(48/87) | 60.13%(92/153) |
| Hispanic | 61.94%(83/134) | 64.41%(38/59) | 60.00%(45/75) |
| White | 66.17%(2,384/3,603) | 63.83%(1,029/1,612) | 68.06%(1,355/1,991) |
| Two or More Race | 54.95%(100/182) | 49.35%(38/77) | 59.05%(62/105) |
| Unknown | 68.29%(28/41) | 63.64%(14/22) | 73.68%(14/19) |
Transfer-out and Retention Rates
At Ohio University-Main Campus, the transfer-out rate is 27.46%. Its transfer-out rate is much higher than the average rate when comparing similar colleges' rate of 14.53%.
Ohio University-Main Campus's retention rate is 79% for full-time students and 53 % for part-time students last year. Its retention rate is around the average rate when comparing similar colleges' rate of 86.03%.
Non-Resident Alien Graduation Rate
A non-resident alien student is not a US citizen/green card holder and studies with a student visa, such as an F visa, in the United States. At Ohio University-Main Campus, 20 of 35 non-resident alien students completed their studies and the graduation rate was 57.14%.