Student Population by Gender
Oberlin College has a total of 2,992 enrolled students for the academic year 2022-2023. 2,986 students have enrolled in undergraduate programs and 6 students joined graduate programs.
By gender, 1,226 male and 1,766 female students (the male-female ratio is 41:59) are attending the school. The gender distribution is based on the 2022-2023 data.
| Total | Undergraduate | Graduate | |
|---|---|---|---|
| Total | 2,992 | 2,986 | 6 |
| Men | 1,226 | 1,220 | 6 |
| Women | 1,766 | 1,766 | 0 |
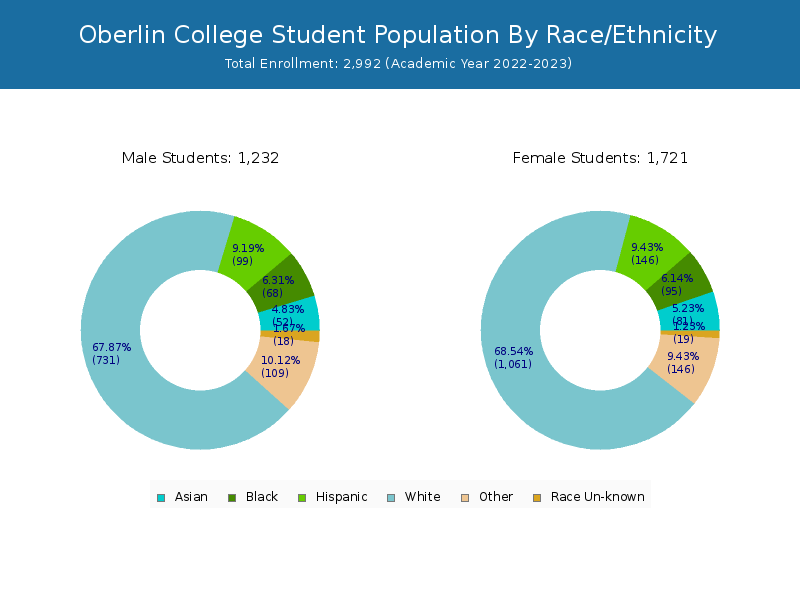
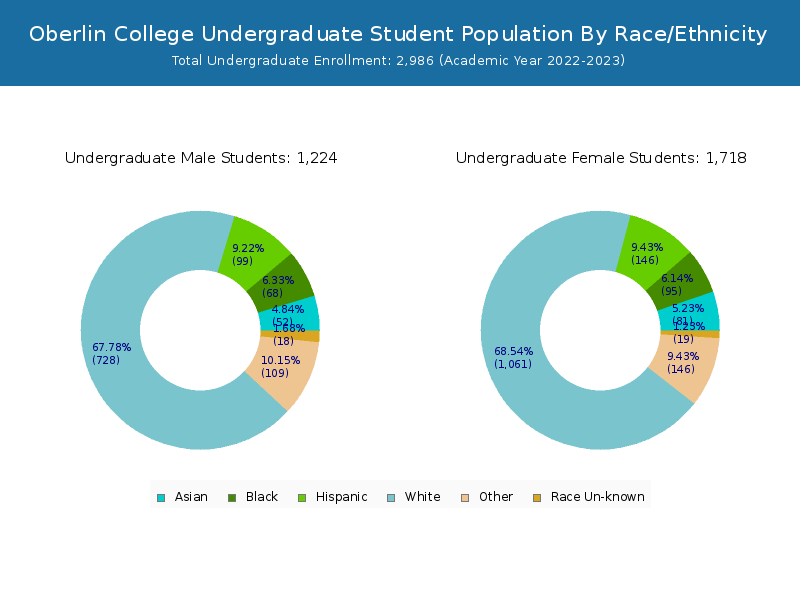

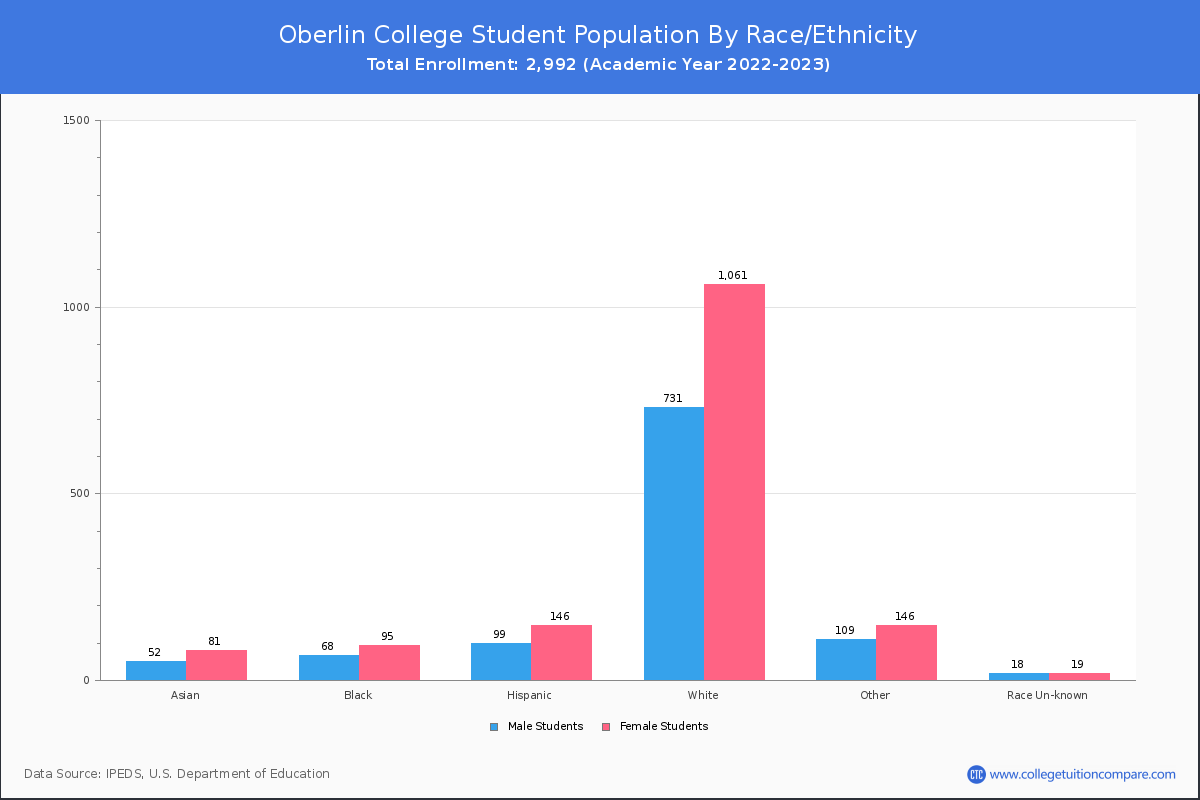
Student Distribution by Race/Ethnicity
By race/ethnicity, 1,837 White, 136 Black, and 155 Asian students out of a total of 2,992 are attending at Oberlin College. Comprehensive enrollment statistic data by race/ethnicity is shown in the next chart (Academic year 2022-2023 data).
| Race | Total | Men | Women |
|---|---|---|---|
| American Indian or Native American | 0 | 0 | 0 |
| Asian | 155 | 50 | 105 |
| Black | 136 | 59 | 77 |
| Hispanic | 245 | 102 | 143 |
| Native Hawaiian or Other Pacific Islanders | 0 | 0 | 0 |
| White | 1,837 | 734 | 1,103 |
| Two or more races | 286 | 120 | 166 |
| Race Unknown | 36 | 19 | 17 |
| Race | Total | Men | Women |
|---|---|---|---|
| American Indian or Native American | 0 | 0 | 0 |
| Asian | 154 | 49 | 105 |
| Black | 136 | 59 | 77 |
| Hispanic | 245 | 102 | 143 |
| Native Hawaiian or Other Pacific Islanders | 0 | 0 | 0 |
| White | 1,836 | 733 | 1,103 |
| Two or more races | 285 | 119 | 166 |
| Race Unknown | 36 | 19 | 17 |
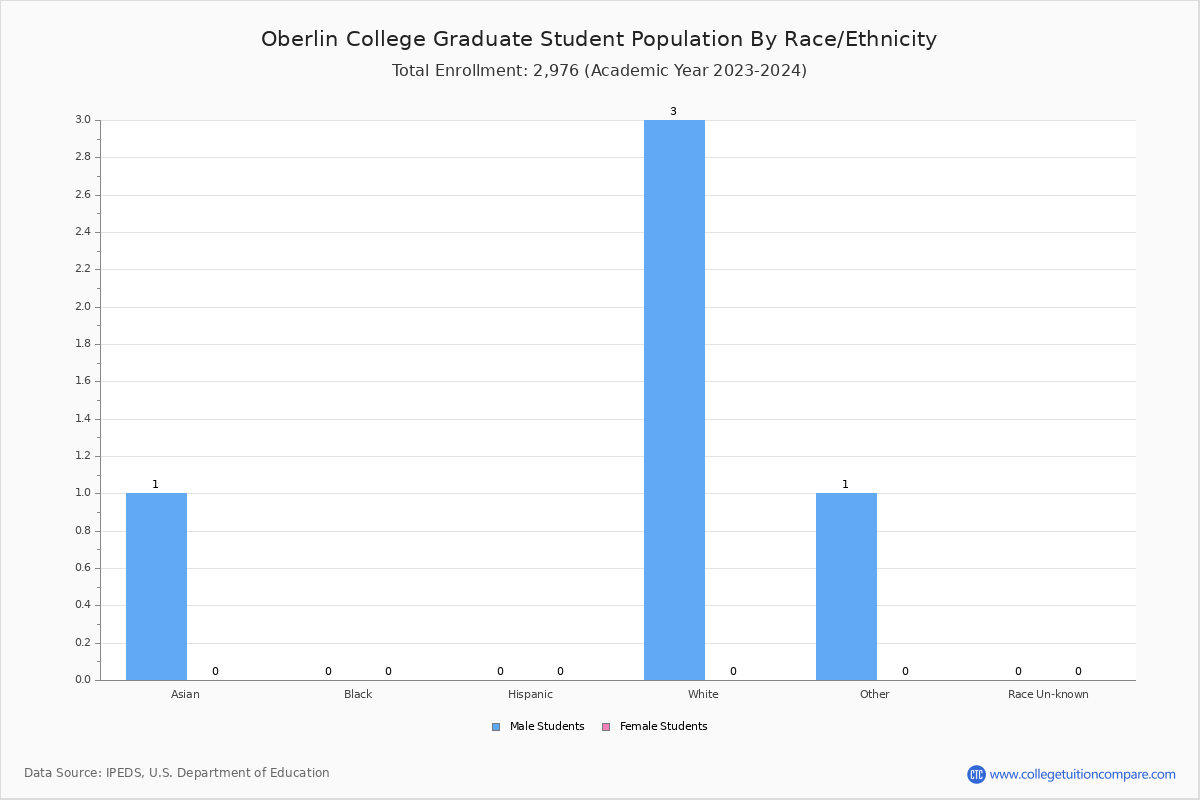
| Race | Total | Men | Women |
|---|---|---|---|
| American Indian or Native American | 0 | 0 | 0 |
| Asian | 3 | 0 | 3 |
| Black | 0 | 0 | 0 |
| Hispanic | 0 | 0 | 0 |
| Native Hawaiian or Other Pacific Islanders | 0 | 0 | 0 |
| White | 3 | 2 | 1 |
| Two or more races | 2 | 1 | 1 |
| Race Unknown | 0 | 0 | 0 |
Transfer-in Students (Undergraduate)
Among 2,986 enrolled in undergraduate programs, 9 students have transferred-in from other institutions. The percentage of transfer-in students is 0.30%.
| Number of Students | |
|---|---|
| Regular Full-time | 2,969 |
| Transfer-in Full-time | 9 |