Student Population by Gender
Notre Dame College has a total of 1,444 enrolled students for the academic year 2022-2023. 1,329 students have enrolled in undergraduate programs and 115 students joined graduate programs.
By gender, 664 male and 780 female students (the male-female ratio is 46:54) are attending the school. The gender distribution is based on the 2022-2023 data.
| Total | Undergraduate | Graduate | |
|---|---|---|---|
| Total | 1,444 | 1,329 | 115 |
| Men | 664 | 619 | 45 |
| Women | 780 | 710 | 70 |
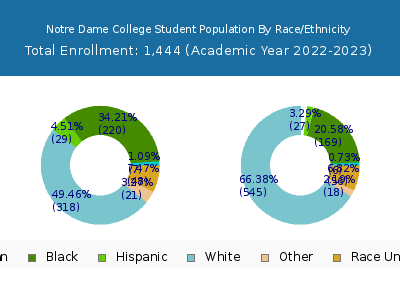
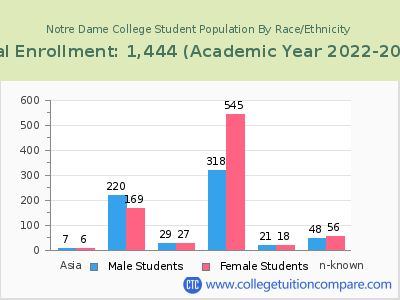
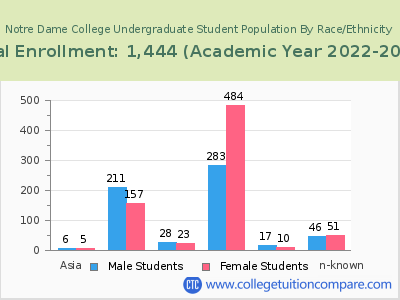
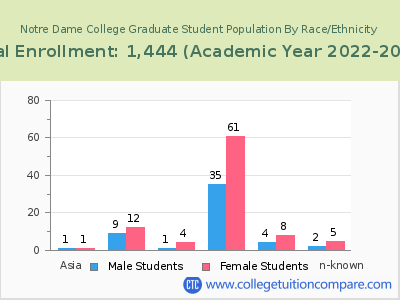
Student Distribution by Race/Ethnicity
| Race | Total | Men | Women |
|---|---|---|---|
| American Indian or Native American | 2 | 1 | 1 |
| Asian | 11 | 3 | 8 |
| Black | 357 | 204 | 153 |
| Hispanic | 62 | 32 | 30 |
| Native Hawaiian or Other Pacific Islanders | 2 | 1 | 1 |
| White | 774 | 291 | 483 |
| Two or more races | 41 | 20 | 21 |
| Race Unknown | 97 | 41 | 56 |
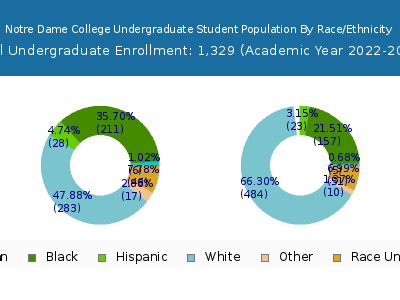
| Race | Total | Men | Women |
|---|---|---|---|
| American Indian or Native American | 2 | 1 | 1 |
| Asian | 10 | 2 | 8 |
| Black | 335 | 195 | 140 |
| Hispanic | 56 | 31 | 25 |
| Native Hawaiian or Other Pacific Islanders | 2 | 1 | 1 |
| White | 708 | 266 | 442 |
| Two or more races | 40 | 20 | 20 |
| Race Unknown | 86 | 38 | 48 |
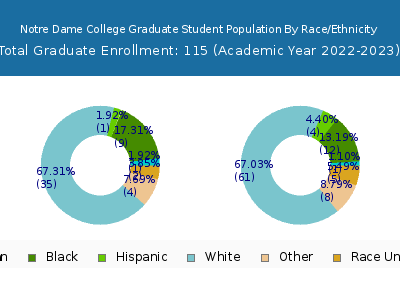
| Race | Total | Men | Women |
|---|---|---|---|
| American Indian or Native American | 0 | 0 | 0 |
| Asian | 0 | 0 | 0 |
| Black | 50 | 28 | 22 |
| Hispanic | 5 | 2 | 3 |
| Native Hawaiian or Other Pacific Islanders | 1 | 0 | 1 |
| White | 57 | 17 | 40 |
| Two or more races | 10 | 5 | 5 |
| Race Unknown | 4 | 2 | 2 |
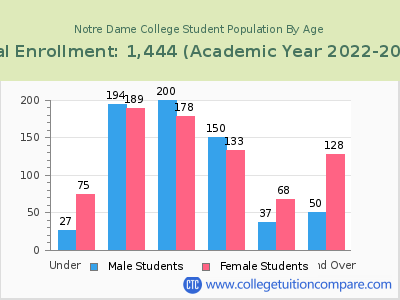
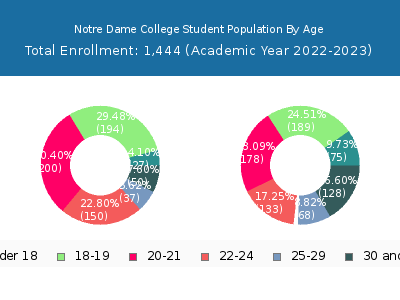
Student Age Distribution
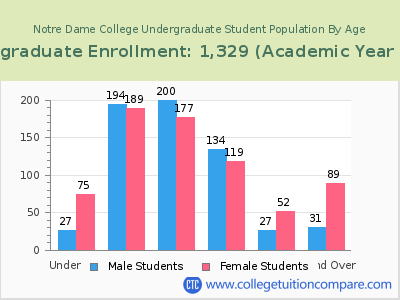
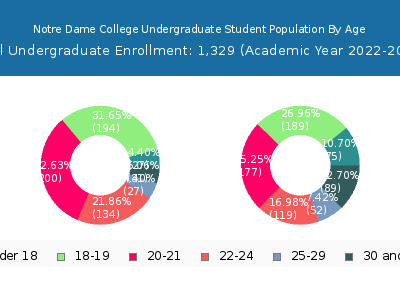
By age, Notre Dame has 102 students under 18 years old and 2 students over 65 years old. There are 1,146 students under 25 years old, and 283 students over 25 years old out of 1,444 total students.
In undergraduate programs, 102 students are younger than 18 and 2 students are older than 65. Notre Dame has 1,115 undergraduate students aged under 25 and 199 students aged 25 and over.
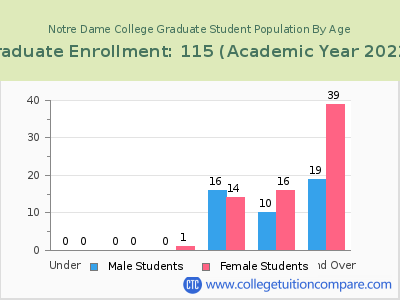
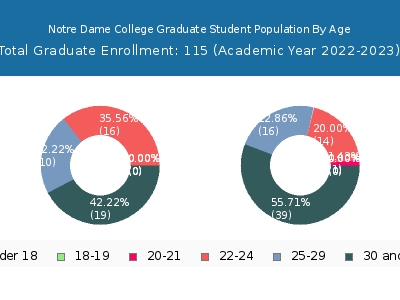
It has 31 graduate students aged under 25 and 84 students aged 25 and over.
| Age | Total | Men | Women |
|---|---|---|---|
| Under 18 | 102 | 75 | 27 |
| 18-19 | 383 | 189 | 194 |
| 20-21 | 378 | 178 | 200 |
| 22-24 | 283 | 133 | 150 |
| 25-29 | 105 | 68 | 37 |
| 30-34 | 47 | 33 | 14 |
| 35-39 | 33 | 18 | 15 |
| 40-49 | 72 | 55 | 17 |
| 50-64 | 24 | 20 | 4 |
| Over 65 | 2 | 2 | 0 |
| Age | Total | Men | Women |
|---|---|---|---|
| Under 18 | 102 | 75 | 27 |
| 18-19 | 383 | 189 | 194 |
| 20-21 | 377 | 177 | 200 |
| 22-24 | 253 | 119 | 134 |
| 25-29 | 79 | 52 | 27 |
| 30-34 | 31 | 22 | 9 |
| 35-39 | 23 | 15 | 8 |
| 40-49 | 49 | 38 | 11 |
| 50-64 | 15 | 12 | 3 |
| Over 65 | 2 | 2 | 0 |
| Age | Total | Men | Women |
|---|
Online Student Enrollment
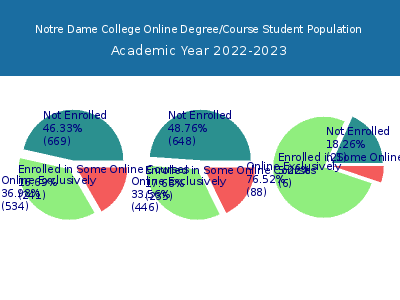
Distance learning, also called online education, is very attractive to students, especially who want to continue education and work in field. At Notre Dame College, 534 students are enrolled exclusively in online courses and 241 students are enrolled in some online courses.
460 students lived in Ohio or jurisdiction in which the school is located are enrolled exclusively in online courses and 74 students live in other State or outside of the United States.
| All Students | Enrolled Exclusively Online Courses | Enrolled in Some Online Courses | |
|---|---|---|---|
| All Students | 1,444 | 534 | 241 |
| Undergraduate | 1,329 | 446 | 235 |
| Graduate | 115 | 88 | 6 |
| Ohio Residents | Other States in U.S. | Outside of U.S. | |
|---|---|---|---|
| All Students | 460 | 73 | 1 |
| Undergraduate | 392 | 53 | 1 |
| Graduate | 68 | 20 | 0 |
Transfer-in Students (Undergraduate)
Among 1,329 enrolled in undergraduate programs, 133 students have transferred-in from other institutions. The percentage of transfer-in students is 10.01%.105 students have transferred in as full-time status and 28 students transferred in as part-time status.
| Number of Students | |
|---|---|
| Regular Full-time | 853 |
| Transfer-in Full-time | 105 |
| Regular Part-time | 343 |
| Transfer-in Part-time | 28 |
