Student Population by Gender
Hocking College has a total of 1,951 enrolled students for the academic year 2022-2023. All 1,951 students are enrolled into undergraduate programs.
By gender, 1,000 male and 951 female students (the male-female ratio is 51:49) are attending the school. The gender distribution is based on the 2022-2023 data.
| Undergraduate | |
|---|---|
| Total | 1,951 |
| Men | 1,000 |
| Women | 951 |
Student Distribution by Race/Ethnicity
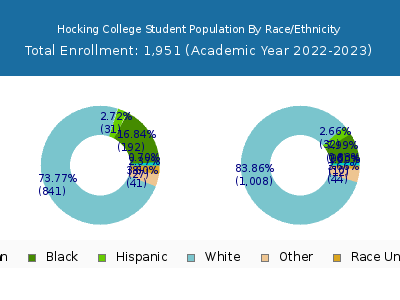
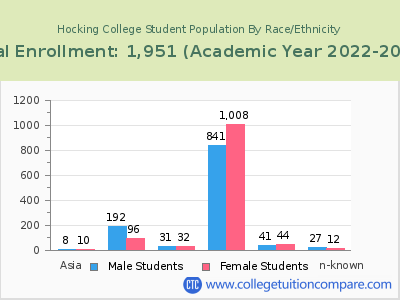
| Race | Total | Men | Women |
|---|---|---|---|
| American Indian or Native American | 3 | 3 | 0 |
| Asian | 6 | 3 | 3 |
| Black | 268 | 197 | 71 |
| Hispanic | 42 | 22 | 20 |
| Native Hawaiian or Other Pacific Islanders | 0 | 0 | 0 |
| White | 1,487 | 700 | 787 |
| Two or more races | 84 | 40 | 44 |
| Race Unknown | 36 | 26 | 10 |
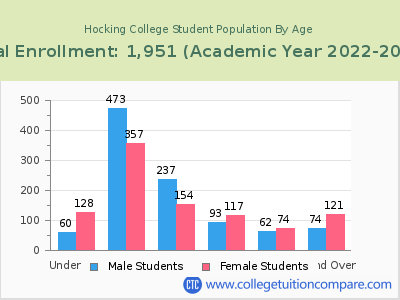
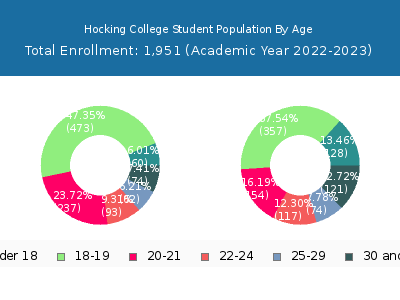
Student Age Distribution
Online Student Enrollment
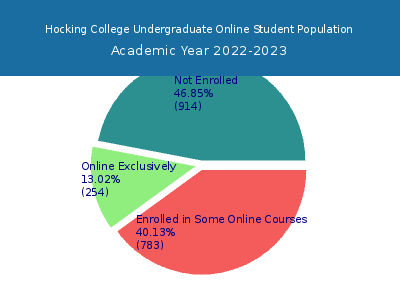
Distance learning, also called online education, is very attractive to students, especially who want to continue education and work in field. At Hocking College, 254 students are enrolled exclusively in online courses and 783 students are enrolled in some online courses.
245 students lived in Ohio or jurisdiction in which the school is located are enrolled exclusively in online courses and 9 students live in other State or outside of the United States.
| All Students | Enrolled Exclusively Online Courses | Enrolled in Some Online Courses | |
|---|---|---|---|
| All Students | 1,951 | 254 | 783 |
| Undergraduate | 1,951 | 254 | 783 |
| Ohio Residents | Other States in U.S. | Outside of U.S. | |
|---|---|---|---|
| All Students | 245 | 8 | 1 |
| Undergraduate | 245 | 8 | 1 |
| Graduate | - | - | - |
Transfer-in Students (Undergraduate)
Among 1,951 enrolled in undergraduate programs, 294 students have transferred-in from other institutions. The percentage of transfer-in students is 15.07%.239 students have transferred in as full-time status and 55 students transferred in as part-time status.
| Number of Students | |
|---|---|
| Regular Full-time | 1,259 |
| Transfer-in Full-time | 239 |
| Regular Part-time | 398 |
| Transfer-in Part-time | 55 |
