Student Population by Gender
University of Cincinnati-Main Campus has a total of 41,155 enrolled students for the academic year 2022-2023. 29,663 students have enrolled in undergraduate programs and 11,492 students joined graduate programs.
By gender, 19,134 male and 22,021 female students (the male-female ratio is 46:54) are attending the school. The gender distribution is based on the 2022-2023 data.
| Total | Undergraduate | Graduate | |
|---|---|---|---|
| Total | 41,155 | 29,663 | 11,492 |
| Men | 19,134 | 14,714 | 4,420 |
| Women | 22,021 | 14,949 | 7,072 |
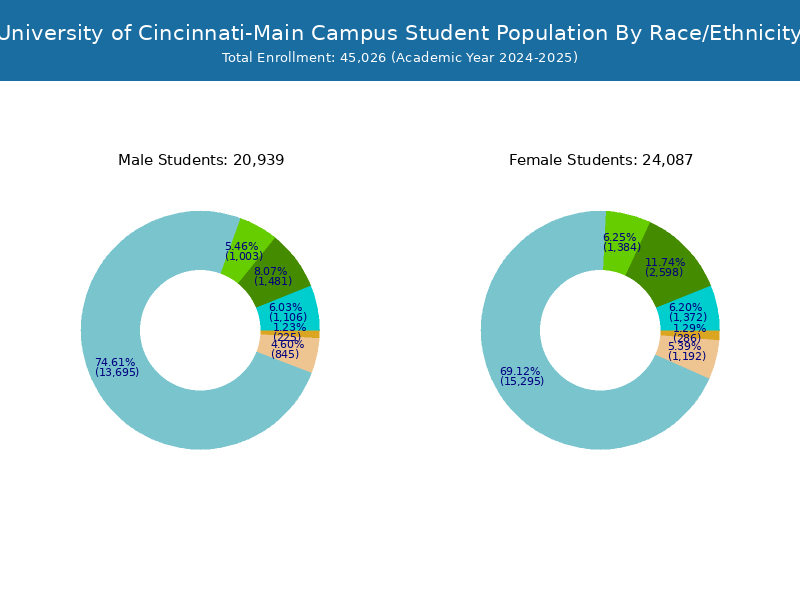
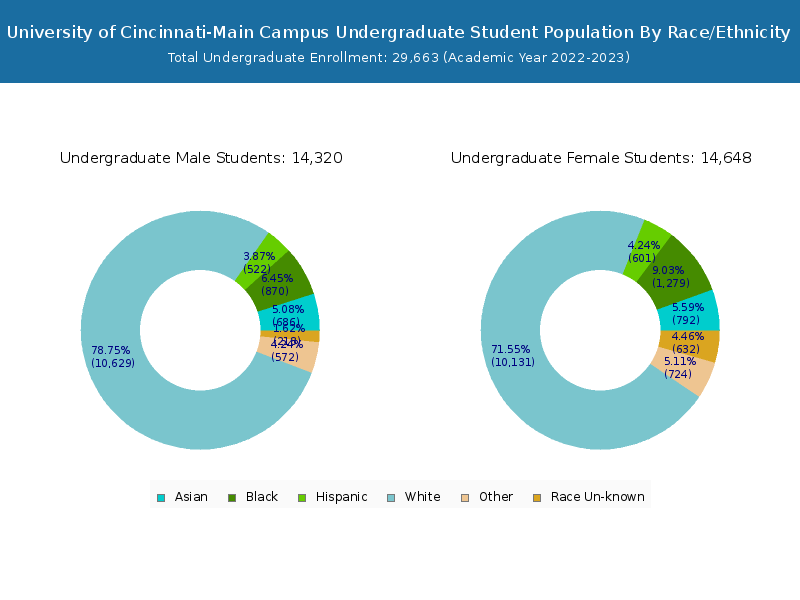
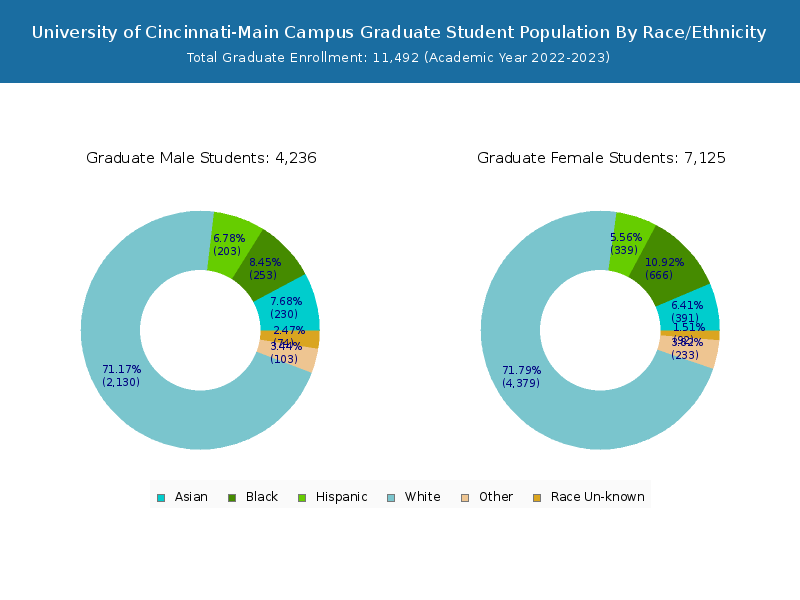
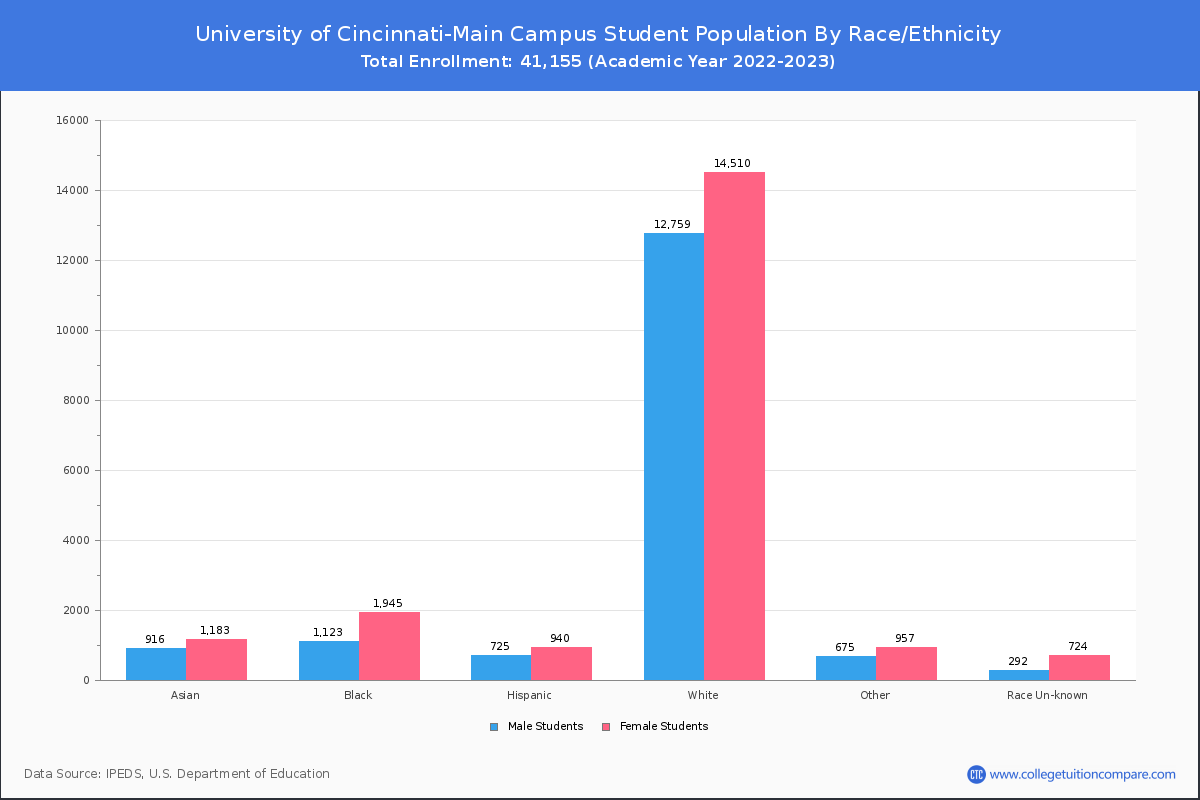
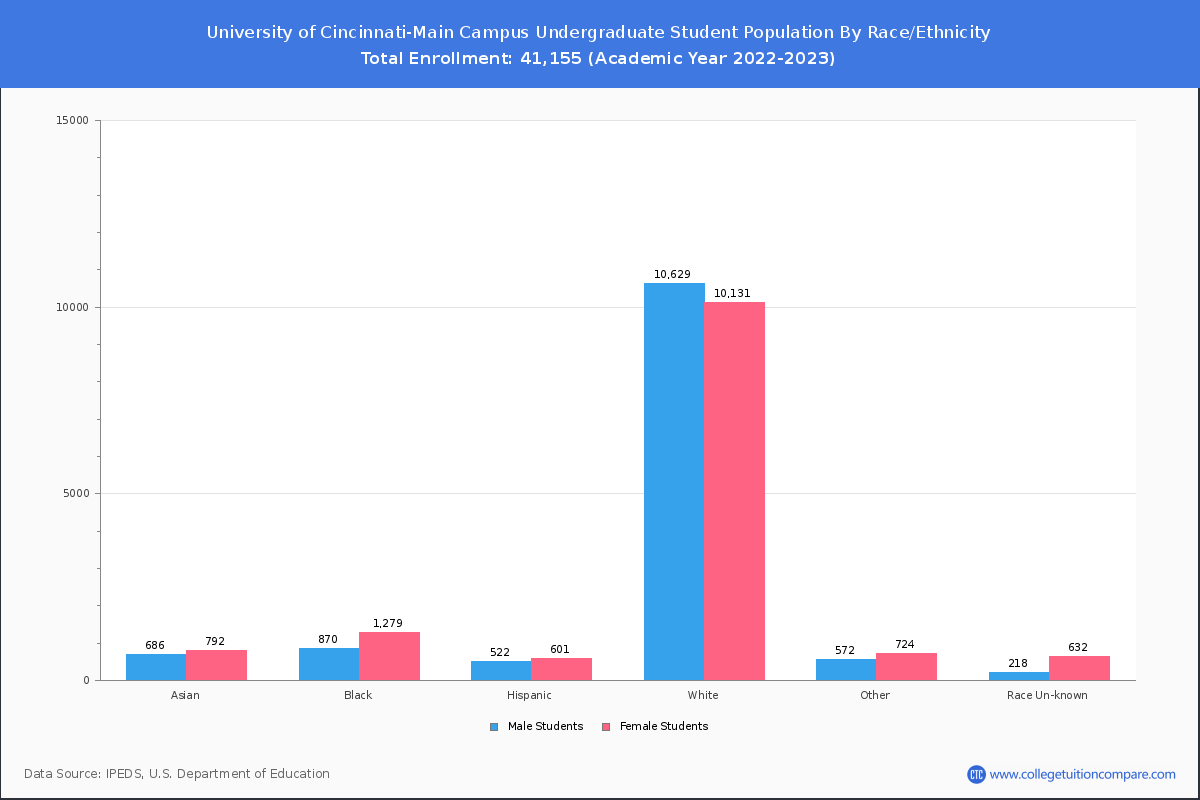
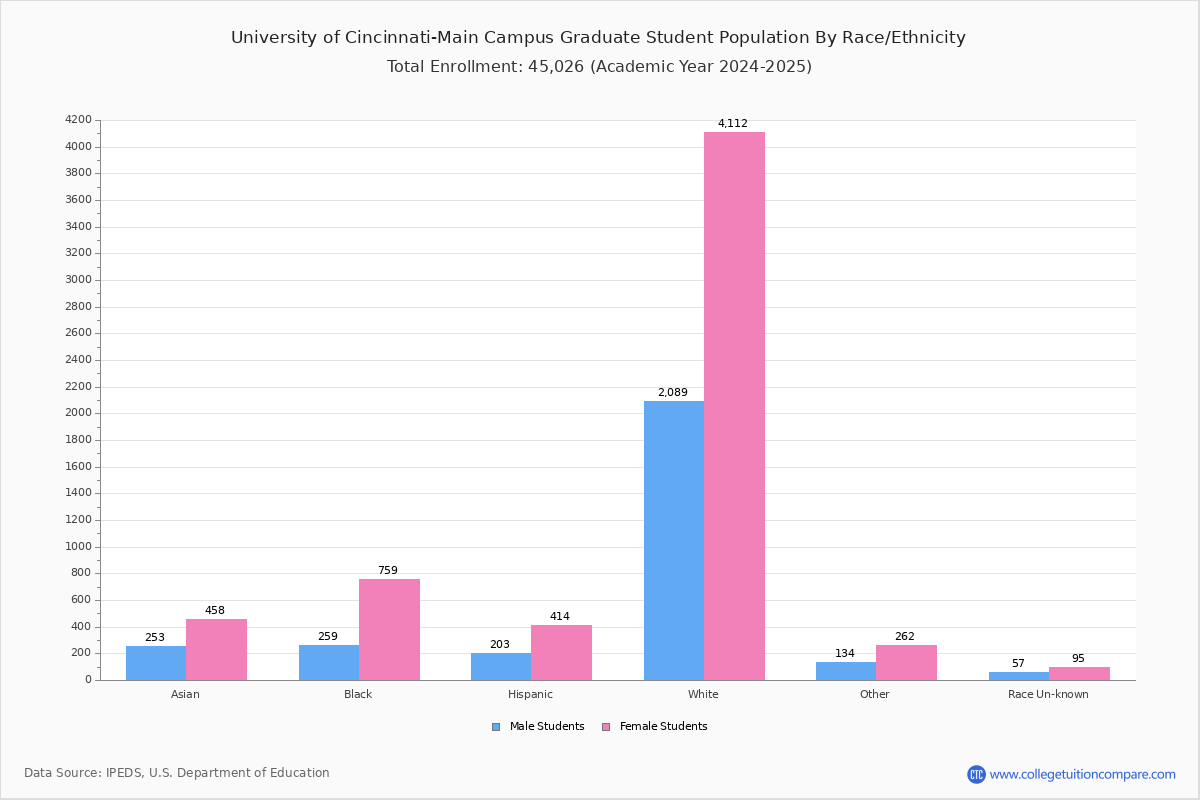
Student Distribution by Race/Ethnicity
By race/ethnicity, 27,297 White, 3,220 Black, and 2,201 Asian students out of a total of 41,155 are attending at University of Cincinnati-Main Campus. Comprehensive enrollment statistic data by race/ethnicity is shown in the next chart (Academic year 2022-2023 data).
| Race | Total | Men | Women |
|---|---|---|---|
| American Indian or Native American | 50 | 23 | 27 |
| Asian | 2,201 | 964 | 1,237 |
| Black | 3,220 | 1,197 | 2,023 |
| Hispanic | 1,789 | 767 | 1,022 |
| Native Hawaiian or Other Pacific Islanders | 24 | 8 | 16 |
| White | 27,297 | 12,784 | 14,513 |
| Two or more races | 1,606 | 675 | 931 |
| Race Unknown | 767 | 256 | 511 |
| Race | Total | Men | Women |
|---|---|---|---|
| American Indian or Native American | 41 | 21 | 20 |
| Asian | 1,592 | 725 | 867 |
| Black | 2,312 | 945 | 1,367 |
| Hispanic | 1,254 | 576 | 678 |
| Native Hawaiian or Other Pacific Islanders | 15 | 6 | 9 |
| White | 21,091 | 10,763 | 10,328 |
| Two or more races | 1,307 | 571 | 736 |
| Race Unknown | 611 | 183 | 428 |
| Race | Total | Men | Women |
|---|---|---|---|
| American Indian or Native American | 5 | 2 | 3 |
| Asian | 44 | 11 | 33 |
| Black | 179 | 56 | 123 |
| Hispanic | 74 | 30 | 44 |
| Native Hawaiian or Other Pacific Islanders | 3 | 1 | 2 |
| White | 847 | 331 | 516 |
| Two or more races | 49 | 19 | 30 |
| Race Unknown | 12 | 4 | 8 |
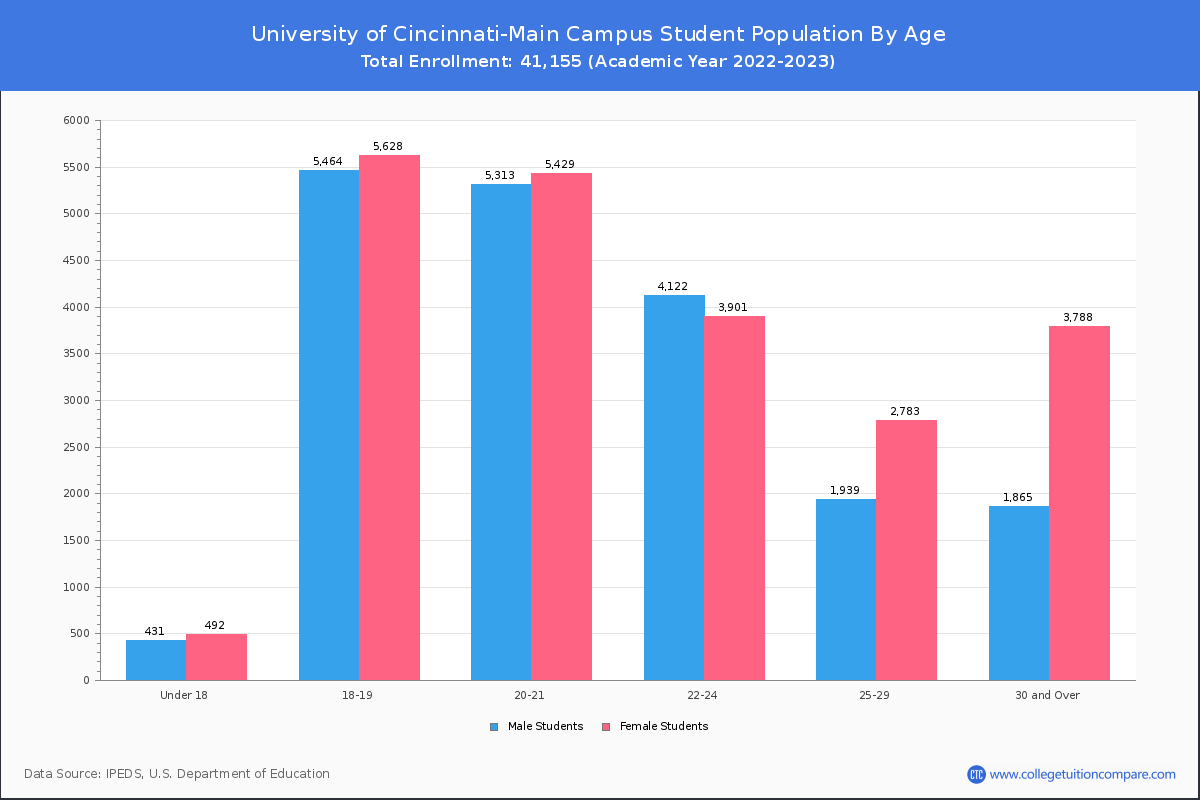
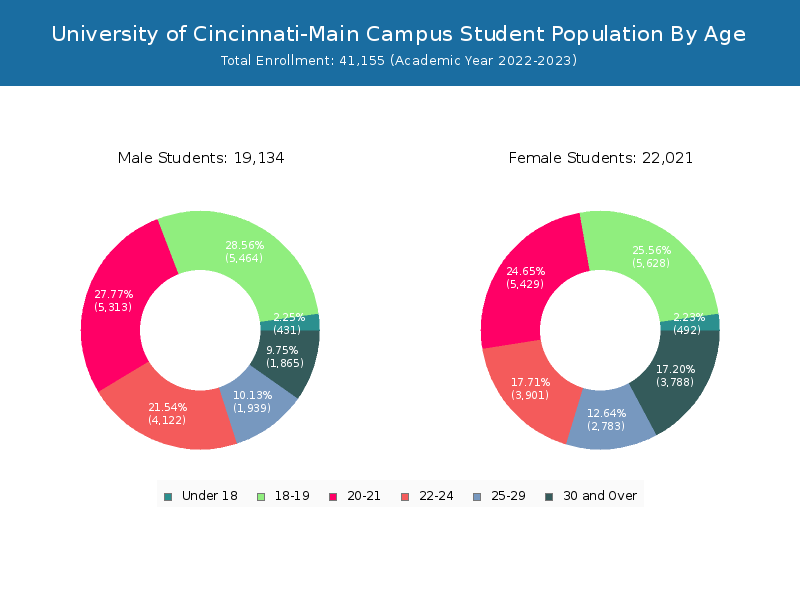
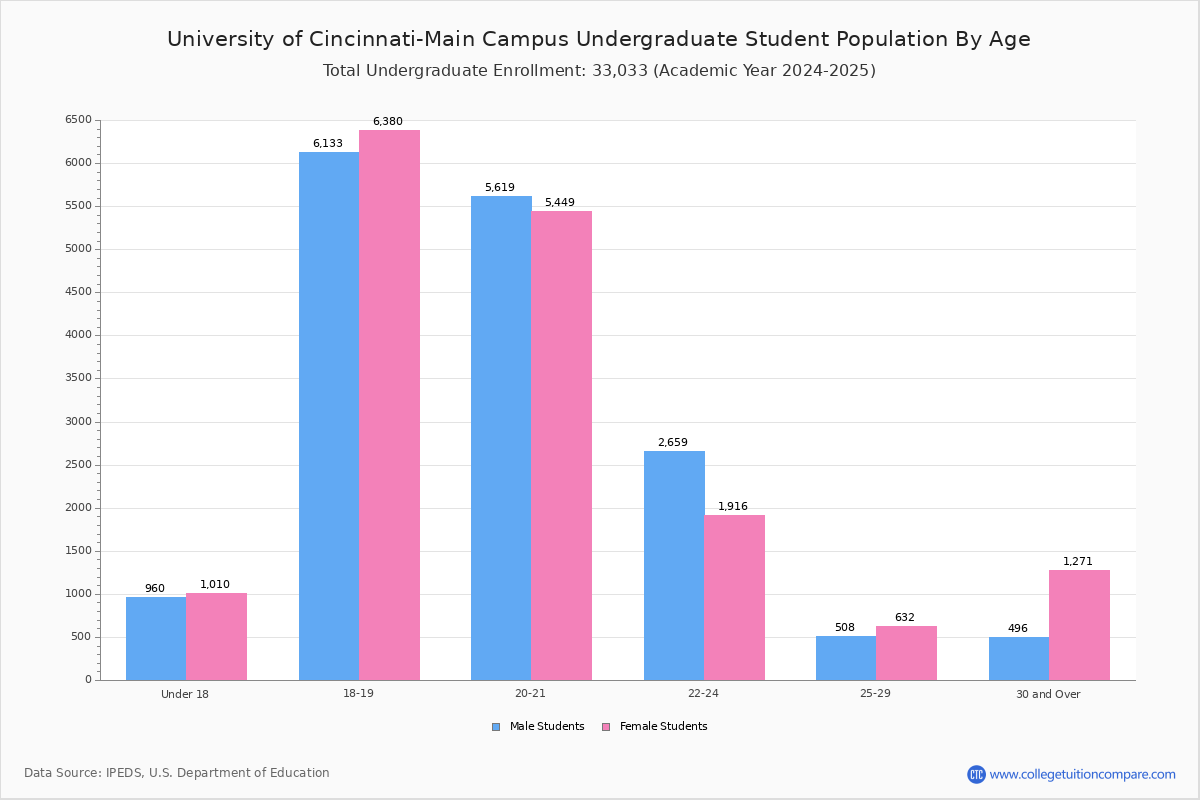
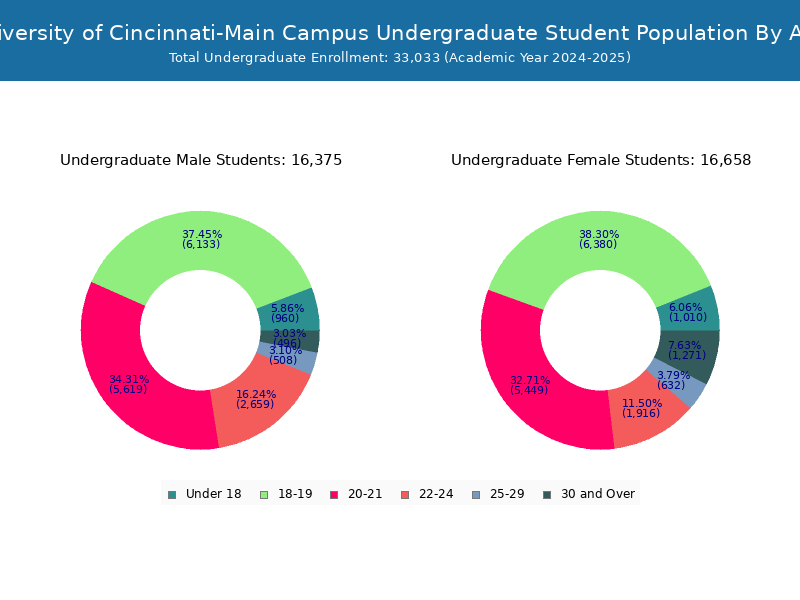
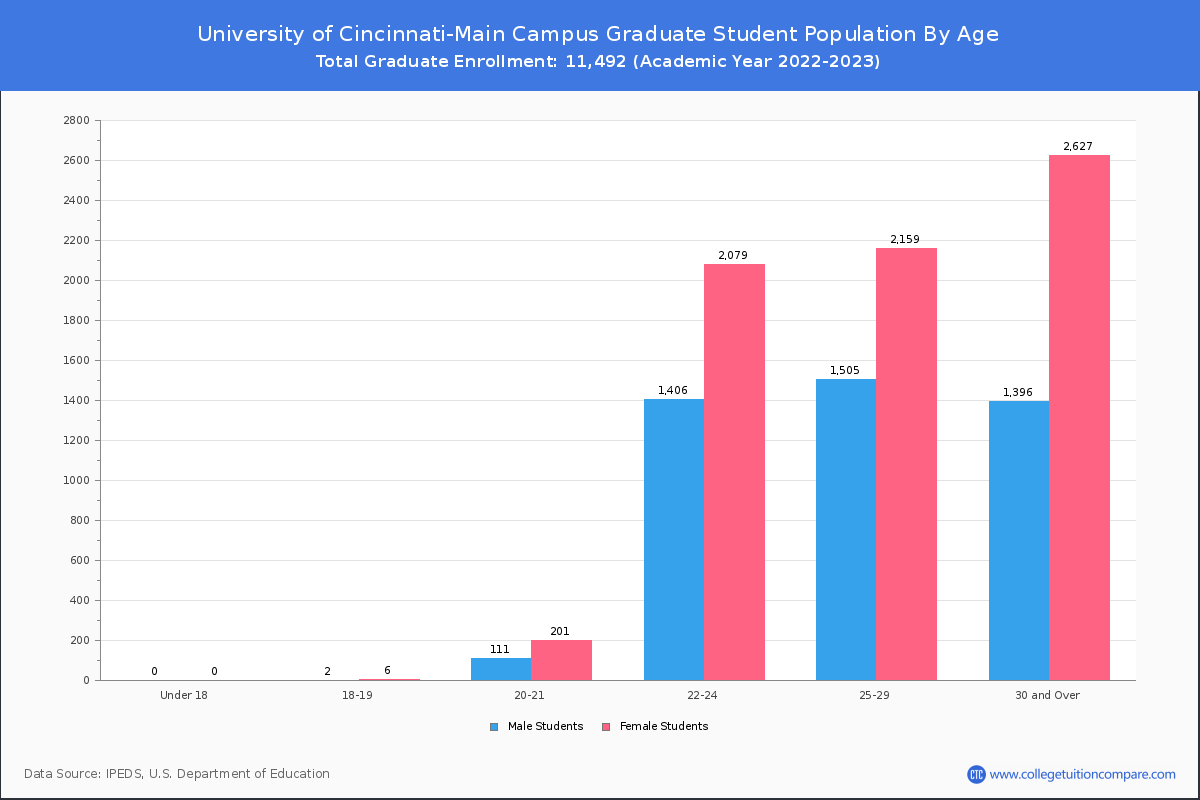
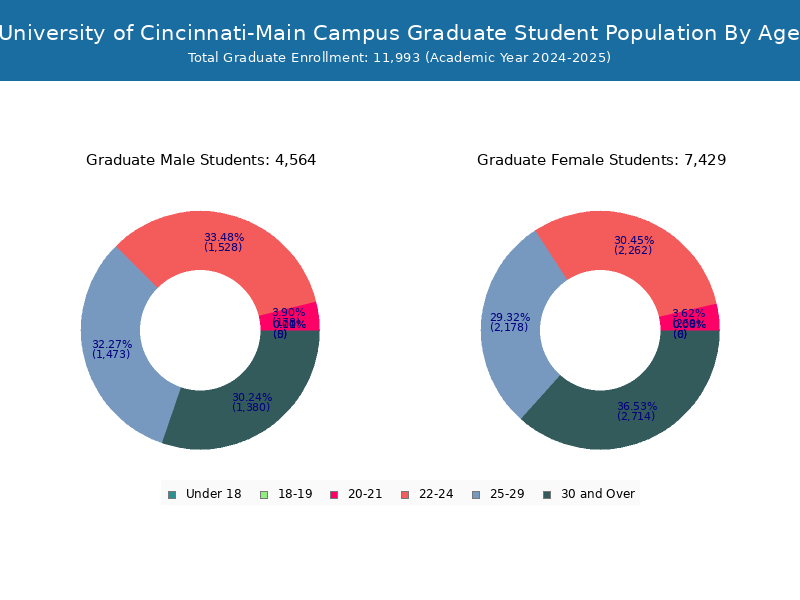
Student Age Distribution
By age, U of Cincinnati-Main Campus has 923 students under 18 years old and 34 students over 65 years old. There are 30,780 students under 25 years old, and 10,375 students over 25 years old out of 41,155 total students.
In undergraduate programs, 923 students are younger than 18 and 14 students are older than 65. U of Cincinnati-Main Campus has 26,975 undergraduate students aged under 25 and 2,688 students aged 25 and over.
It has 3,805 graduate students aged under 25 and 7,687 students aged 25 and over.
| Age | Total | Men | Women |
|---|---|---|---|
| Under 18 | 923 | 492 | 431 |
| 18-19 | 11,092 | 5,628 | 5,464 |
| 20-21 | 10,742 | 5,429 | 5,313 |
| 22-24 | 8,023 | 3,901 | 4,122 |
| 25-29 | 4,722 | 2,783 | 1,939 |
| 30-34 | 2,273 | 1,424 | 849 |
| 35-39 | 1,351 | 881 | 470 |
| 40-49 | 1,409 | 1,027 | 382 |
| 50-64 | 586 | 439 | 147 |
| Over 65 | 34 | 17 | 17 |
| Age | Total | Men | Women |
|---|---|---|---|
| Under 18 | 923 | 492 | 431 |
| 18-19 | 11,084 | 5,622 | 5,462 |
| 20-21 | 10,430 | 5,228 | 5,202 |
| 22-24 | 4,538 | 1,822 | 2,716 |
| 25-29 | 1,058 | 624 | 434 |
| 30-34 | 603 | 416 | 187 |
| 35-39 | 370 | 259 | 111 |
| 40-49 | 439 | 326 | 113 |
| 50-64 | 204 | 153 | 51 |
| Over 65 | 14 | 7 | 7 |
| Age | Total | Men | Women |
|---|
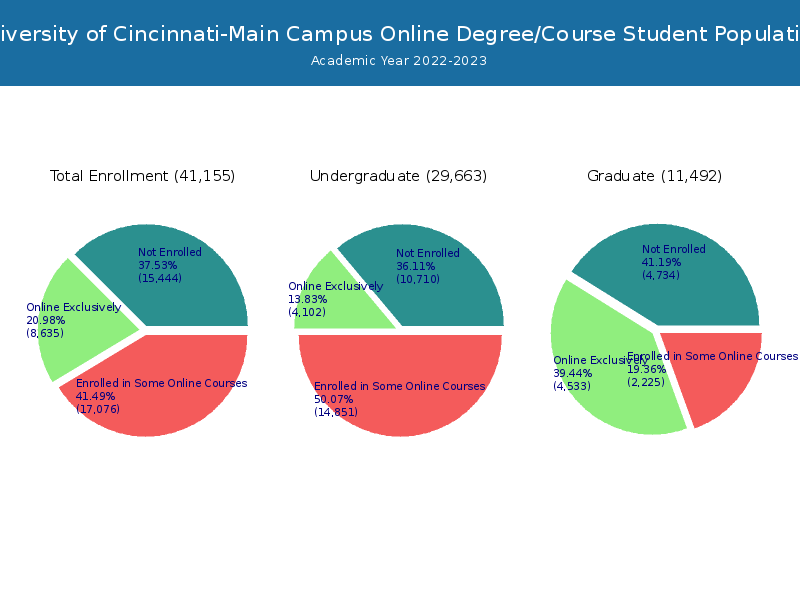
Online Student Enrollment
Distance learning, also called online education, is very attractive to students, especially who want to continue education and work in field. At University of Cincinnati-Main Campus, 8,635 students are enrolled exclusively in online courses and 17,076 students are enrolled in some online courses.
5,103 students lived in Ohio or jurisdiction in which the school is located are enrolled exclusively in online courses and 3,532 students live in other State or outside of the United States.
| All Students | Enrolled Exclusively Online Courses | Enrolled in Some Online Courses | |
|---|---|---|---|
| All Students | 41,155 | 8,635 | 17,076 |
| Undergraduate | 29,663 | 4,102 | 14,851 |
| Graduate | 11,492 | 4,533 | 2,225 |
| Ohio Residents | Other States in U.S. | Outside of U.S. | |
|---|---|---|---|
| All Students | 5,103 | 3,356 | 176 |
| Undergraduate | 3,072 | 971 | 59 |
| Graduate | 2,031 | 2,385 | 117 |
Transfer-in Students (Undergraduate)
Among 29,663 enrolled in undergraduate programs, 1,263 students have transferred-in from other institutions. The percentage of transfer-in students is 4.26%.920 students have transferred in as full-time status and 343 students transferred in as part-time status.
| Number of Students | |
|---|---|
| Regular Full-time | 24,096 |
| Transfer-in Full-time | 920 |
| Regular Part-time | 4,304 |
| Transfer-in Part-time | 343 |