Graduation Rates in Reasonable Completion Time
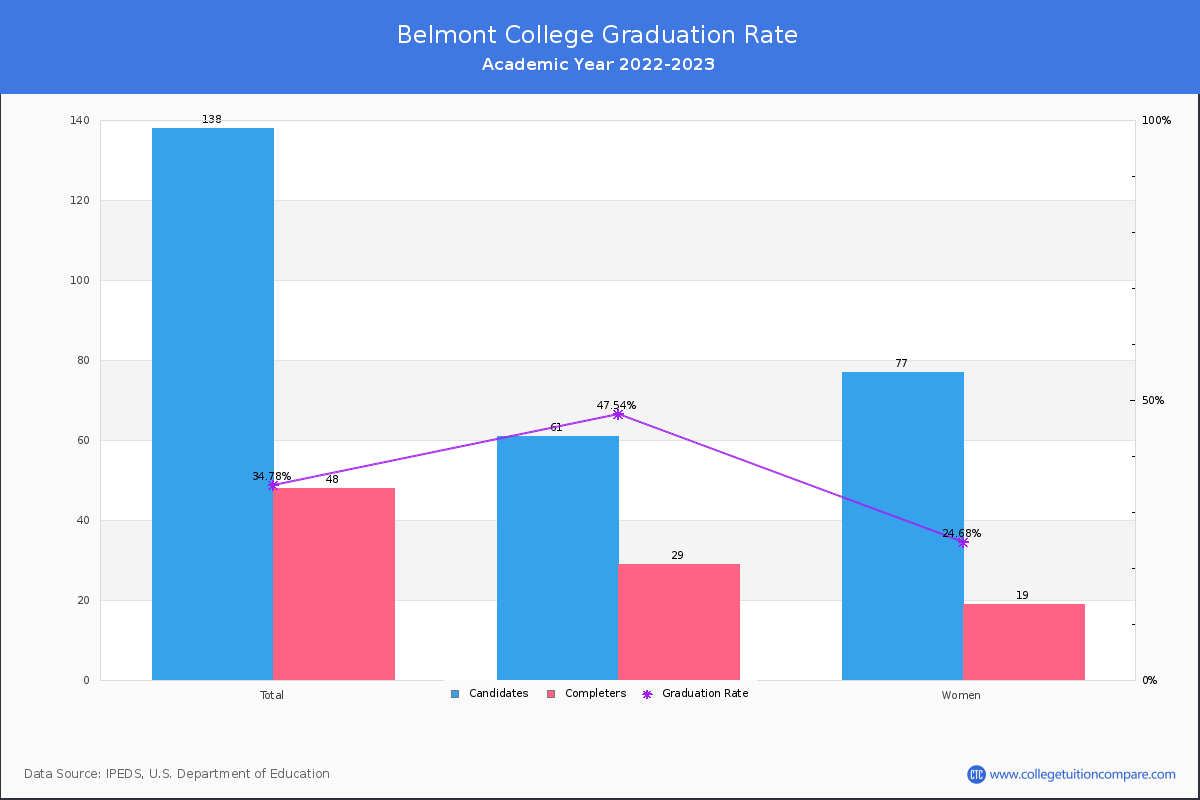
For the academic year 2022-2023, 48 students out of 138 candidates have completed their courses within 150% normal time (i.e. in 3 years for 2-year Associate degree) at Belmont College.
By gender, 29 male and 19 female students graduated the school last year completing their jobs in the period. Its graduation rate is around the average rate when comparing similar colleges' rate of 34.56% (public special-use Associate's college).
| Candidates | Completers | Graduation Rates | |
|---|---|---|---|
| Total | 138 | 48 | 34.78% |
| Men | 61 | 29 | 47.54% |
| Women | 77 | 19 | 24.68% |
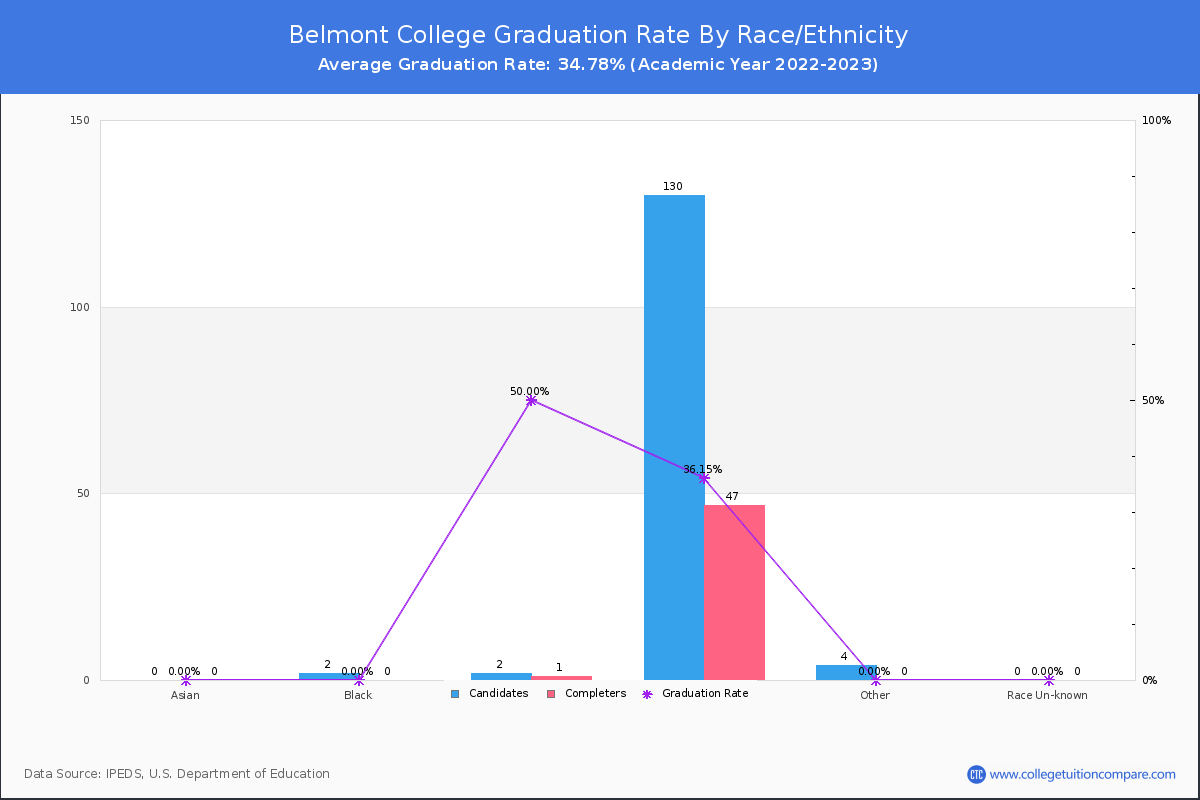
Graduation Rate By Race/Ethnicity
The following table shows graduation rate by race and at Belmont College.
- American Indian or Alaska Native: 0.00%
- Black (Non-Hispanic): 0.00%
- Hispanic: 50.00%
- White: 36.15%
- Two or More Race: 0.00%
| Total | Male | Female | |
|---|---|---|---|
| American Indian or Alaska Native | 0.00%(-/1) | - | - |
| Black (Non-Hispanic) | 0.00%(-/2) | - | - |
| Hispanic | 50.00%(1/2) | 100.00%(1/1) | - |
| White | 36.15%(47/130) | 49.12%(28/57) | 26.03%(19/73) |
| Two or More Race | 0.00%(-/3) | - | - |
Transfer-out and Retention Rates
At Belmont, the transfer-out rate is 15.22%. Its transfer-out rate is relatively higher than the average rate when comparing similar colleges' rate of 12.73%.
Belmont's retention rate is 51% for full-time students and 35 % for part-time students last year. Its retention rate is relatively lower than the average rate when comparing similar colleges' rate of 59.91%.