Graduation Rates in Reasonable Completion Time
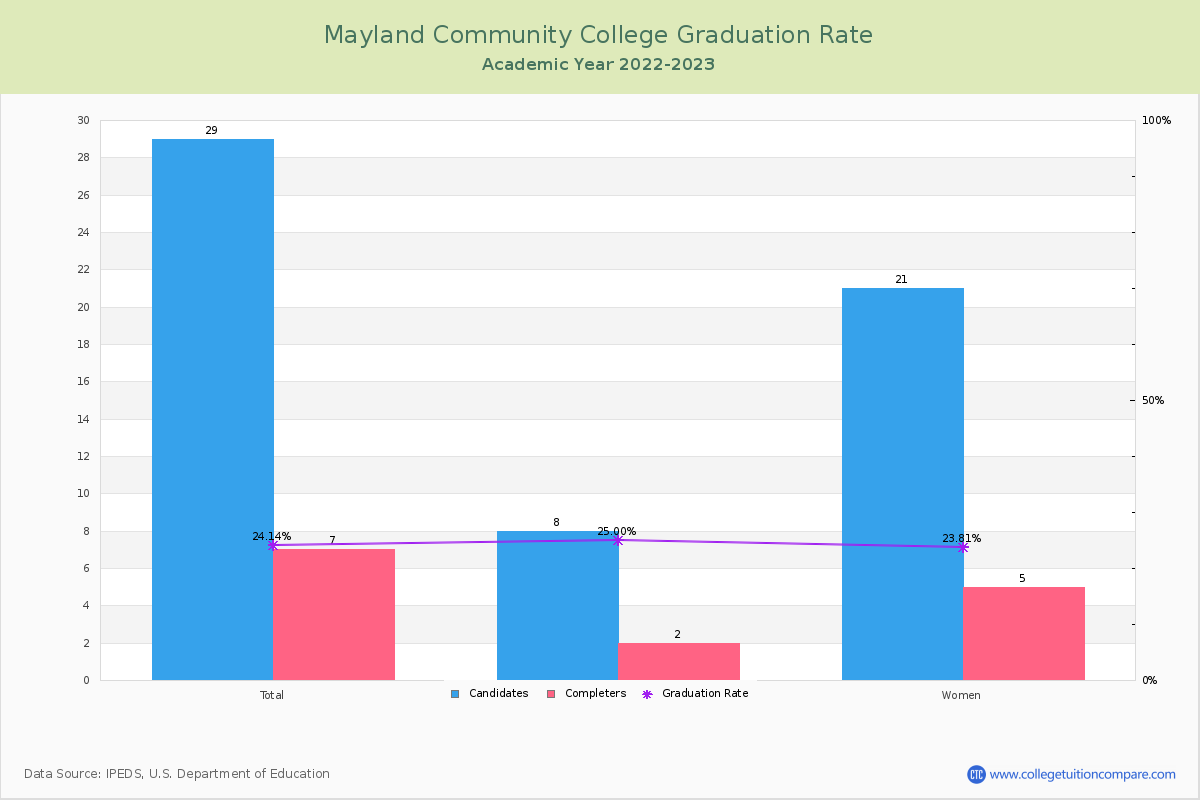
For the academic year 2022-2023, 7 students out of 29 candidates have completed their courses within 150% normal time (i.e. in 3 years for 2-year Associate degree) at Mayland Community College.
By gender, 2 male and 5 female students graduated the school last year completing their jobs in the period. Its graduation rate is relatively lower than the average rate when comparing similar colleges' rate of 32.47% (public urban-serving Associate's college).
| Candidates | Completers | Graduation Rates | |
|---|---|---|---|
| Total | 29 | 7 | 24.14% |
| Men | 8 | 2 | 25.00% |
| Women | 21 | 5 | 23.81% |
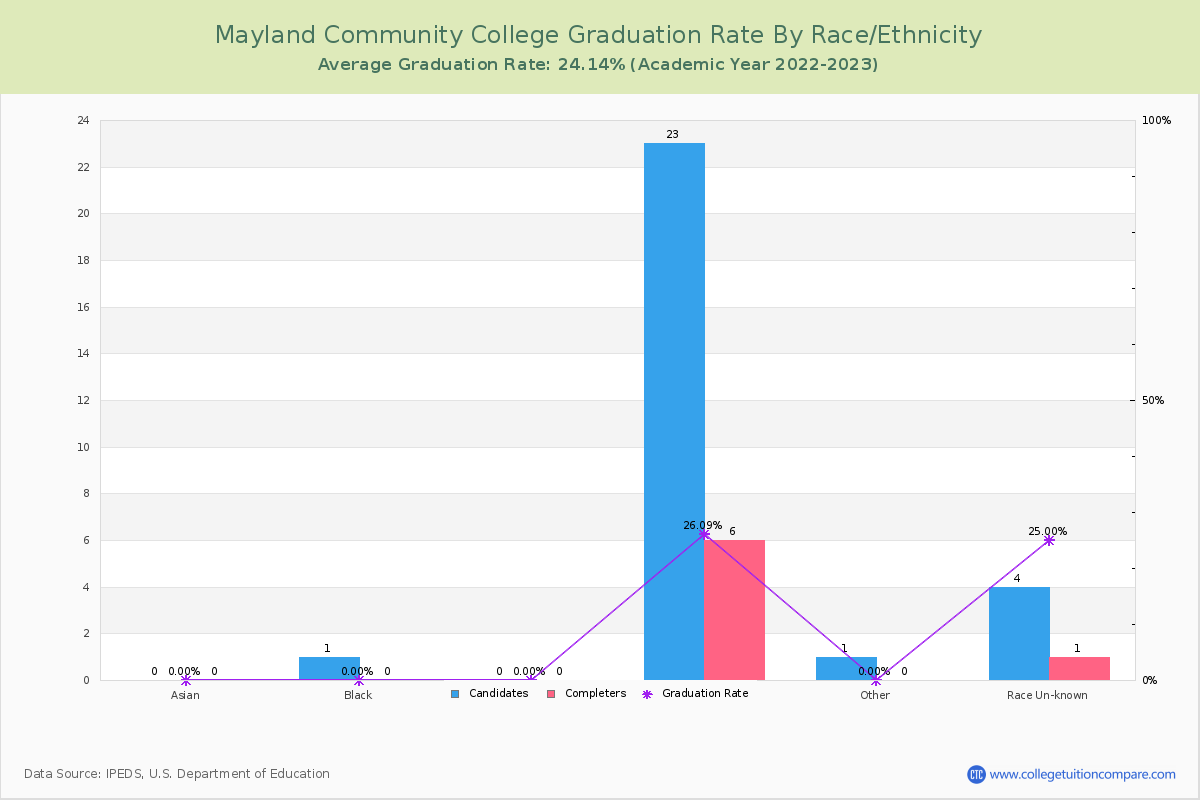
Graduation Rate By Race/Ethnicity
The following table shows graduation rate by race and at Mayland Community College.
- American Indian or Alaska Native: 0.00%
- Black (Non-Hispanic): 0.00%
- White: 26.09%
- Unknown: 25.00%
| Total | Male | Female | |
|---|---|---|---|
| American Indian or Alaska Native | 0.00%(-/1) | - | - |
| Black (Non-Hispanic) | 0.00%(-/1) | - | - |
| White | 26.09%(6/23) | 28.57%(2/7) | 25.00%(4/16) |
| Unknown | 25.00%(1/4) | - | 25.00%(1/4) |
Transfer-out and Retention Rates
At Mayland CC, the transfer-out rate is 24.14%. Its transfer-out rate is much higher than the average rate when comparing similar colleges' rate of 15.66%.
Mayland CC's retention rate is 67% for full-time students and 32 % for part-time students last year. Its retention rate is relatively higher than the average rate when comparing similar colleges' rate of 60.25%.