Graduation Rates in Reasonable Completion Time
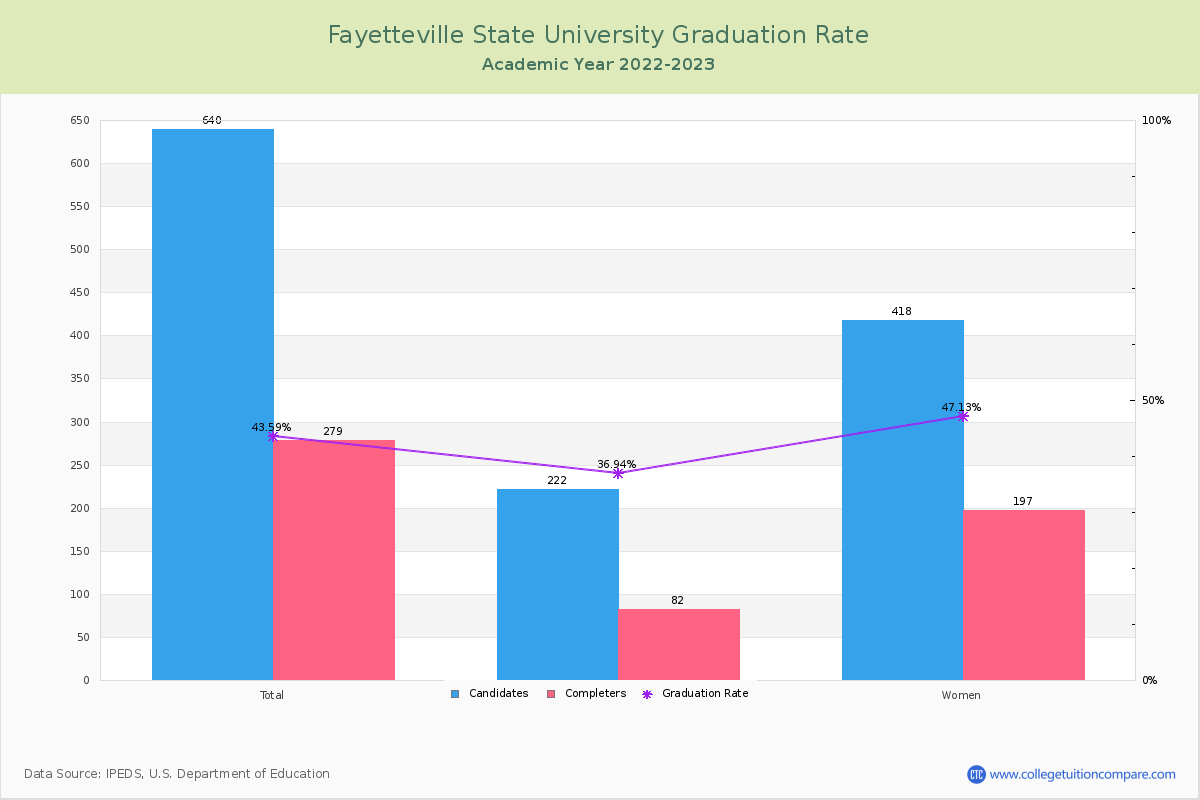
For the academic year 2022-2023, 279 students out of 640 candidates have completed their courses within 150% normal time (i.e. in 6 years for 4-year BS degree) at Fayetteville State University.
By gender, 82 male and 197 female students graduated the school last year completing their jobs in the period. Its graduation rate is around the average rate when comparing similar colleges' rate of 45.05% (public Master's College and University with medium programs).
| Candidates | Completers | Graduation Rates | |
|---|---|---|---|
| Total | 640 | 279 | 43.59% |
| Men | 222 | 82 | 36.94% |
| Women | 418 | 197 | 47.13% |
Graduation Rate By Race/Ethnicity
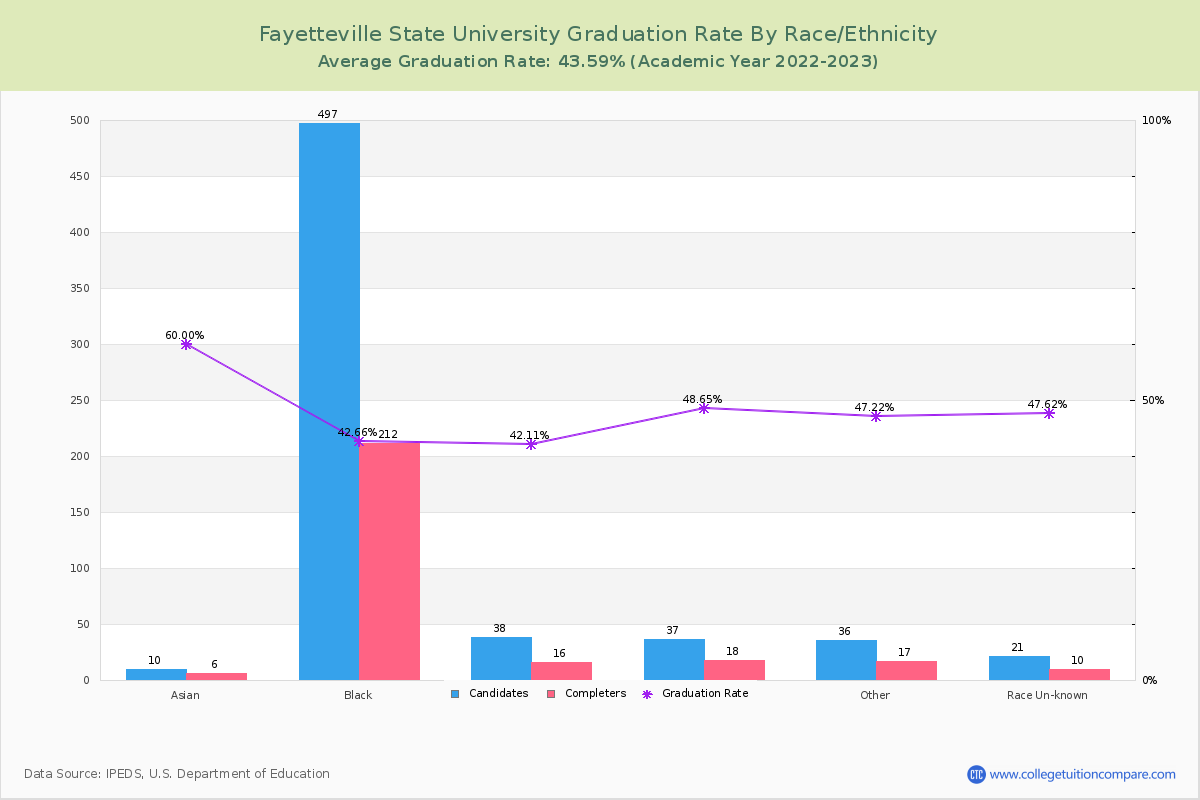
The following table shows graduation rate by race and at Fayetteville State University.
- American Indian or Alaska Native: 45.16%
- Asian: 60.00%
- Black (Non-Hispanic): 42.66%
- Hispanic: 42.11%
- White: 48.65%
- Native Hawaiian or Other Pacific Islander: 0.00%
- Two or More Race: 75.00%
- Unknown: 47.62%
| Total | Male | Female | |
|---|---|---|---|
| American Indian or Alaska Native | 45.16%(14/31) | 20.00%(2/10) | 57.14%(12/21) |
| Asian | 60.00%(6/10) | 75.00%(3/4) | 50.00%(3/6) |
| Black (Non-Hispanic) | 42.66%(212/497) | 34.94%(58/166) | 46.53%(154/331) |
| Hispanic | 42.11%(16/38) | 37.50%(6/16) | 45.45%(10/22) |
| White | 48.65%(18/37) | 60.00%(9/15) | 40.91%(9/22) |
| Native Hawaiian or Other Pacific Islander | 0.00%(-/1) | - | - |
| Two or More Race | 75.00%(3/4) | 100.00%(1/1) | 66.67%(2/3) |
| Unknown | 47.62%(10/21) | 30.00%(3/10) | 63.64%(7/11) |
Transfer-out and Retention Rates
At Fayetteville State, the transfer-out rate is 25.94%. Its transfer-out rate is around the average rate when comparing similar colleges' rate of 24.97%.
Fayetteville State's retention rate is 70% for full-time students and 20 % for part-time students last year. Its retention rate is around the average rate when comparing similar colleges' rate of 69.40%.