Student Population by Gender
Fayetteville State University has a total of 6,787 enrolled students for the academic year 2022-2023. 5,748 students have enrolled in undergraduate programs and 1,039 students joined graduate programs.
By gender, 2,065 male and 4,722 female students (the male-female ratio is 30:70) are attending the school. The gender distribution is based on the 2022-2023 data.
| Total | Undergraduate | Graduate | |
|---|---|---|---|
| Total | 6,787 | 5,748 | 1,039 |
| Men | 2,065 | 1,706 | 359 |
| Women | 4,722 | 4,042 | 680 |
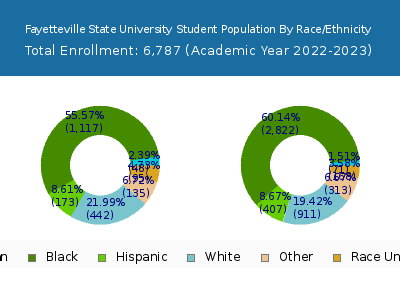
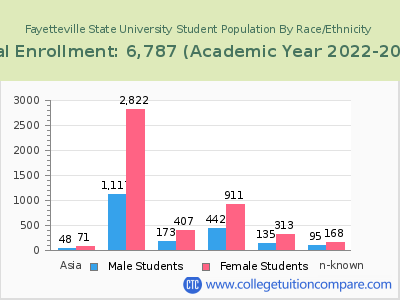
Student Distribution by Race/Ethnicity
| Race | Total | Men | Women |
|---|---|---|---|
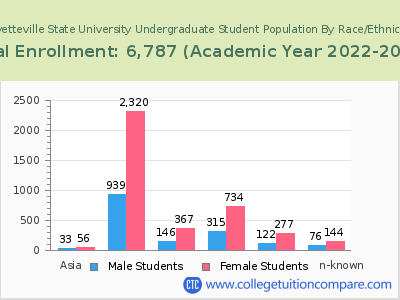
| American Indian or Native American | 89 | 21 | 68 |
| Asian | 103 | 42 | 61 |
| Black | 4,109 | 1,176 | 2,933 |
| Hispanic | 637 | 175 | 462 |
| Native Hawaiian or Other Pacific Islanders | 20 | 10 | 10 |
| White | 1,202 | 417 | 785 |
| Two or more races | 409 | 138 | 271 |
| Race Unknown | 159 | 62 | 97 |
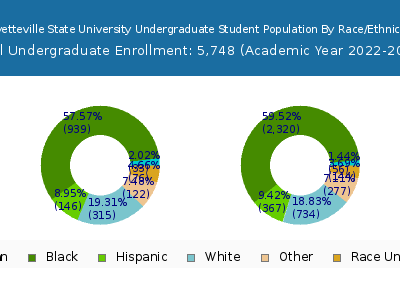
| Race | Total | Men | Women |
|---|---|---|---|
| American Indian or Native American | 74 | 17 | 57 |
| Asian | 83 | 31 | 52 |
| Black | 3,514 | 1,003 | 2,511 |
| Hispanic | 565 | 153 | 412 |
| Native Hawaiian or Other Pacific Islanders | 17 | 8 | 9 |
| White | 960 | 309 | 651 |
| Two or more races | 374 | 124 | 250 |
| Race Unknown | 124 | 48 | 76 |
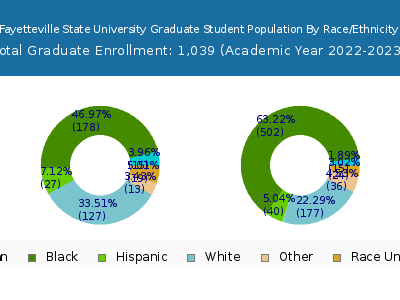
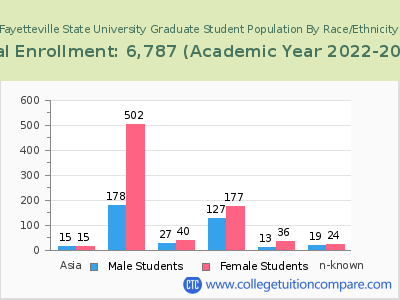
| Race | Total | Men | Women |
|---|---|---|---|
| American Indian or Native American | 18 | 5 | 13 |
| Asian | 10 | 0 | 10 |
| Black | 523 | 136 | 387 |
| Hispanic | 117 | 33 | 84 |
| Native Hawaiian or Other Pacific Islanders | 2 | 1 | 1 |
| White | 245 | 75 | 170 |
| Two or more races | 68 | 26 | 42 |
| Race Unknown | 27 | 12 | 15 |
Student Age Distribution
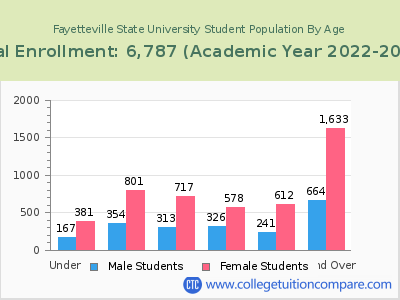
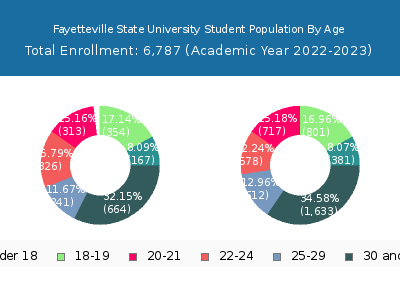
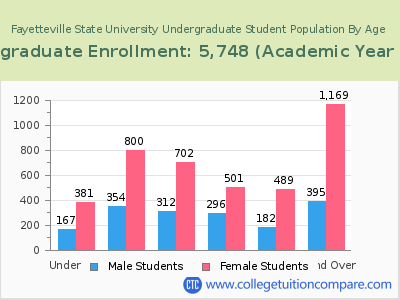
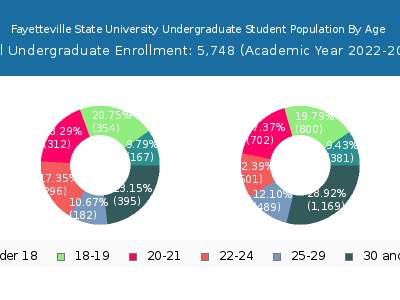
By age, Fayetteville State has 548 students under 18 years old and 28 students over 65 years old. There are 3,637 students under 25 years old, and 3,150 students over 25 years old out of 6,787 total students.
In undergraduate programs, 548 students are younger than 18 and 18 students are older than 65. Fayetteville State has 3,513 undergraduate students aged under 25 and 2,235 students aged 25 and over.
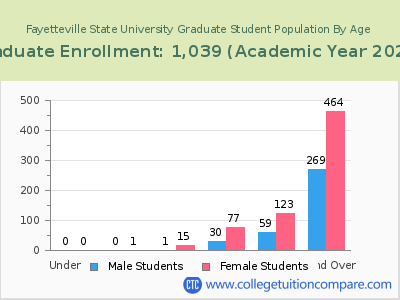
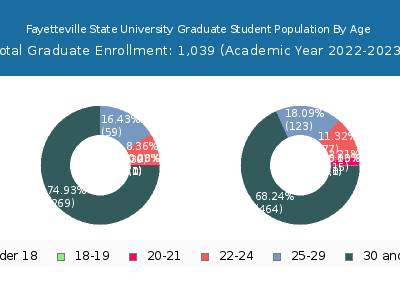
It has 124 graduate students aged under 25 and 915 students aged 25 and over.
| Age | Total | Men | Women |
|---|---|---|---|
| Under 18 | 548 | 381 | 167 |
| 18-19 | 1,155 | 801 | 354 |
| 20-21 | 1,030 | 717 | 313 |
| 22-24 | 904 | 578 | 326 |
| 25-29 | 853 | 612 | 241 |
| 30-34 | 691 | 497 | 194 |
| 35-39 | 497 | 349 | 148 |
| 40-49 | 713 | 506 | 207 |
| 50-64 | 368 | 261 | 107 |
| Over 65 | 28 | 20 | 8 |
| Age | Total | Men | Women |
|---|---|---|---|
| Under 18 | 548 | 381 | 167 |
| 18-19 | 1,154 | 800 | 354 |
| 20-21 | 1,014 | 702 | 312 |
| 22-24 | 797 | 501 | 296 |
| 25-29 | 671 | 489 | 182 |
| 30-34 | 519 | 390 | 129 |
| 35-39 | 343 | 253 | 90 |
| 40-49 | 446 | 335 | 111 |
| 50-64 | 238 | 178 | 60 |
| Over 65 | 18 | 13 | 5 |
| Age | Total | Men | Women |
|---|
Online Student Enrollment
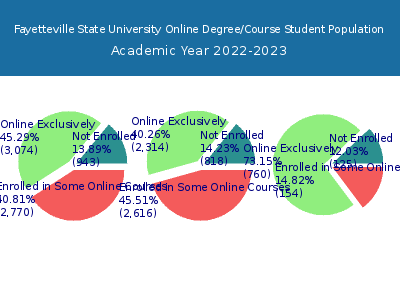
Distance learning, also called online education, is very attractive to students, especially who want to continue education and work in field. At Fayetteville State University, 3,074 students are enrolled exclusively in online courses and 2,770 students are enrolled in some online courses.
2,843 students lived in North Carolina or jurisdiction in which the school is located are enrolled exclusively in online courses and 231 students live in other State or outside of the United States.
| All Students | Enrolled Exclusively Online Courses | Enrolled in Some Online Courses | |
|---|---|---|---|
| All Students | 6,787 | 3,074 | 2,770 |
| Undergraduate | 5,748 | 2,314 | 2,616 |
| Graduate | 1,039 | 760 | 154 |
| North Carolina Residents | Other States in U.S. | Outside of U.S. | |
|---|---|---|---|
| All Students | 2,843 | 218 | 13 |
| Undergraduate | 2,168 | 144 | 2 |
| Graduate | 675 | 74 | 11 |
Transfer-in Students (Undergraduate)
Among 5,748 enrolled in undergraduate programs, 1,020 students have transferred-in from other institutions. The percentage of transfer-in students is 17.75%.754 students have transferred in as full-time status and 266 students transferred in as part-time status.
| Number of Students | |
|---|---|
| Regular Full-time | 3,265 |
| Transfer-in Full-time | 754 |
| Regular Part-time | 1,463 |
| Transfer-in Part-time | 266 |
