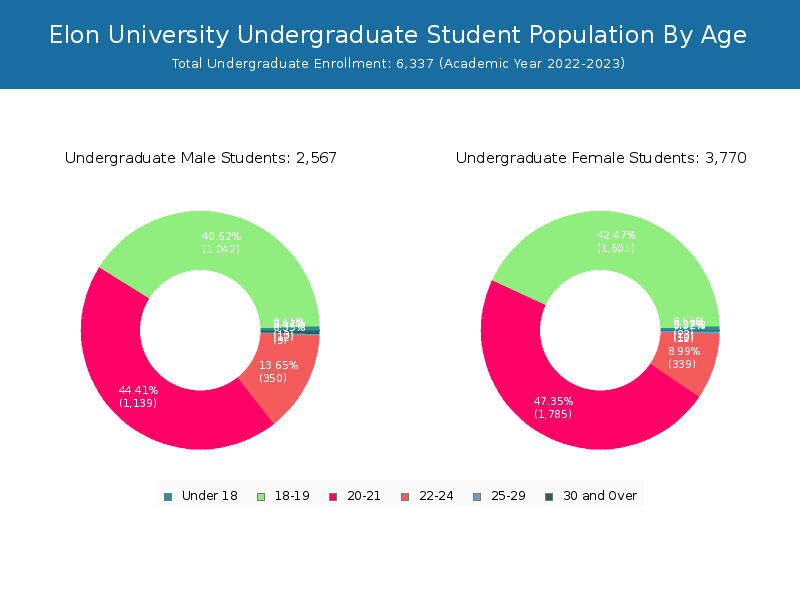
Student Population by Gender
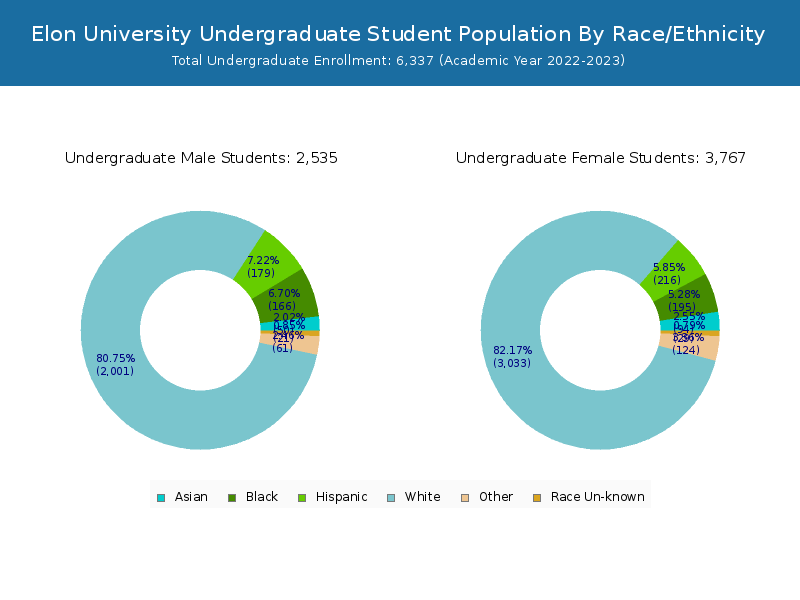
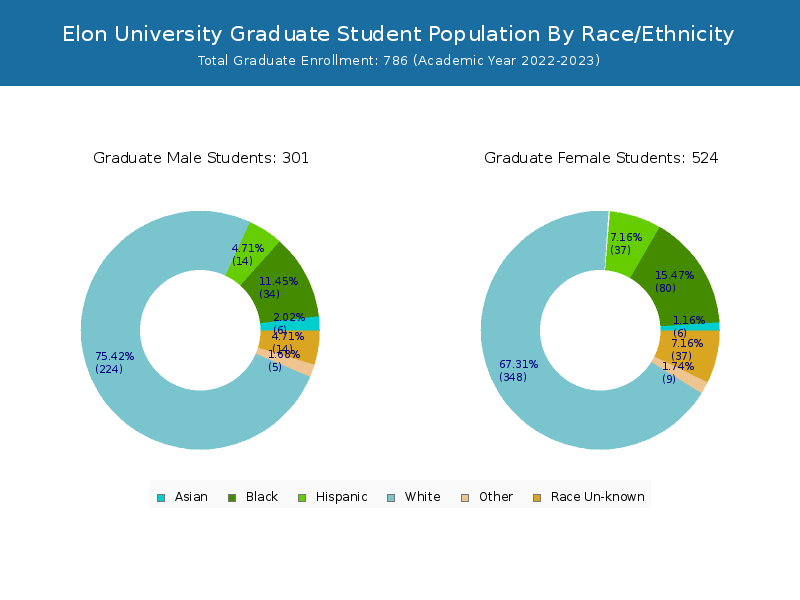
Elon University has a total of 7,123 enrolled students for the academic year 2022-2023. 6,337 students have enrolled in undergraduate programs and 786 students joined graduate programs.
By gender, 2,850 male and 4,273 female students (the male-female ratio is 40:60) are attending the school. The gender distribution is based on the 2022-2023 data.
| Total | Undergraduate | Graduate | |
|---|---|---|---|
| Total | 7,123 | 6,337 | 786 |
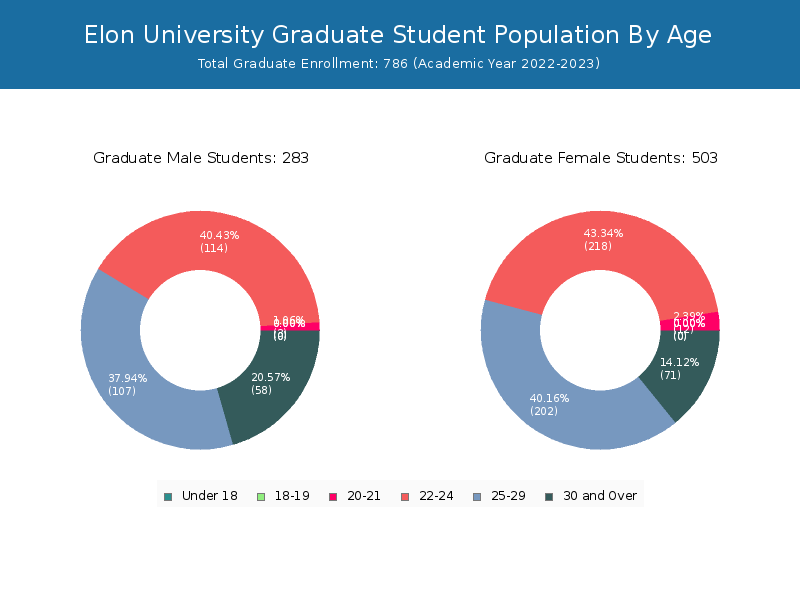
| Men | 2,850 | 2,567 | 283 |
| Women | 4,273 | 3,770 | 503 |
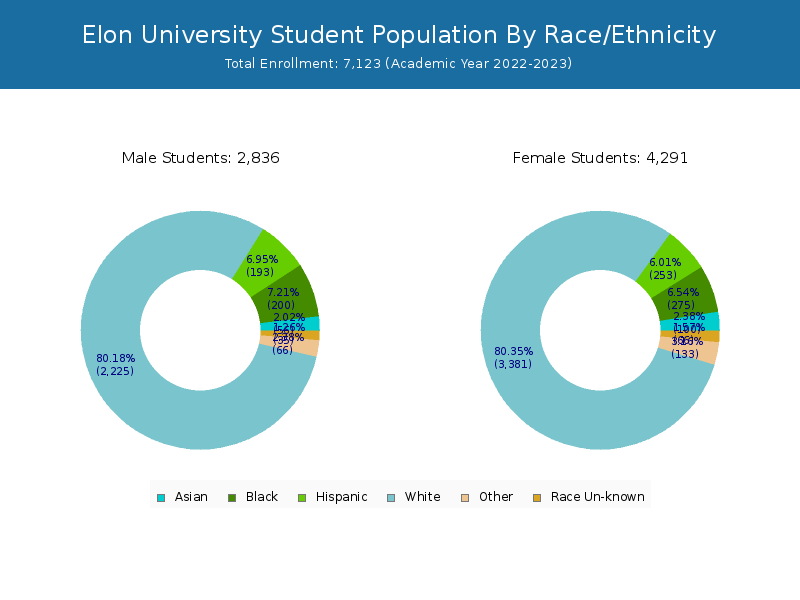
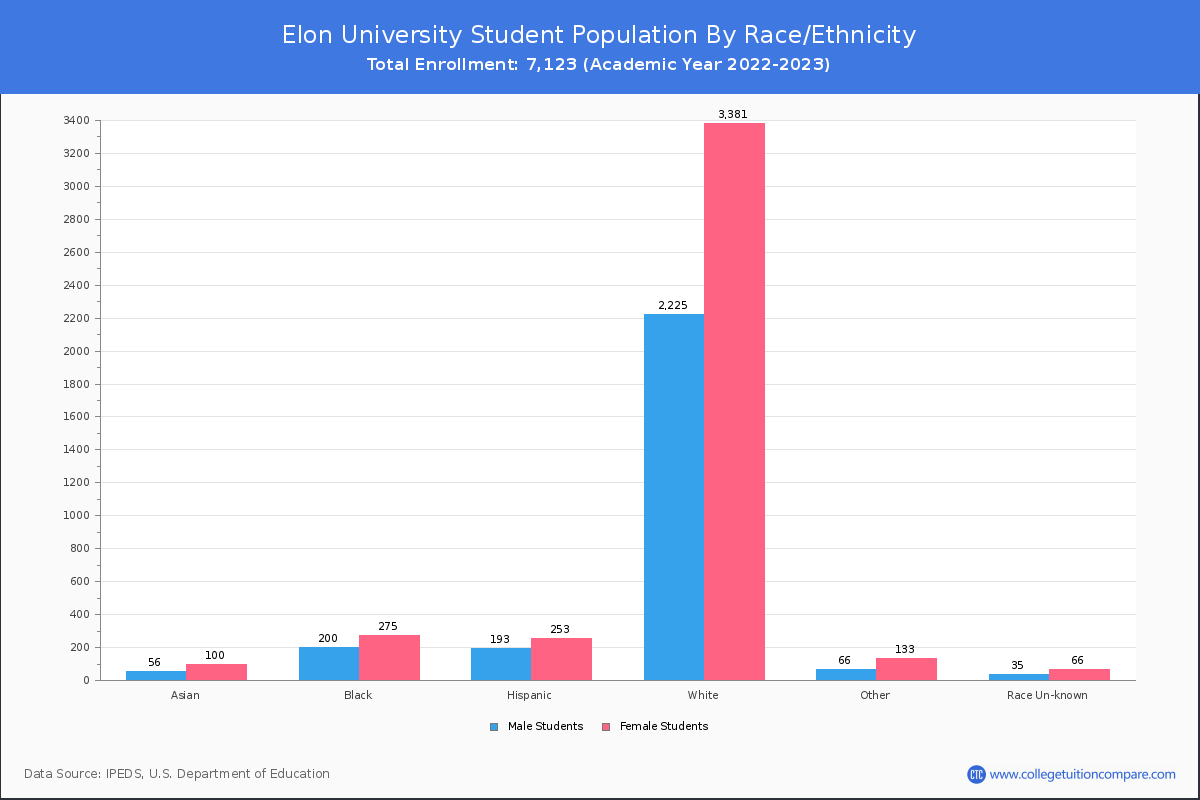
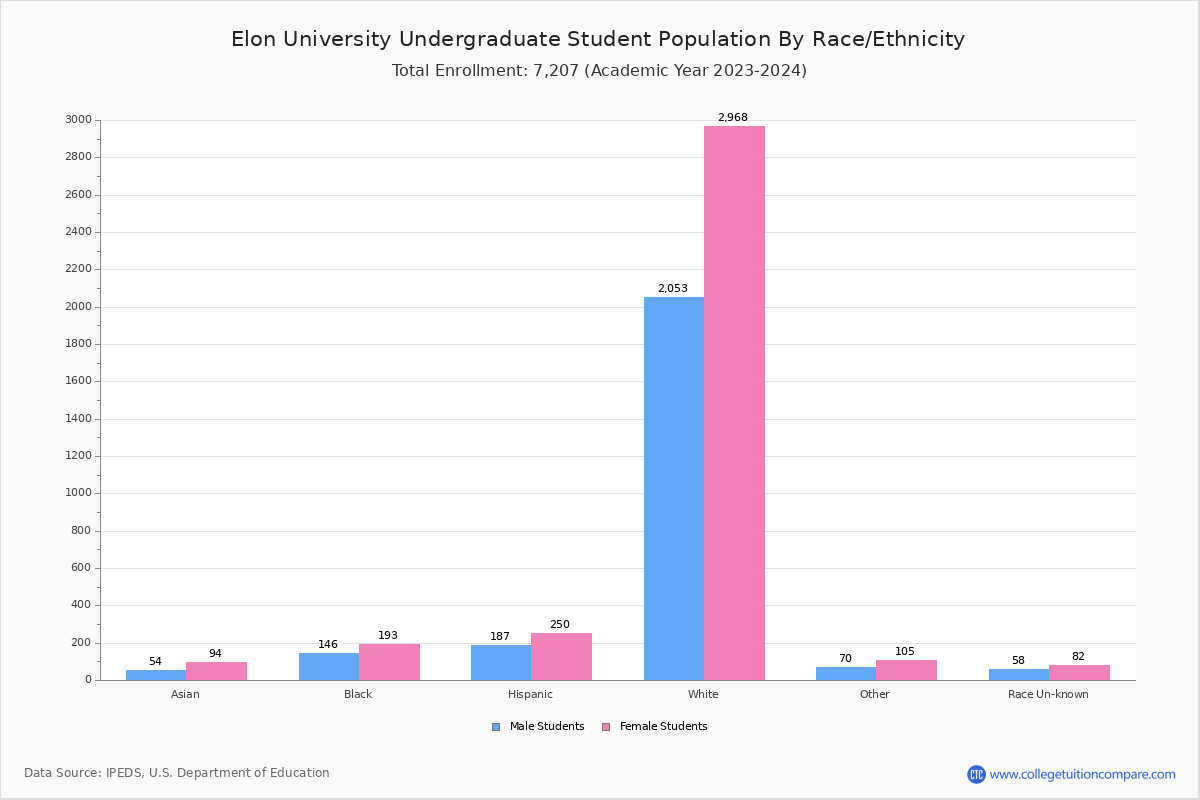
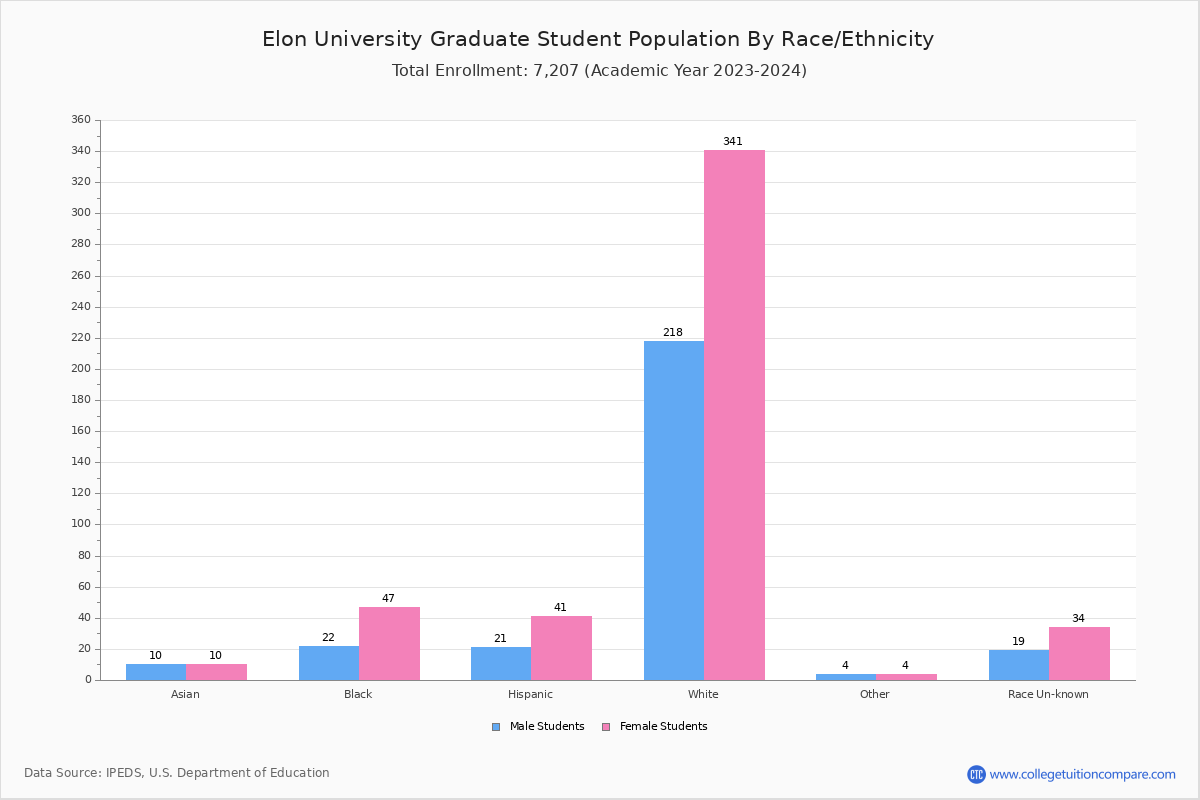
Student Distribution by Race/Ethnicity
By race/ethnicity, 5,553 White, 456 Black, and 166 Asian students out of a total of 7,123 are attending at Elon University. Comprehensive enrollment statistic data by race/ethnicity is shown in the next chart (Academic year 2022-2023 data).
| Race | Total | Men | Women |
|---|---|---|---|
| American Indian or Native American | 13 | 9 | 4 |
| Asian | 166 | 56 | 110 |
| Black | 456 | 190 | 266 |
| Hispanic | 457 | 189 | 268 |
| Native Hawaiian or Other Pacific Islanders | 1 | 1 | 0 |
| White | 5,553 | 2,222 | 3,331 |
| Two or more races | 207 | 72 | 135 |
| Race Unknown | 112 | 41 | 71 |
| Race | Total | Men | Women |
|---|---|---|---|
| American Indian or Native American | 8 | 6 | 2 |
| Asian | 148 | 48 | 100 |
| Black | 363 | 167 | 196 |
| Hispanic | 405 | 175 | 230 |
| Native Hawaiian or Other Pacific Islanders | 1 | 1 | 0 |
| White | 5,008 | 2,011 | 2,997 |
| Two or more races | 198 | 70 | 128 |
| Race Unknown | 68 | 26 | 42 |
| Race | Total | Men | Women |
|---|---|---|---|
| American Indian or Native American | 1 | 1 | 0 |
| Asian | 1 | 0 | 1 |
| Black | 8 | 5 | 3 |
| Hispanic | 9 | 6 | 3 |
| Native Hawaiian or Other Pacific Islanders | 0 | 0 | 0 |
| White | 64 | 35 | 29 |
| Two or more races | 8 | 5 | 3 |
| Race Unknown | 0 | 0 | 0 |
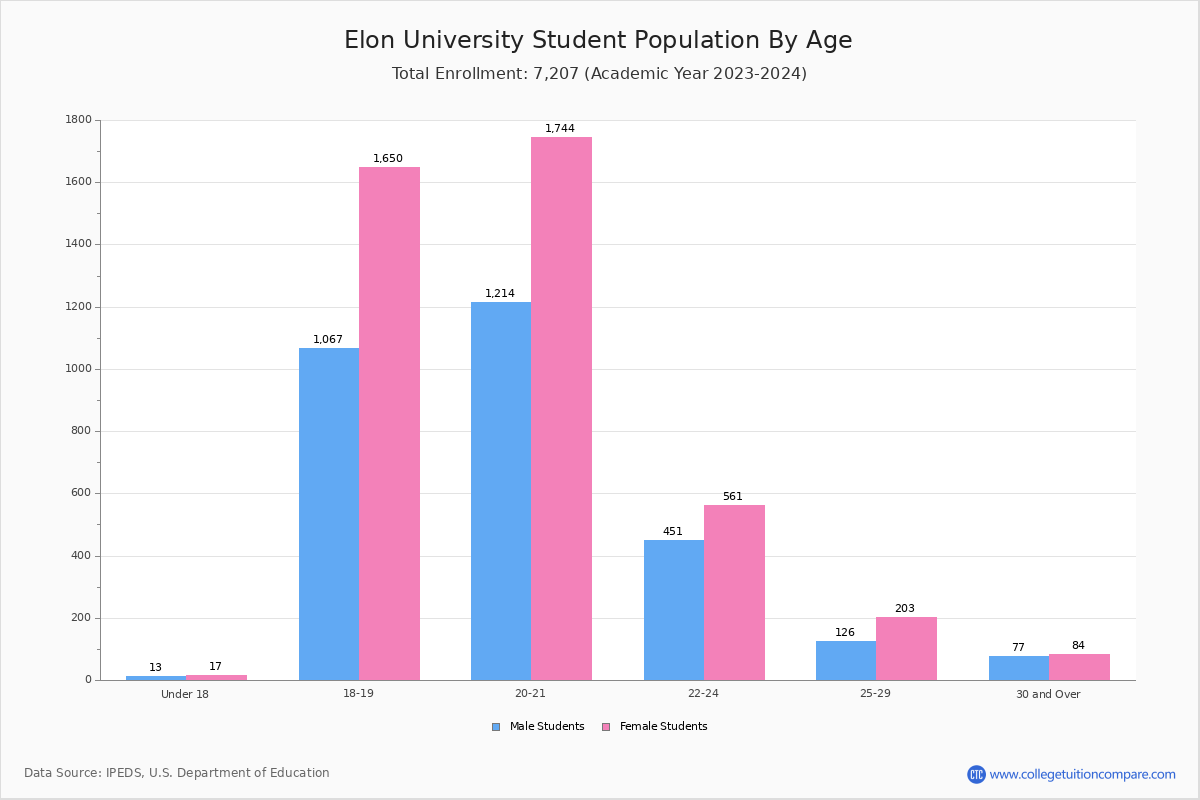
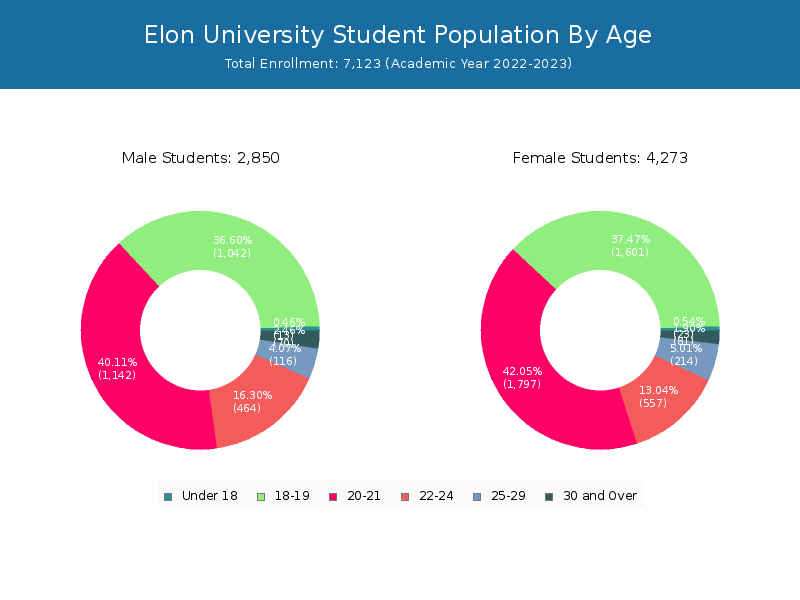
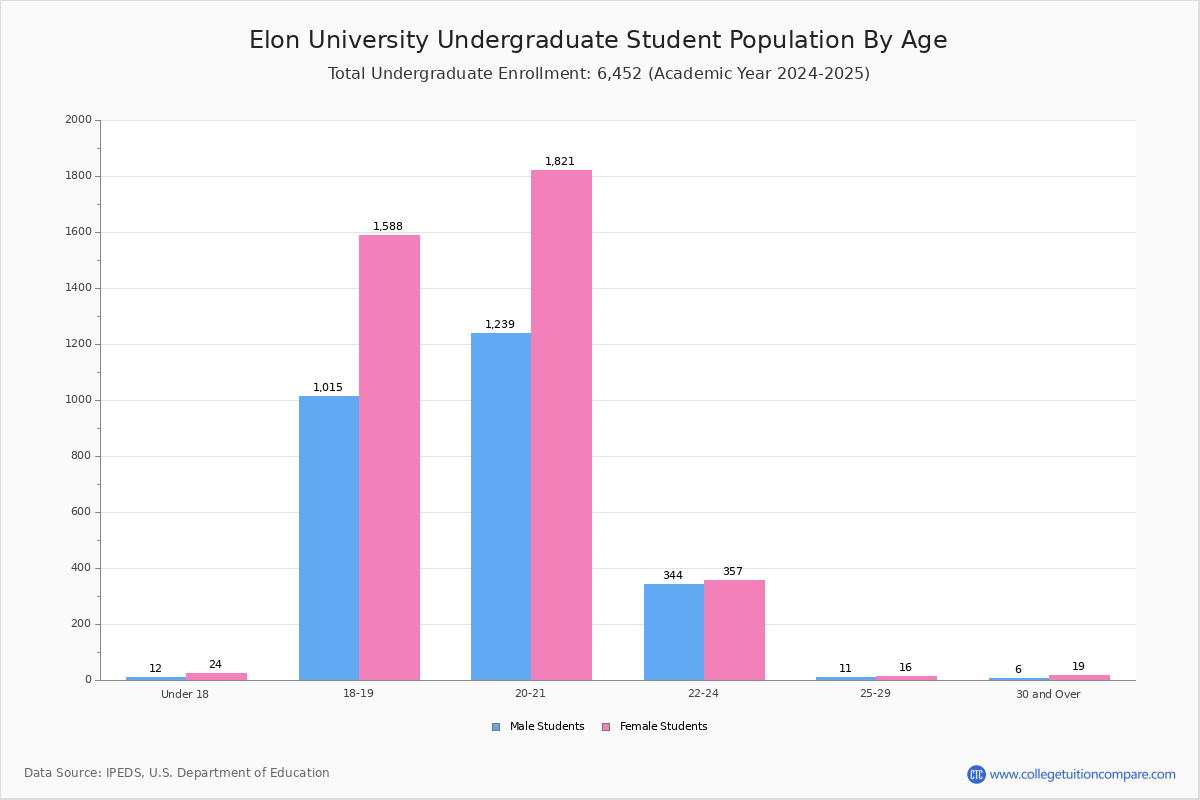
Student Age Distribution
By age, Elon has 36 students under 18 years old and 2 students over 65 years old. There are 6,639 students under 25 years old, and 481 students over 25 years old out of 7,123 total students.
In undergraduate programs, 36 students are younger than 18 and 2 students are older than 65. Elon has 6,292 undergraduate students aged under 25 and 43 students aged 25 and over.
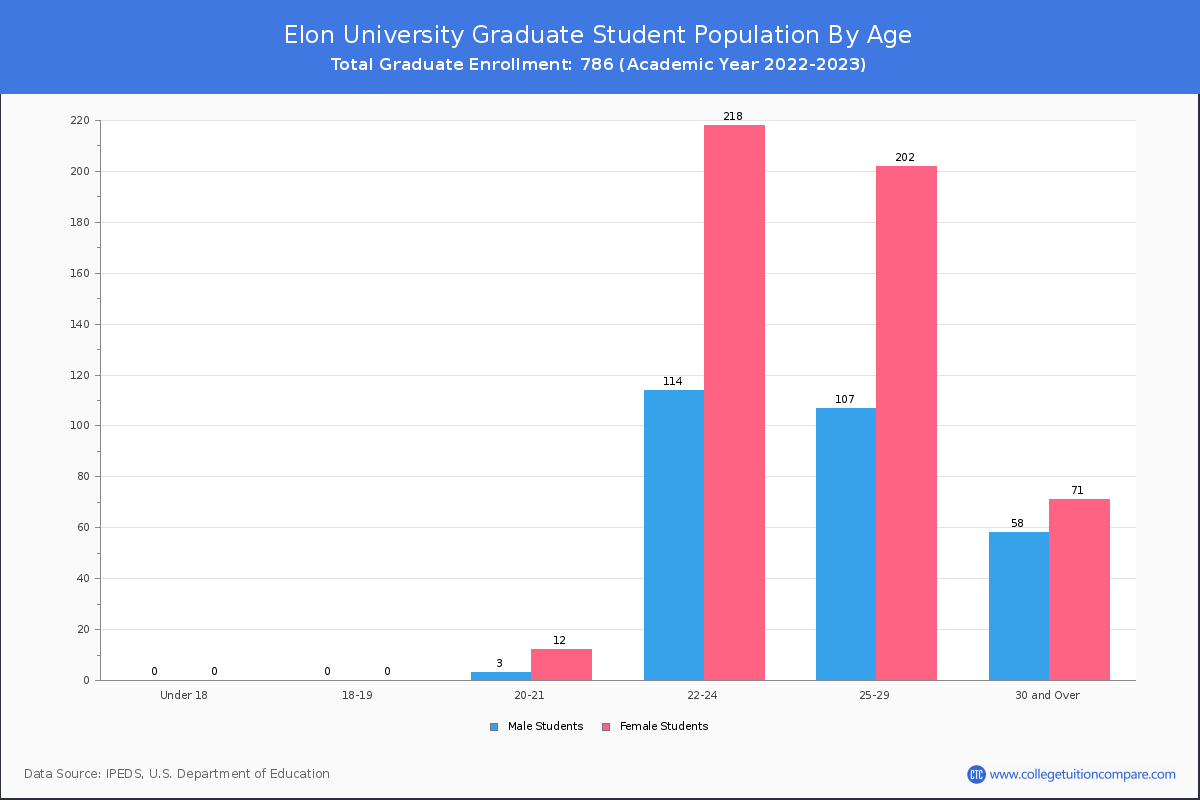
It has 347 graduate students aged under 25 and 438 students aged 25 and over.
| Age | Total | Men | Women |
|---|---|---|---|
| Under 18 | 36 | 23 | 13 |
| 18-19 | 2,643 | 1,601 | 1,042 |
| 20-21 | 2,939 | 1,797 | 1,142 |
| 22-24 | 1,021 | 557 | 464 |
| 25-29 | 330 | 214 | 116 |
| 30-34 | 65 | 32 | 33 |
| 35-39 | 34 | 21 | 13 |
| 40-49 | 38 | 19 | 19 |
| 50-64 | 12 | 7 | 5 |
| Over 65 | 2 | 2 | 0 |
| Age | Total | Men | Women |
|---|---|---|---|
| Under 18 | 36 | 23 | 13 |
| 18-19 | 2,643 | 1,601 | 1,042 |
| 20-21 | 2,924 | 1,785 | 1,139 |
| 22-24 | 689 | 339 | 350 |
| 25-29 | 21 | 12 | 9 |
| 30-34 | 3 | 1 | 2 |
| 35-39 | 6 | 2 | 4 |
| 40-49 | 8 | 4 | 4 |
| 50-64 | 3 | 1 | 2 |
| Over 65 | 2 | 2 | 0 |
| Age | Total | Men | Women |
|---|
Transfer-in Students (Undergraduate)
Among 6,337 enrolled in undergraduate programs, 96 students have transferred-in from other institutions. The percentage of transfer-in students is 1.51%.
| Number of Students | |
|---|---|
| Regular Full-time | 6,048 |
| Transfer-in Full-time | 96 |