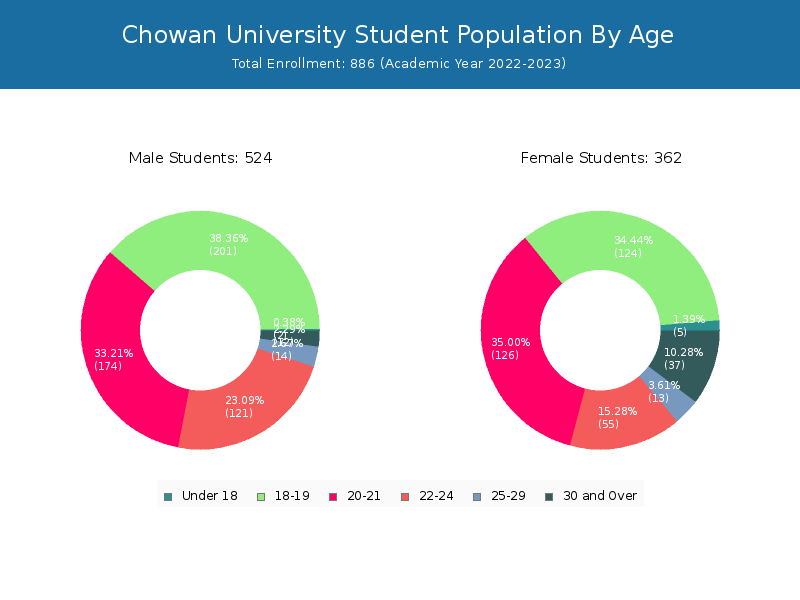
Student Population by Gender
Chowan University has a total of 886 enrolled students for the academic year 2022-2023. 800 students have enrolled in undergraduate programs and 86 students joined graduate programs.
By gender, 524 male and 362 female students (the male-female ratio is 59:41) are attending the school. The gender distribution is based on the 2022-2023 data.
| Total | Undergraduate | Graduate | |
|---|---|---|---|
| Total | 886 | 800 | 86 |
| Men | 524 | 478 | 46 |
| Women | 362 | 322 | 40 |
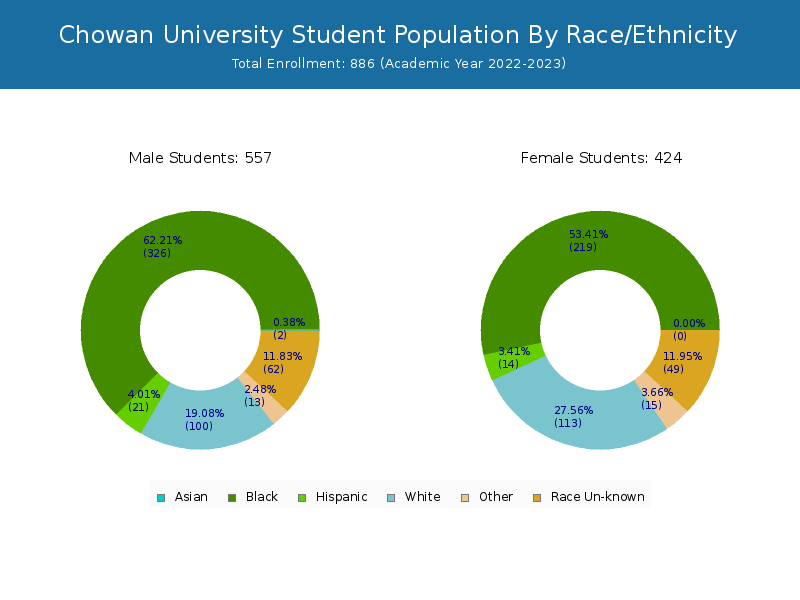
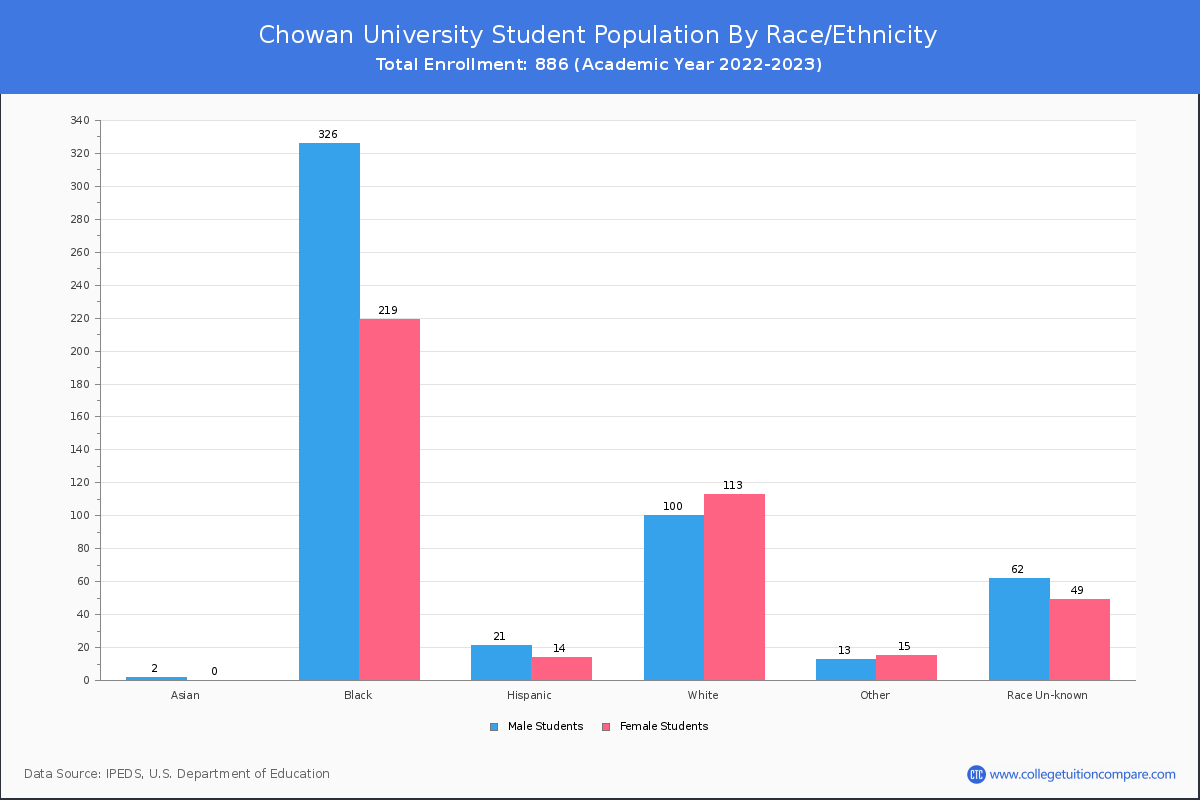
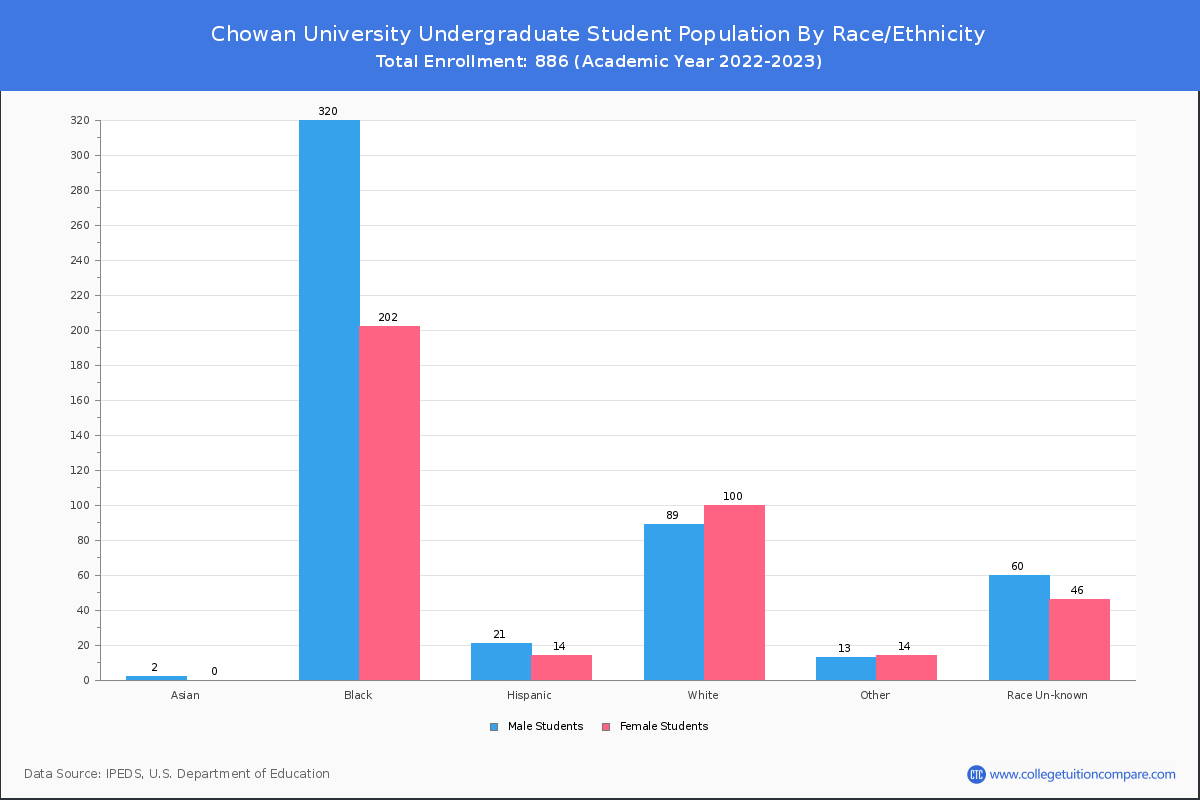
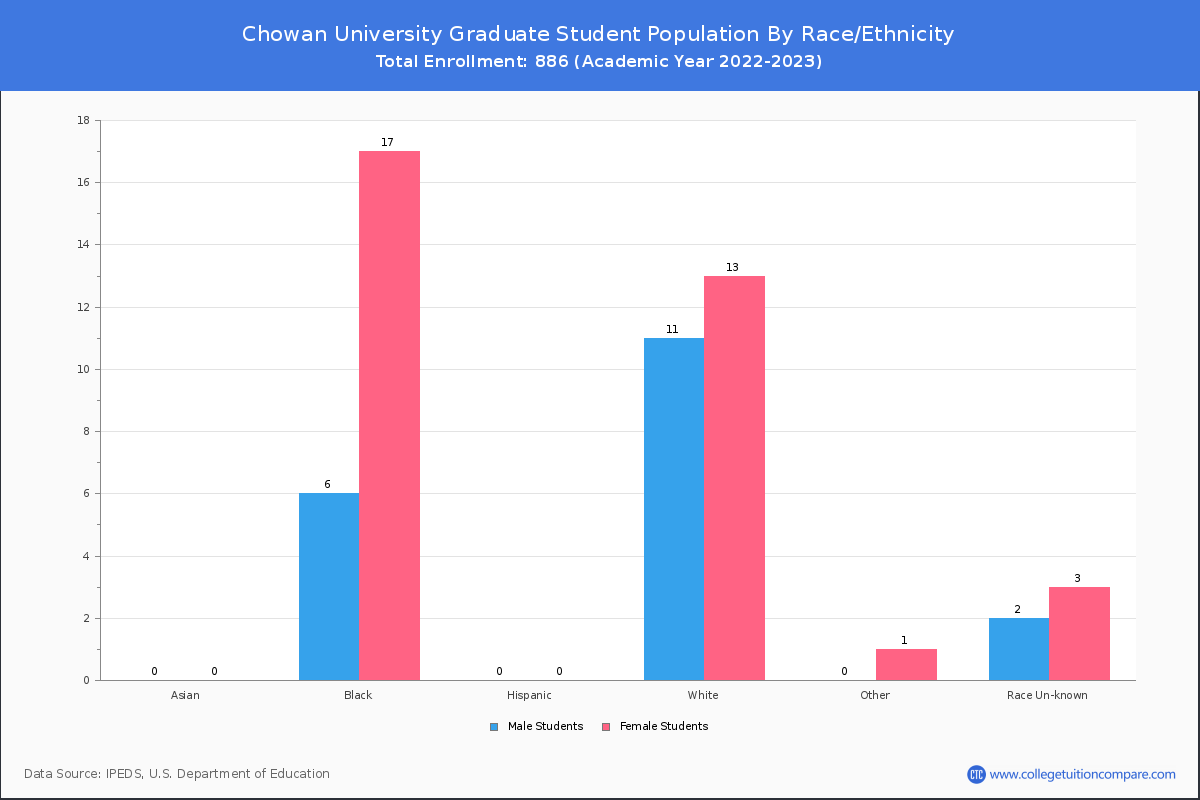
Student Distribution by Race/Ethnicity
By race/ethnicity, 183 White, 456 Black, and 2 Asian students out of a total of 886 are attending at Chowan University. Comprehensive enrollment statistic data by race/ethnicity is shown in the next chart (Academic year 2022-2023 data).
| Race | Total | Men | Women |
|---|---|---|---|
| American Indian or Native American | 11 | 6 | 5 |
| Asian | 2 | 2 | 0 |
| Black | 456 | 280 | 176 |
| Hispanic | 30 | 19 | 11 |
| Native Hawaiian or Other Pacific Islanders | 1 | 1 | 0 |
| White | 183 | 91 | 92 |
| Two or more races | 17 | 10 | 7 |
| Race Unknown | 120 | 69 | 51 |
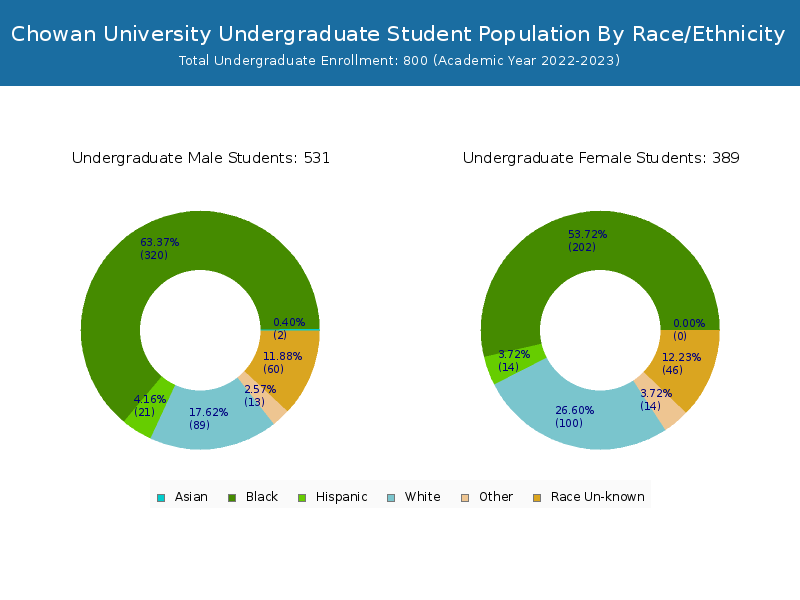
| Race | Total | Men | Women |
|---|---|---|---|
| American Indian or Native American | 9 | 5 | 4 |
| Asian | 2 | 2 | 0 |
| Black | 421 | 262 | 159 |
| Hispanic | 29 | 19 | 10 |
| Native Hawaiian or Other Pacific Islanders | 1 | 1 | 0 |
| White | 157 | 77 | 80 |
| Two or more races | 17 | 10 | 7 |
| Race Unknown | 111 | 66 | 45 |
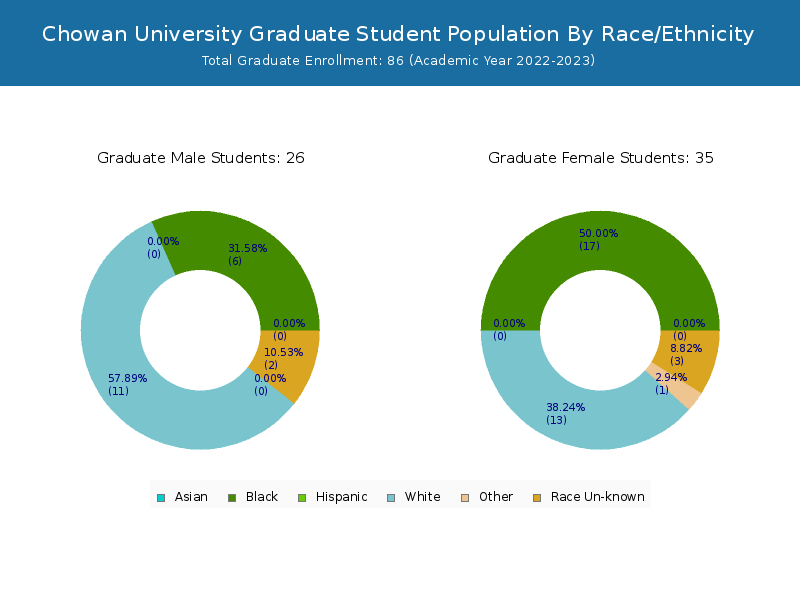
| Race | Total | Men | Women |
|---|---|---|---|
| American Indian or Native American | 0 | 0 | 0 |
| Asian | 0 | 0 | 0 |
| Black | 23 | 15 | 8 |
| Hispanic | 2 | 2 | 0 |
| Native Hawaiian or Other Pacific Islanders | 0 | 0 | 0 |
| White | 7 | 6 | 1 |
| Two or more races | 1 | 0 | 1 |
| Race Unknown | 7 | 4 | 3 |
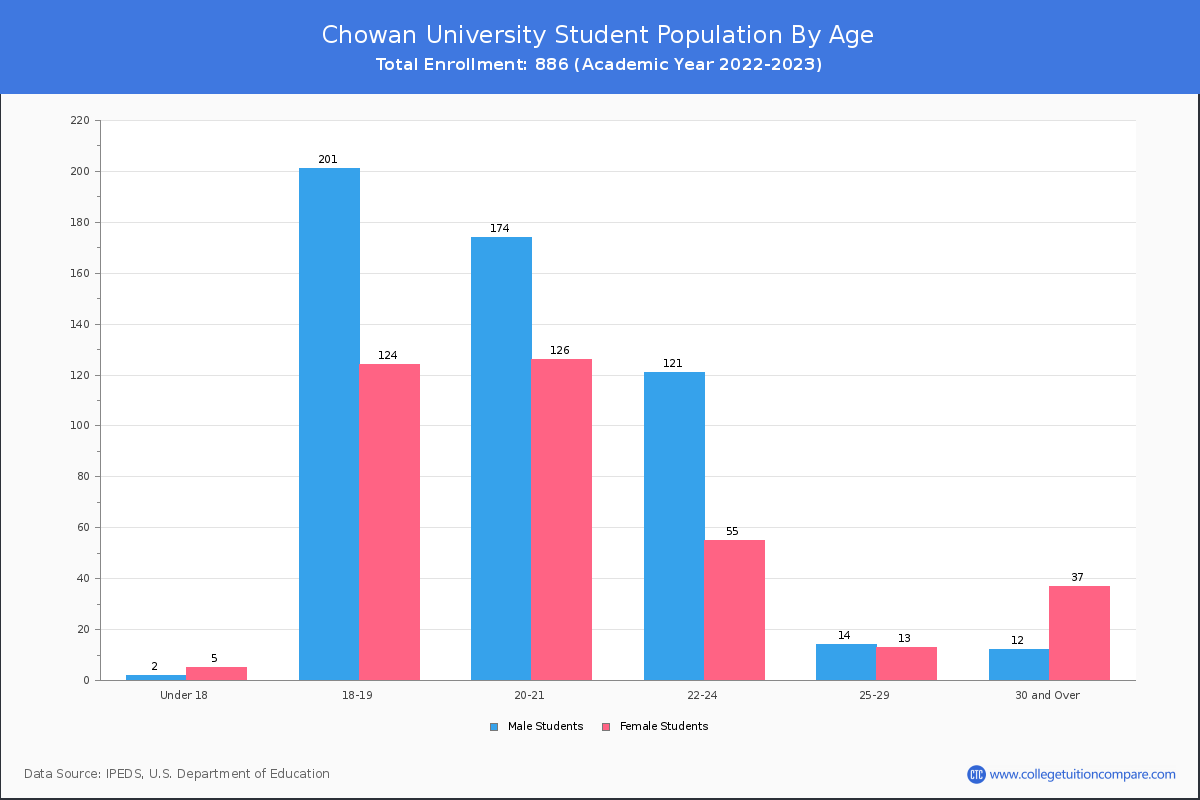
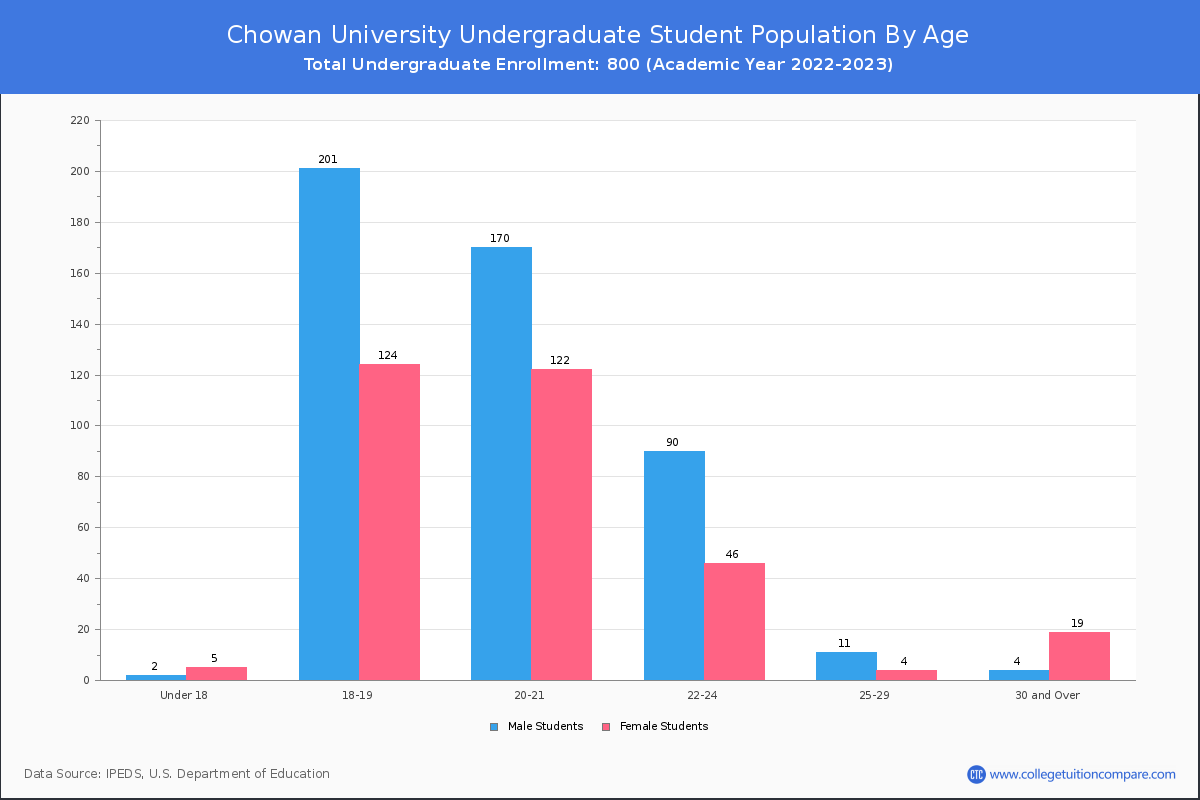
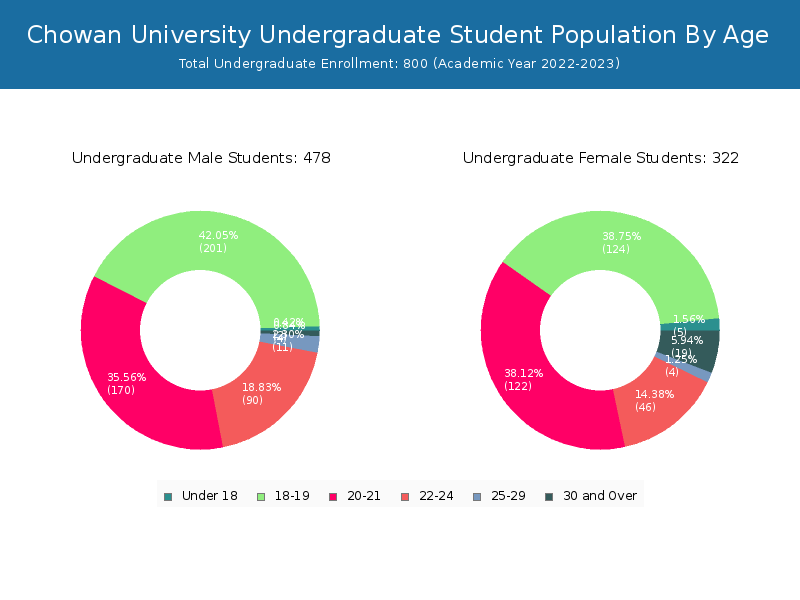
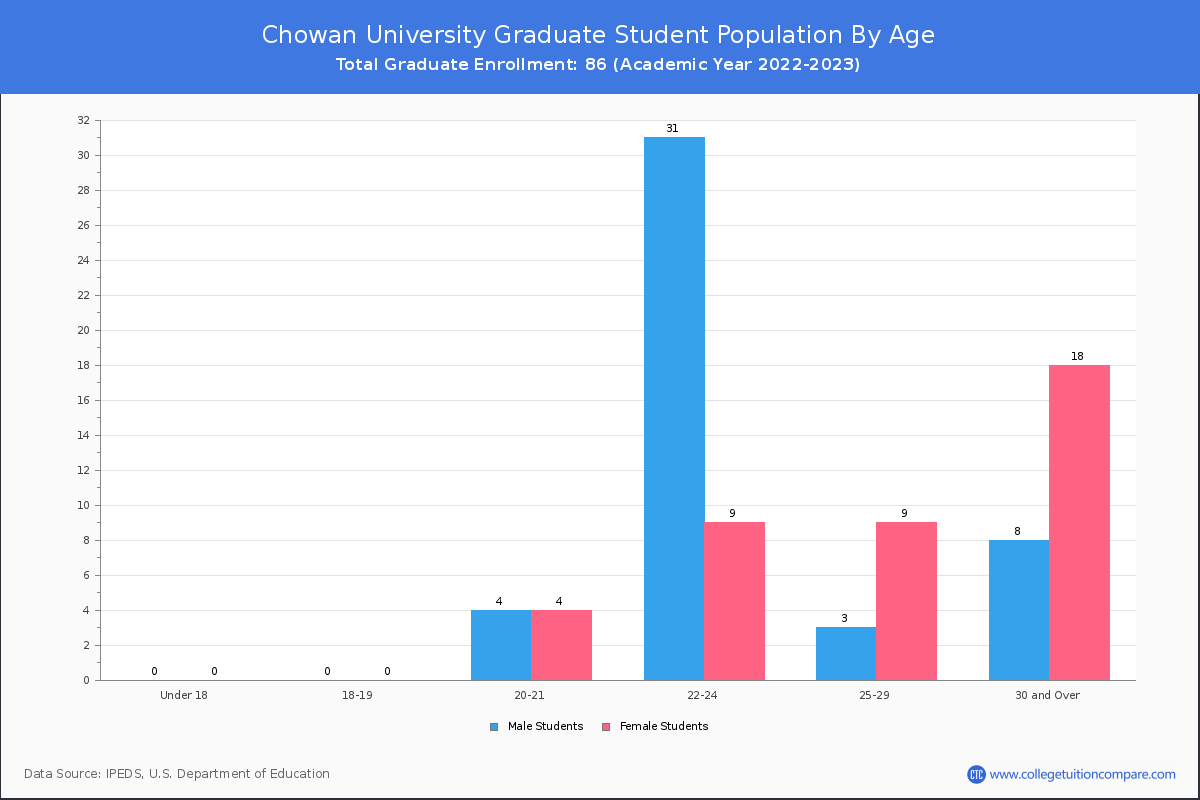
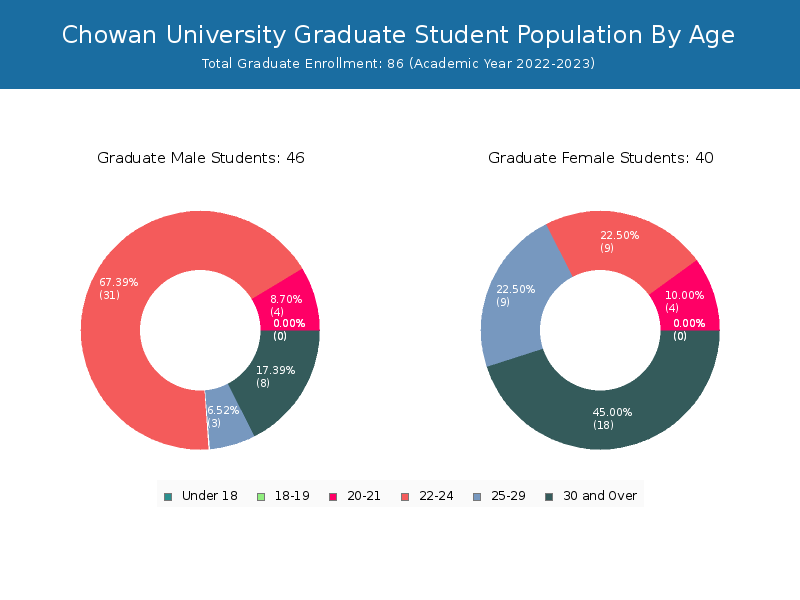
Student Age Distribution
There are 808 students under 25 years old, and 76 students over 25 years old out of 886 total students.
Chowan has 760 undergraduate students aged under 25 and 38 students aged 25 and over.
It has 48 graduate students aged under 25 and 38 students aged 25 and over.
| Age | Total | Men | Women |
|---|---|---|---|
| Under 18 | 7 | 5 | 2 |
| 18-19 | 325 | 124 | 201 |
| 20-21 | 300 | 126 | 174 |
| 22-24 | 176 | 55 | 121 |
| 25-29 | 27 | 13 | 14 |
| 30-34 | 13 | 10 | 3 |
| 35-39 | 12 | 10 | 2 |
| 40-49 | 19 | 14 | 5 |
| 50-64 | 5 | 3 | 2 |
| Age | Total | Men | Women |
|---|---|---|---|
| Under 18 | 7 | 5 | 2 |
| 18-19 | 325 | 124 | 201 |
| 20-21 | 292 | 122 | 170 |
| 22-24 | 136 | 46 | 90 |
| 25-29 | 15 | 4 | 11 |
| 30-34 | 5 | 3 | 2 |
| 35-39 | 6 | 5 | 1 |
| 40-49 | 9 | 8 | 1 |
| 50-64 | 3 | 3 | 0 |
| Age | Total | Men | Women |
|---|
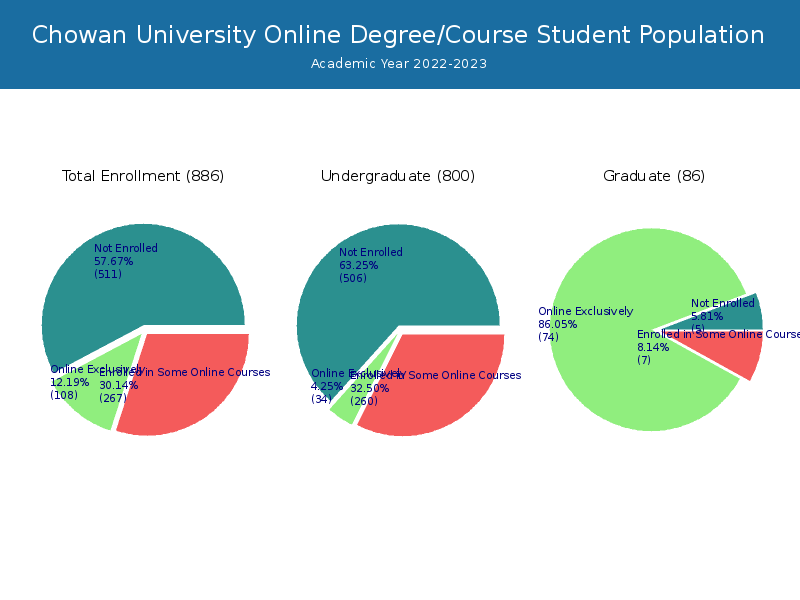
Online Student Enrollment
Distance learning, also called online education, is very attractive to students, especially who want to continue education and work in field. At Chowan University, 108 students are enrolled exclusively in online courses and 267 students are enrolled in some online courses.
74 students lived in North Carolina or jurisdiction in which the school is located are enrolled exclusively in online courses and 34 students live in other State or outside of the United States.
| All Students | Enrolled Exclusively Online Courses | Enrolled in Some Online Courses | |
|---|---|---|---|
| All Students | 886 | 108 | 267 |
| Undergraduate | 800 | 34 | 260 |
| Graduate | 86 | 74 | 7 |
| North Carolina Residents | Other States in U.S. | Outside of U.S. | |
|---|---|---|---|
| All Students | 74 | 34 | 0 |
| Undergraduate | 31 | 3 | 0 |
| Graduate | 43 | 31 | 0 |
Transfer-in Students (Undergraduate)
Among 800 enrolled in undergraduate programs, 41 students have transferred-in from other institutions. The percentage of transfer-in students is 5.13%.35 students have transferred in as full-time status and 6 students transferred in as part-time status.
| Number of Students | |
|---|---|
| Regular Full-time | 727 |
| Transfer-in Full-time | 35 |
| Regular Part-time | 32 |
| Transfer-in Part-time | 6 |