Student Population by Gender
SUNY Maritime College has a total of 1,427 enrolled students for the academic year 2022-2023. 1,295 students have enrolled in undergraduate programs and 132 students joined graduate programs.
By gender, 1,229 male and 198 female students (the male-female ratio is 86:14) are attending the school. The gender distribution is based on the 2022-2023 data.
| Total | Undergraduate | Graduate | |
|---|---|---|---|
| Total | 1,427 | 1,295 | 132 |
| Men | 1,229 | 1,122 | 107 |
| Women | 198 | 173 | 25 |
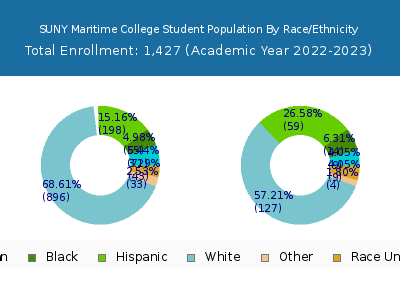
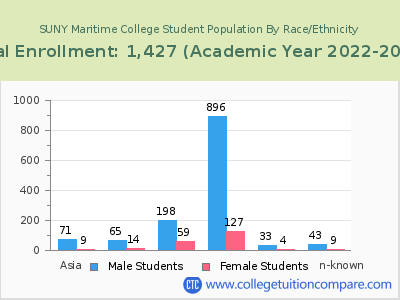
Student Distribution by Race/Ethnicity
| Race | Total | Men | Women |
|---|---|---|---|
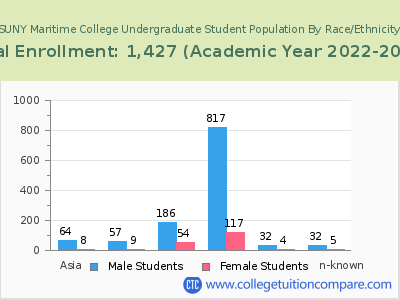
| American Indian or Native American | 1 | 1 | 0 |
| Asian | 64 | 55 | 9 |
| Black | 87 | 69 | 18 |
| Hispanic | 214 | 172 | 42 |
| Native Hawaiian or Other Pacific Islanders | 0 | 0 | 0 |
| White | 950 | 836 | 114 |
| Two or more races | 31 | 28 | 3 |
| Race Unknown | 54 | 45 | 9 |
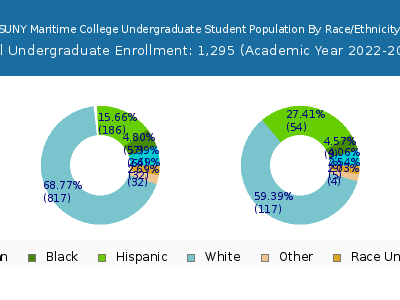
| Race | Total | Men | Women |
|---|---|---|---|
| American Indian or Native American | 1 | 1 | 0 |
| Asian | 58 | 50 | 8 |
| Black | 71 | 58 | 13 |
| Hispanic | 197 | 160 | 37 |
| Native Hawaiian or Other Pacific Islanders | 0 | 0 | 0 |
| White | 873 | 771 | 102 |
| Two or more races | 31 | 28 | 3 |
| Race Unknown | 43 | 36 | 7 |
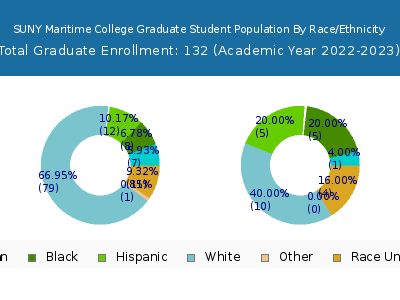
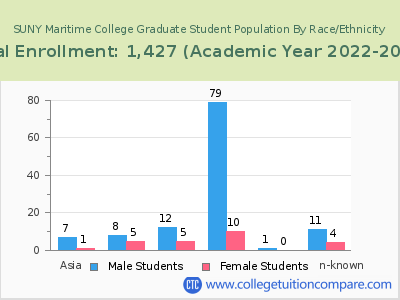
| Race | Total | Men | Women |
|---|---|---|---|
| American Indian or Native American | 0 | 0 | 0 |
| Asian | 2 | 1 | 1 |
| Black | 8 | 6 | 2 |
| Hispanic | 6 | 6 | 0 |
| Native Hawaiian or Other Pacific Islanders | 0 | 0 | 0 |
| White | 22 | 21 | 1 |
| Two or more races | 2 | 1 | 1 |
| Race Unknown | 2 | 1 | 1 |
Student Age Distribution
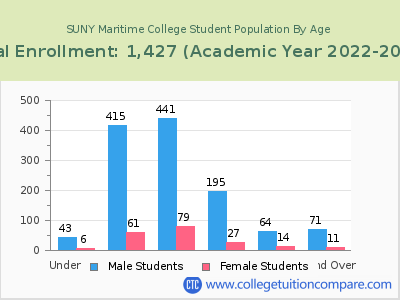
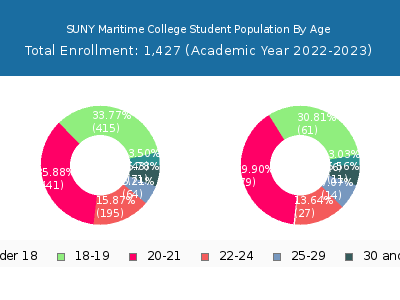
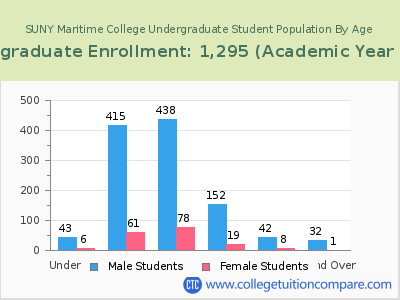
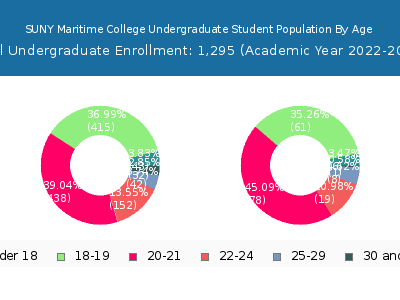
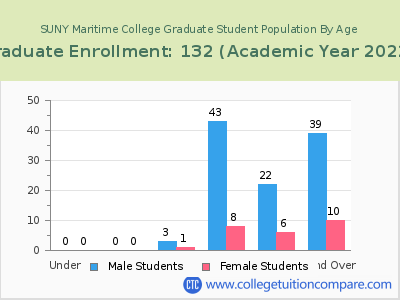
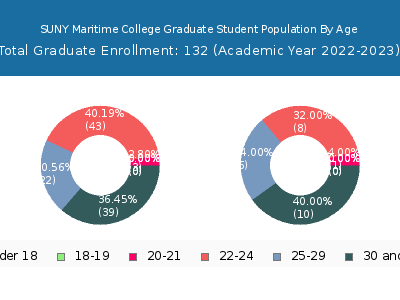
By age, SUNY Maritime has 49 students under 18 years old and 3 students over 65 years old. There are 1,267 students under 25 years old, and 160 students over 25 years old out of 1,427 total students.
SUNY Maritime has 1,212 undergraduate students aged under 25 and 83 students aged 25 and over.
It has 55 graduate students aged under 25 and 77 students aged 25 and over.
| Age | Total | Men | Women |
|---|---|---|---|
| Under 18 | 49 | 6 | 43 |
| 18-19 | 476 | 61 | 415 |
| 20-21 | 520 | 79 | 441 |
| 22-24 | 222 | 27 | 195 |
| 25-29 | 78 | 14 | 64 |
| 30-34 | 35 | 5 | 30 |
| 35-39 | 22 | 3 | 19 |
| 40-49 | 16 | 2 | 14 |
| 50-64 | 6 | 1 | 5 |
| Over 65 | 3 | 0 | 3 |
| Age | Total | Men | Women |
|---|---|---|---|
| Under 18 | 49 | 6 | 43 |
| 18-19 | 476 | 61 | 415 |
| 20-21 | 516 | 78 | 438 |
| 22-24 | 171 | 19 | 152 |
| 25-29 | 50 | 8 | 42 |
| 30-34 | 18 | 1 | 17 |
| 35-39 | 9 | 0 | 9 |
| 40-49 | 5 | 0 | 5 |
| 50-64 | 1 | 0 | 1 |
| Age | Total | Men | Women |
|---|
Online Student Enrollment
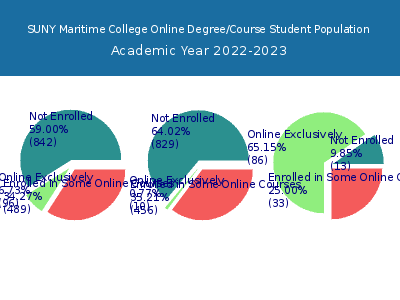
Distance learning, also called online education, is very attractive to students, especially who want to continue education and work in field. At SUNY Maritime College, 96 students are enrolled exclusively in online courses and 489 students are enrolled in some online courses.
58 students lived in New York or jurisdiction in which the school is located are enrolled exclusively in online courses and 38 students live in other State or outside of the United States.
| All Students | Enrolled Exclusively Online Courses | Enrolled in Some Online Courses | |
|---|---|---|---|
| All Students | 1,427 | 96 | 489 |
| Undergraduate | 1,295 | 10 | 456 |
| Graduate | 132 | 86 | 33 |
| New York Residents | Other States in U.S. | Outside of U.S. | |
|---|---|---|---|
| All Students | 58 | 37 | 1 |
| Undergraduate | 9 | 1 | 0 |
| Graduate | 49 | 36 | 1 |
Transfer-in Students (Undergraduate)
Among 1,295 enrolled in undergraduate programs, 45 students have transferred-in from other institutions. The percentage of transfer-in students is 3.47%.
| Number of Students | |
|---|---|
| Regular Full-time | 1,155 |
| Transfer-in Full-time | 45 |
