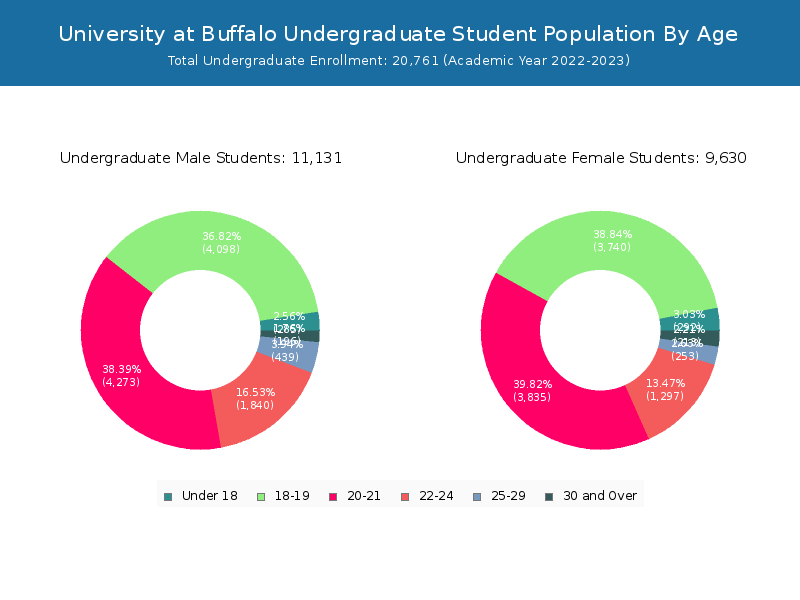
Student Population by Gender
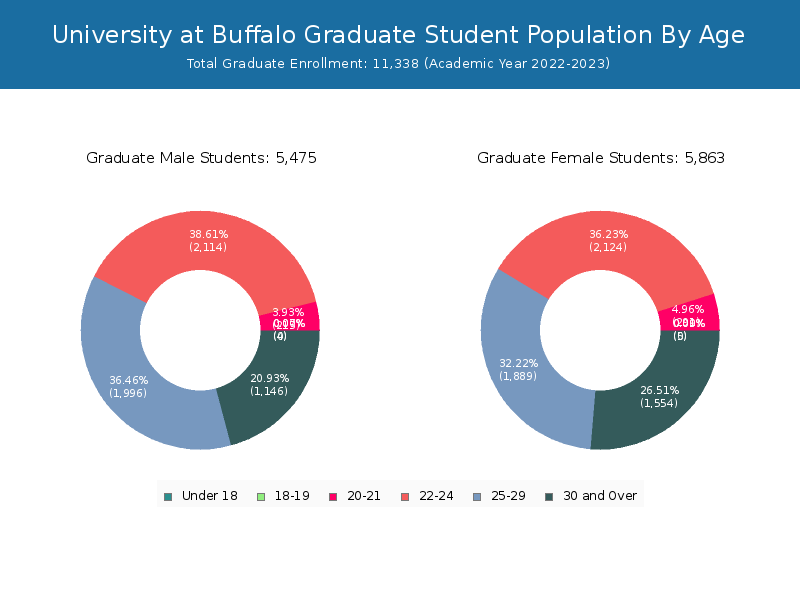
University at Buffalo has a total of 32,099 enrolled students for the academic year 2022-2023. 20,761 students have enrolled in undergraduate programs and 11,338 students joined graduate programs.
By gender, 16,606 male and 15,493 female students (the male-female ratio is 52:48) are attending the school. The gender distribution is based on the 2022-2023 data.
| Total | Undergraduate | Graduate | |
|---|---|---|---|
| Total | 32,099 | 20,761 | 11,338 |
| Men | 16,606 | 11,131 | 5,475 |
| Women | 15,493 | 9,630 | 5,863 |
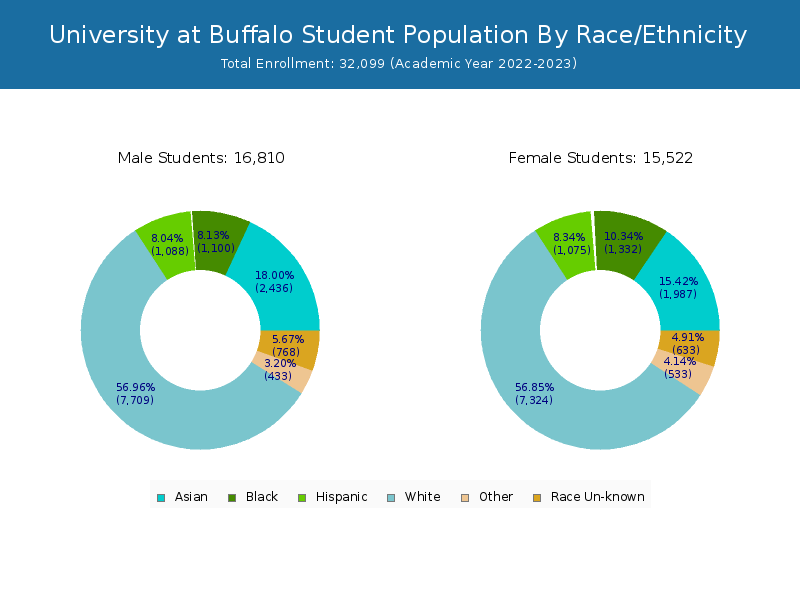
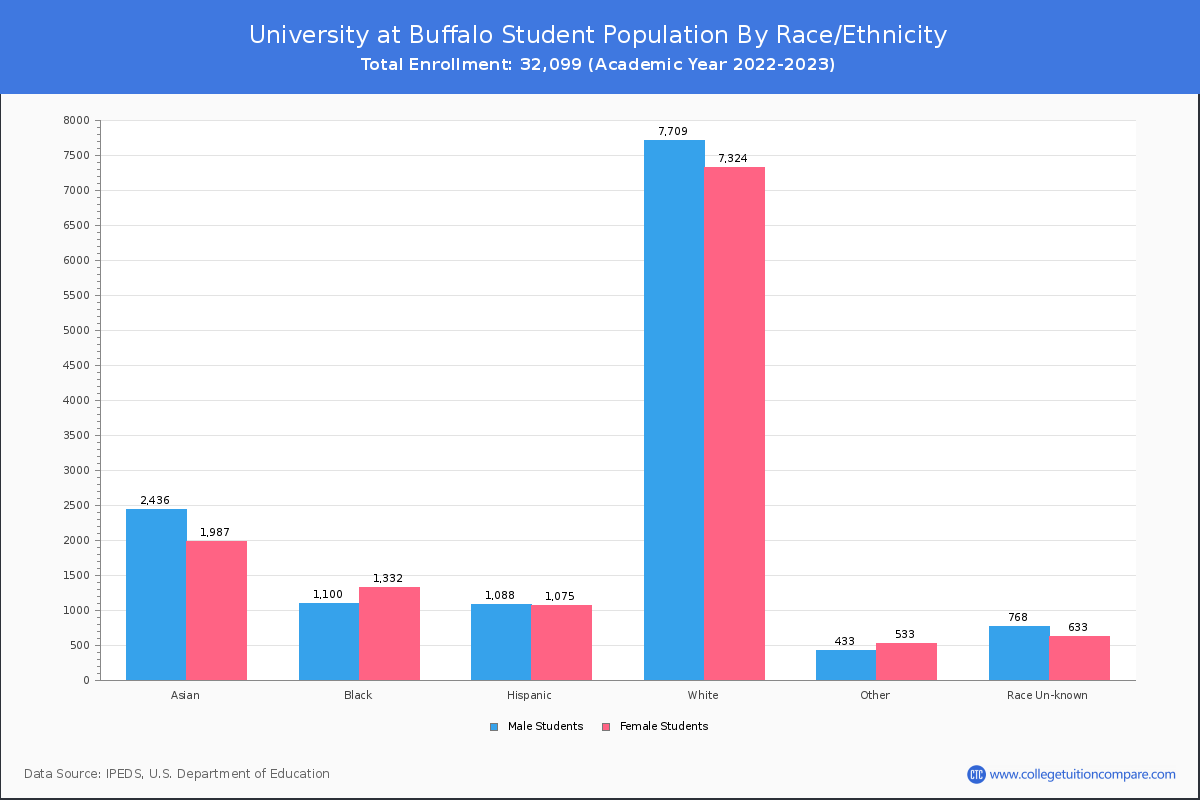
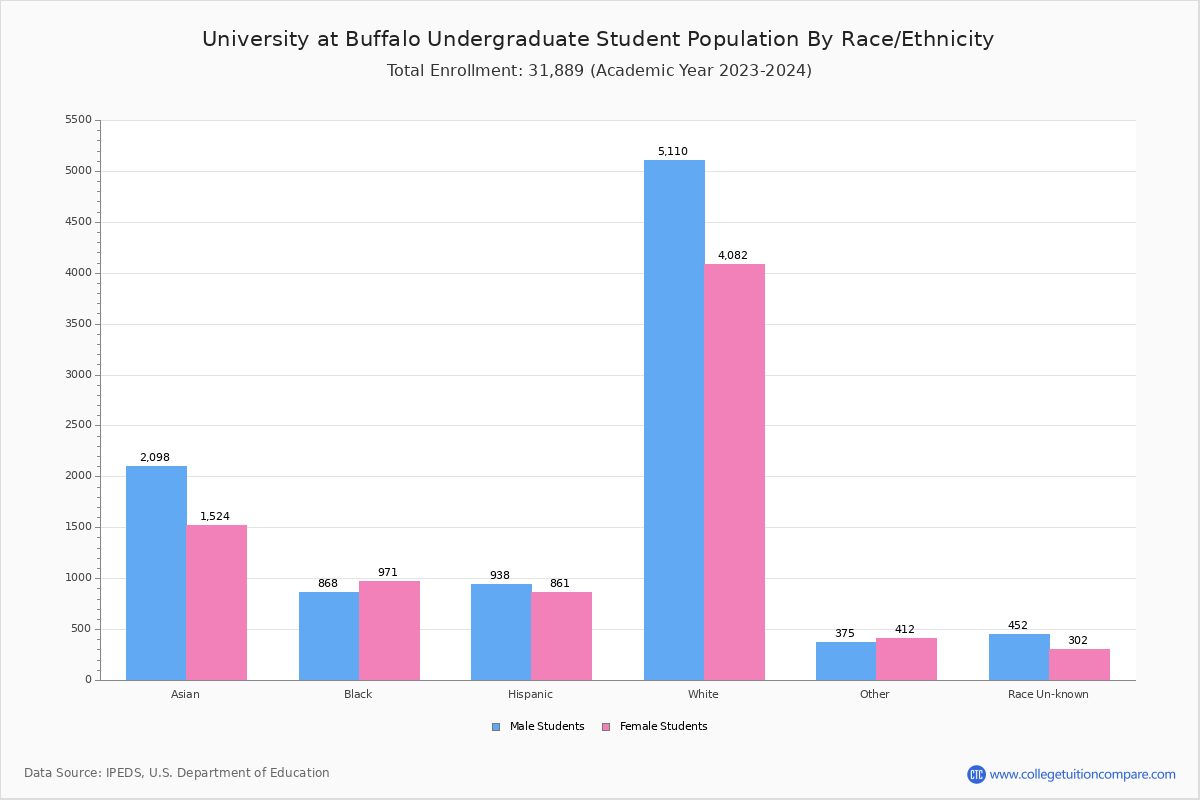
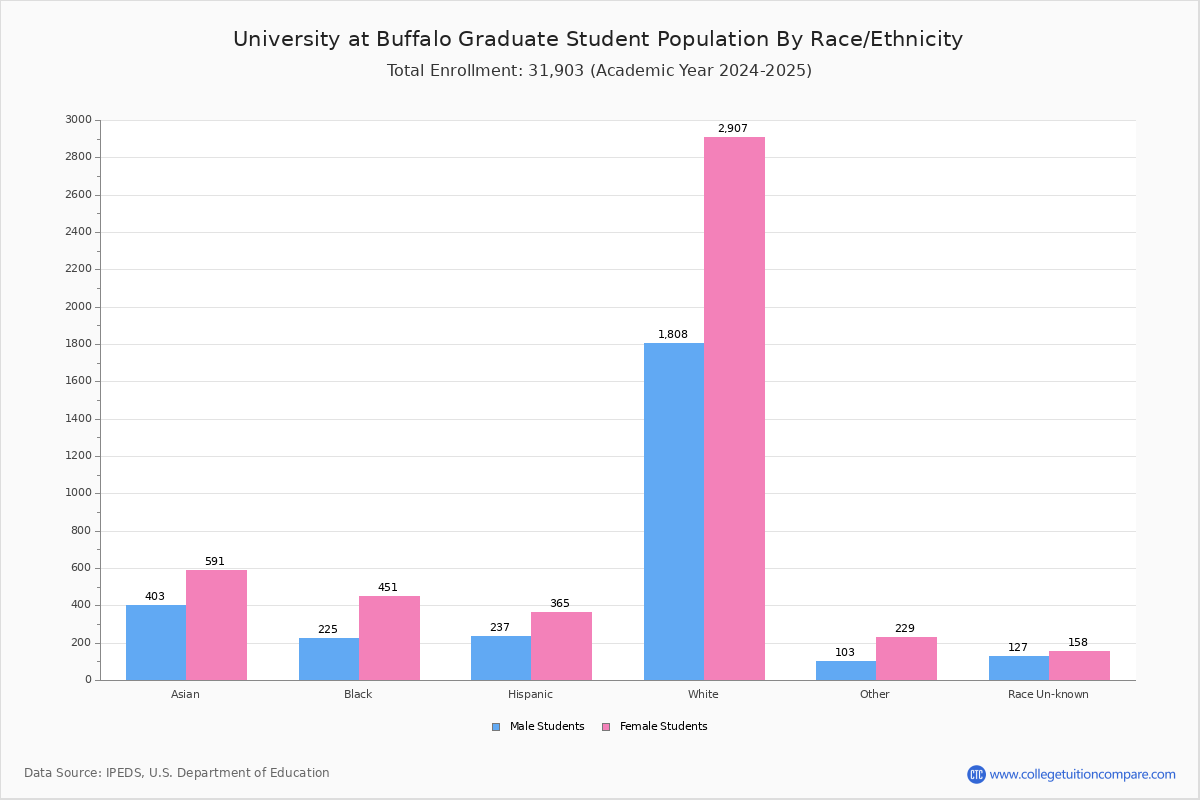
Student Distribution by Race/Ethnicity
By race/ethnicity, 14,273 White, 2,393 Black, and 4,547 Asian students out of a total of 32,099 are attending at University at Buffalo. Comprehensive enrollment statistic data by race/ethnicity is shown in the next chart (Academic year 2022-2023 data).
| Race | Total | Men | Women |
|---|---|---|---|
| American Indian or Native American | 68 | 32 | 36 |
| Asian | 4,547 | 2,442 | 2,105 |
| Black | 2,393 | 1,052 | 1,341 |
| Hispanic | 2,343 | 1,149 | 1,194 |
| Native Hawaiian or Other Pacific Islanders | 15 | 5 | 10 |
| White | 14,273 | 7,286 | 6,987 |
| Two or more races | 843 | 361 | 482 |
| Race Unknown | 1,122 | 615 | 507 |
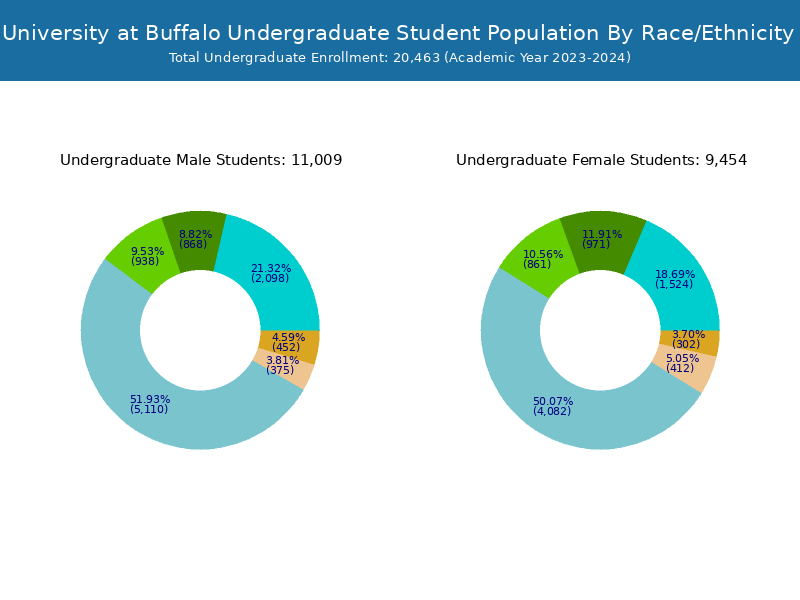
| Race | Total | Men | Women |
|---|---|---|---|
| American Indian or Native American | 41 | 21 | 20 |
| Asian | 3,605 | 2,042 | 1,563 |
| Black | 1,807 | 849 | 958 |
| Hispanic | 1,789 | 915 | 874 |
| Native Hawaiian or Other Pacific Islanders | 13 | 3 | 10 |
| White | 9,426 | 5,312 | 4,114 |
| Two or more races | 610 | 277 | 333 |
| Race Unknown | 846 | 497 | 349 |
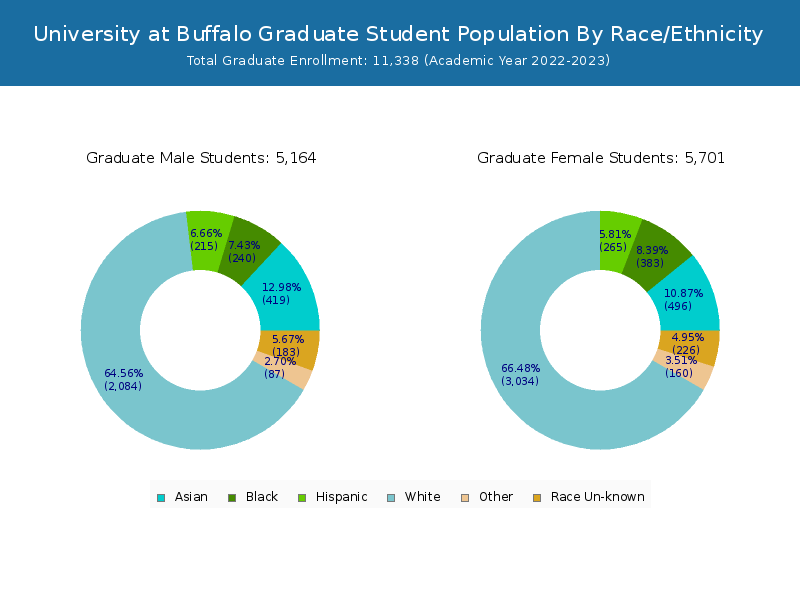
| Race | Total | Men | Women |
|---|---|---|---|
| American Indian or Native American | 4 | 1 | 3 |
| Asian | 160 | 96 | 64 |
| Black | 127 | 63 | 64 |
| Hispanic | 103 | 57 | 46 |
| Native Hawaiian or Other Pacific Islanders | 1 | 0 | 1 |
| White | 626 | 326 | 300 |
| Two or more races | 48 | 26 | 22 |
| Race Unknown | 35 | 18 | 17 |
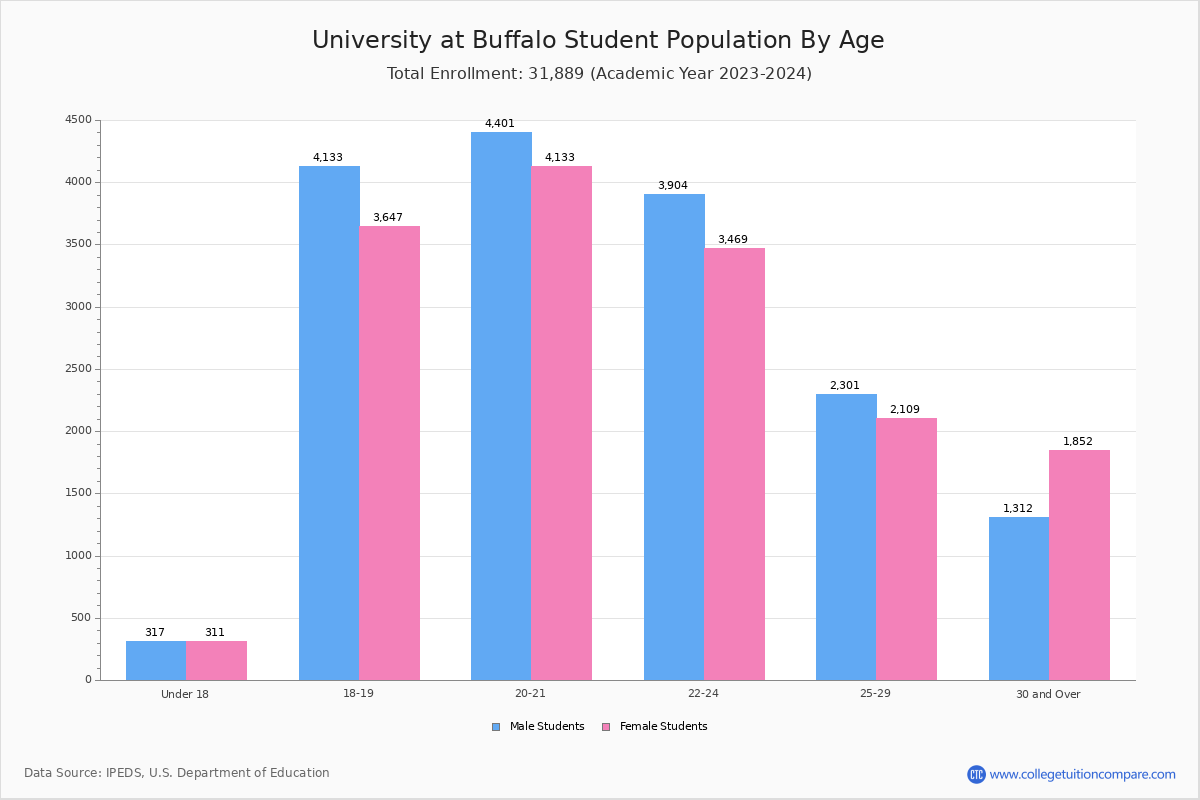
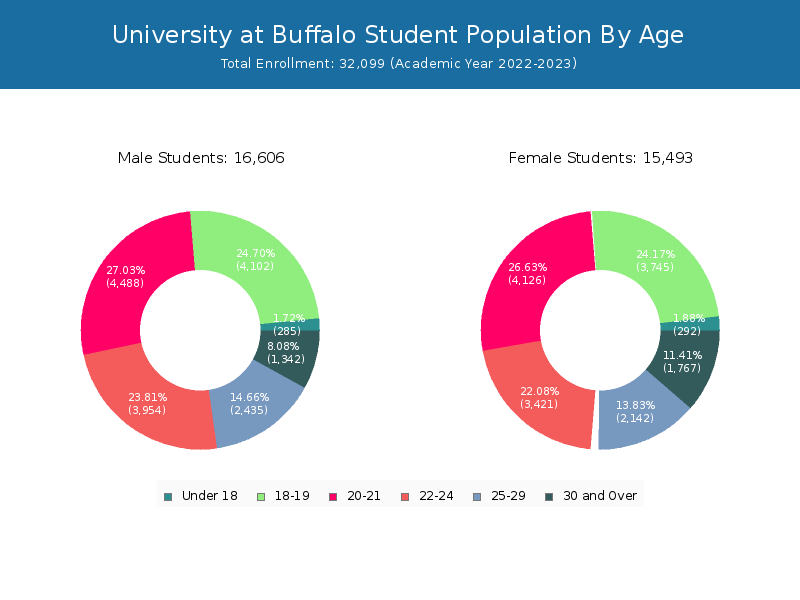
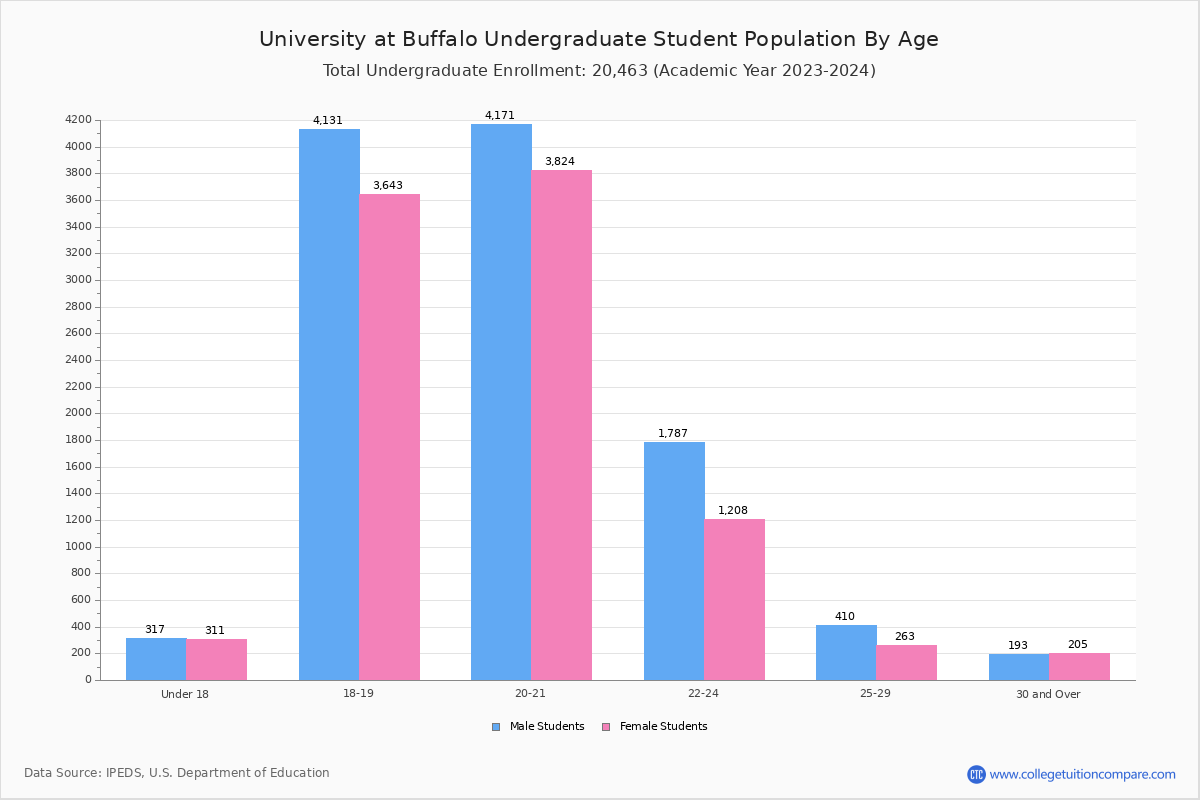
Student Age Distribution
By age, UB has 577 students under 18 years old and 17 students over 65 years old. There are 24,413 students under 25 years old, and 7,686 students over 25 years old out of 32,099 total students.
In undergraduate programs, 577 students are younger than 18 and 3 students are older than 65. UB has 19,660 undergraduate students aged under 25 and 1,101 students aged 25 and over.
It has 4,753 graduate students aged under 25 and 6,585 students aged 25 and over.
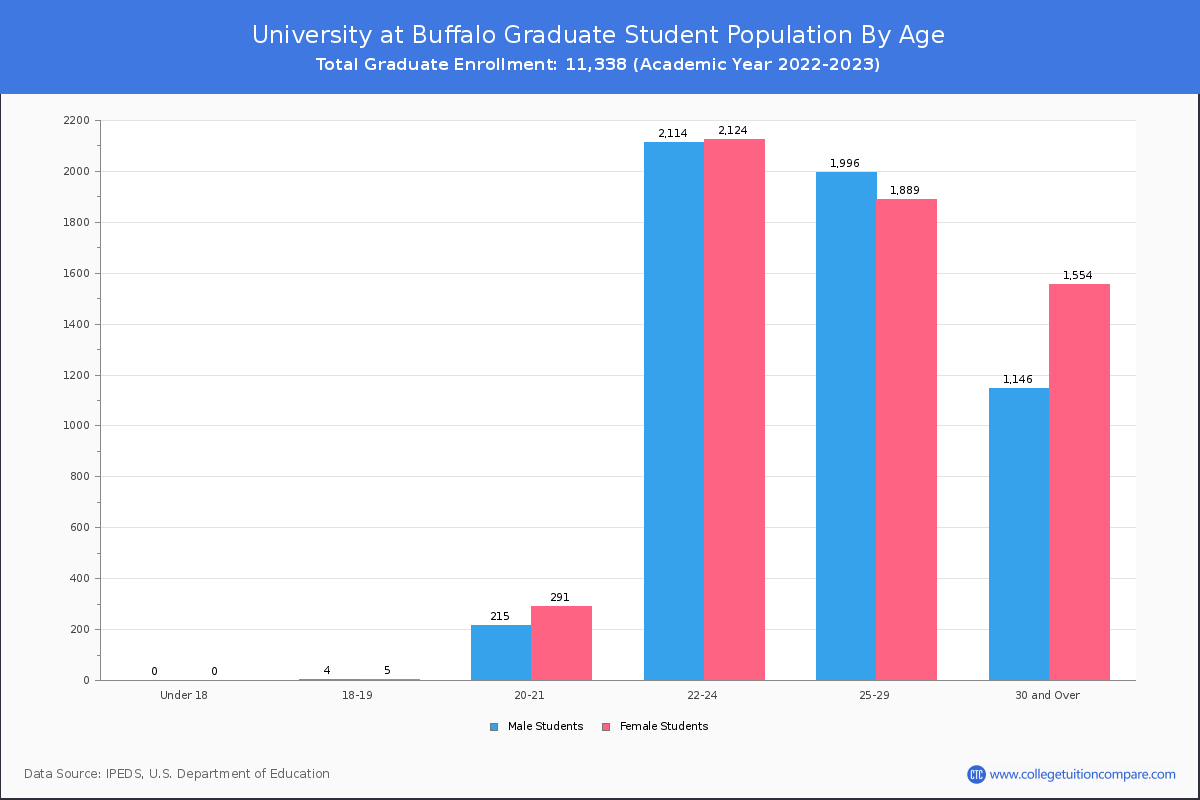
| Age | Total | Men | Women |
|---|---|---|---|
| Under 18 | 577 | 292 | 285 |
| 18-19 | 7,847 | 3,745 | 4,102 |
| 20-21 | 8,614 | 4,126 | 4,488 |
| 22-24 | 7,375 | 3,421 | 3,954 |
| 25-29 | 4,577 | 2,142 | 2,435 |
| 30-34 | 1,501 | 744 | 757 |
| 35-39 | 652 | 387 | 265 |
| 40-49 | 620 | 399 | 221 |
| 50-64 | 319 | 228 | 91 |
| Over 65 | 17 | 9 | 8 |
| Age | Total | Men | Women |
|---|---|---|---|
| Under 18 | 577 | 292 | 285 |
| 18-19 | 7,838 | 3,740 | 4,098 |
| 20-21 | 8,108 | 3,835 | 4,273 |
| 22-24 | 3,137 | 1,297 | 1,840 |
| 25-29 | 692 | 253 | 439 |
| 30-34 | 193 | 89 | 104 |
| 35-39 | 91 | 52 | 39 |
| 40-49 | 86 | 46 | 40 |
| 50-64 | 36 | 25 | 11 |
| Over 65 | 3 | 1 | 2 |
| Age | Total | Men | Women |
|---|
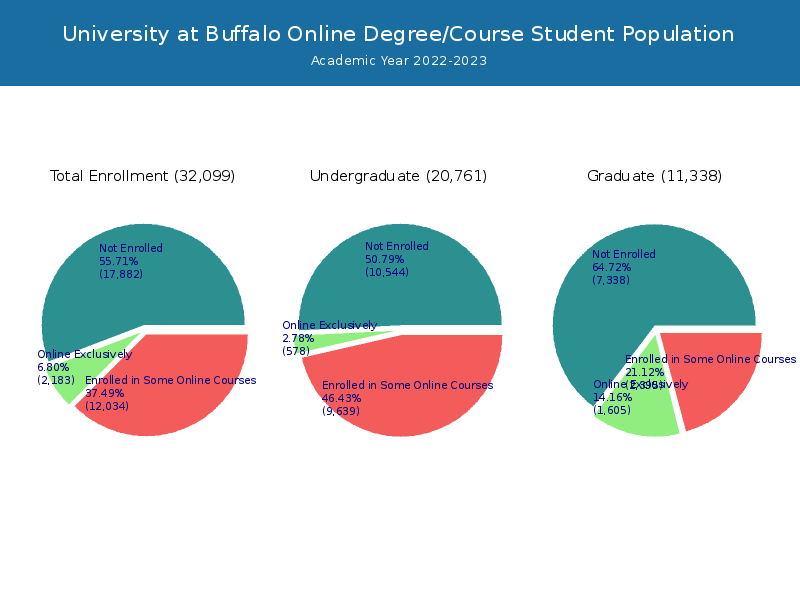
Online Student Enrollment
Distance learning, also called online education, is very attractive to students, especially who want to continue education and work in field. At University at Buffalo, 2,183 students are enrolled exclusively in online courses and 12,034 students are enrolled in some online courses.
1,851 students lived in New York or jurisdiction in which the school is located are enrolled exclusively in online courses and 332 students live in other State or outside of the United States.
| All Students | Enrolled Exclusively Online Courses | Enrolled in Some Online Courses | |
|---|---|---|---|
| All Students | 32,099 | 2,183 | 12,034 |
| Undergraduate | 20,761 | 578 | 9,639 |
| Graduate | 11,338 | 1,605 | 2,395 |
| New York Residents | Other States in U.S. | Outside of U.S. | |
|---|---|---|---|
| All Students | 1,851 | 226 | 106 |
| Undergraduate | 525 | 25 | 28 |
| Graduate | 1,326 | 201 | 78 |
Transfer-in Students (Undergraduate)
Among 20,761 enrolled in undergraduate programs, 1,315 students have transferred-in from other institutions. The percentage of transfer-in students is 6.33%.1,222 students have transferred in as full-time status and 93 students transferred in as part-time status.
| Number of Students | |
|---|---|
| Regular Full-time | 17,859 |
| Transfer-in Full-time | 1,222 |
| Regular Part-time | 1,587 |
| Transfer-in Part-time | 93 |