Student Population by Gender
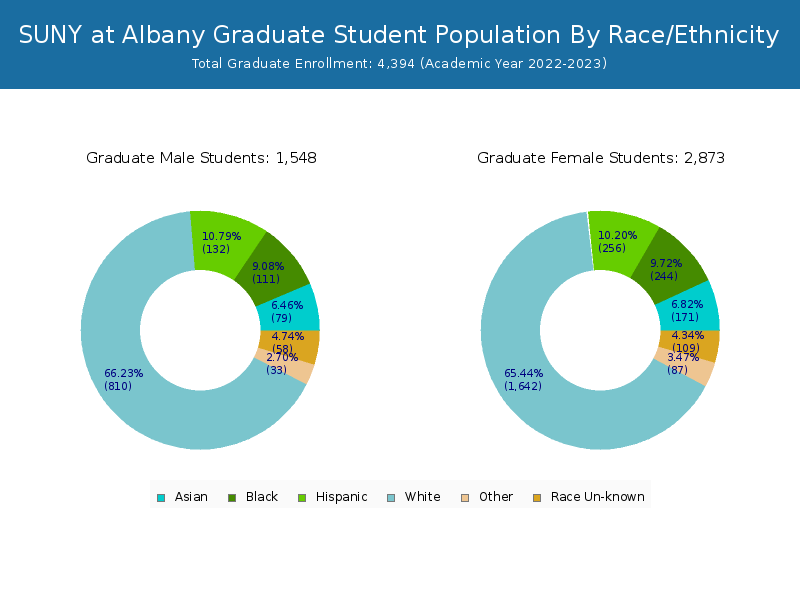
SUNY at Albany has a total of 16,658 enrolled students for the academic year 2022-2023. 12,264 students have enrolled in undergraduate programs and 4,394 students joined graduate programs.
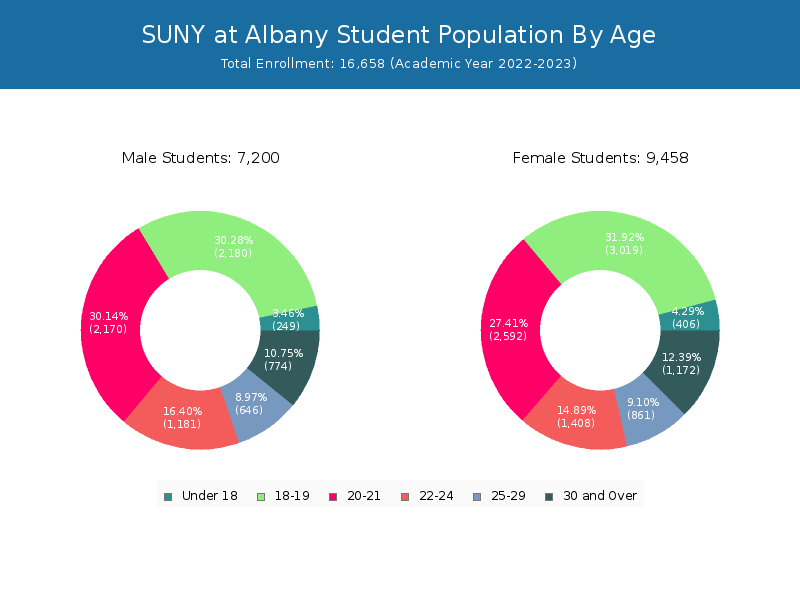
By gender, 7,200 male and 9,458 female students (the male-female ratio is 43:57) are attending the school. The gender distribution is based on the 2022-2023 data.
| Total | Undergraduate | Graduate | |
|---|---|---|---|
| Total | 16,658 | 12,264 | 4,394 |
| Men | 7,200 | 5,604 | 1,596 |
| Women | 9,458 | 6,660 | 2,798 |
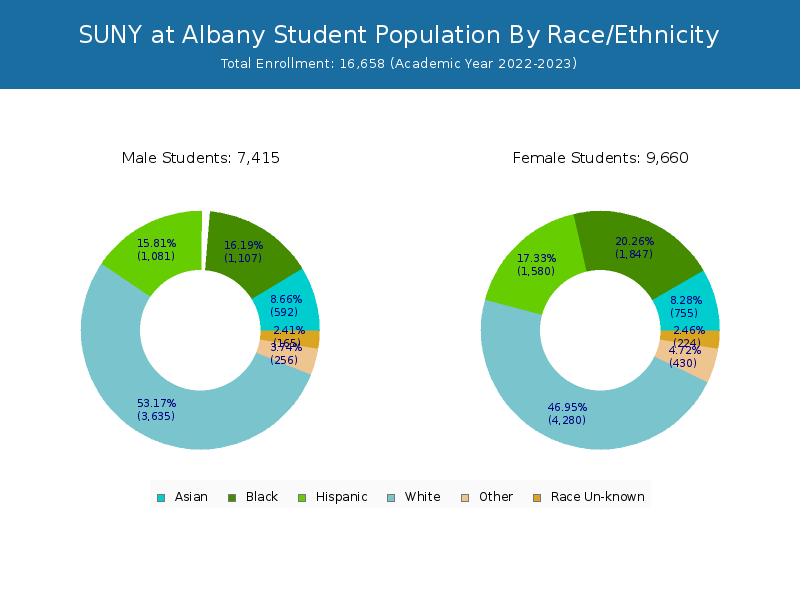
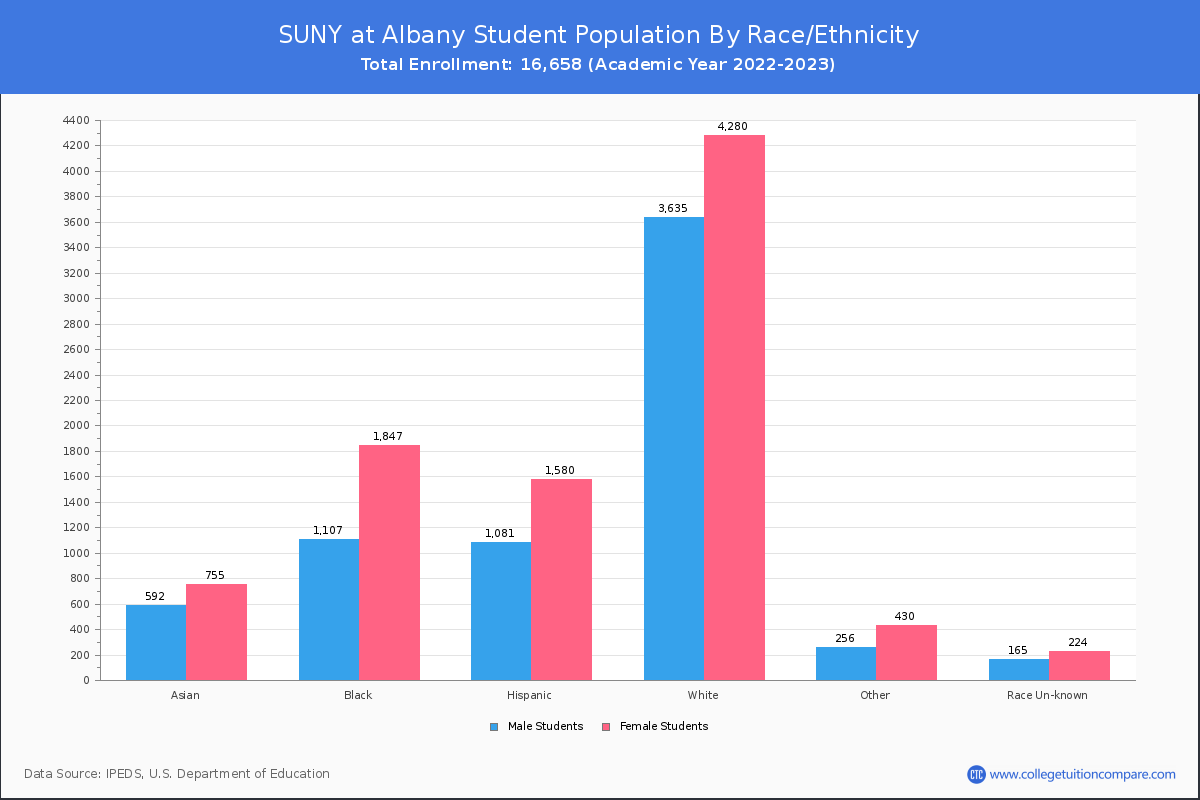
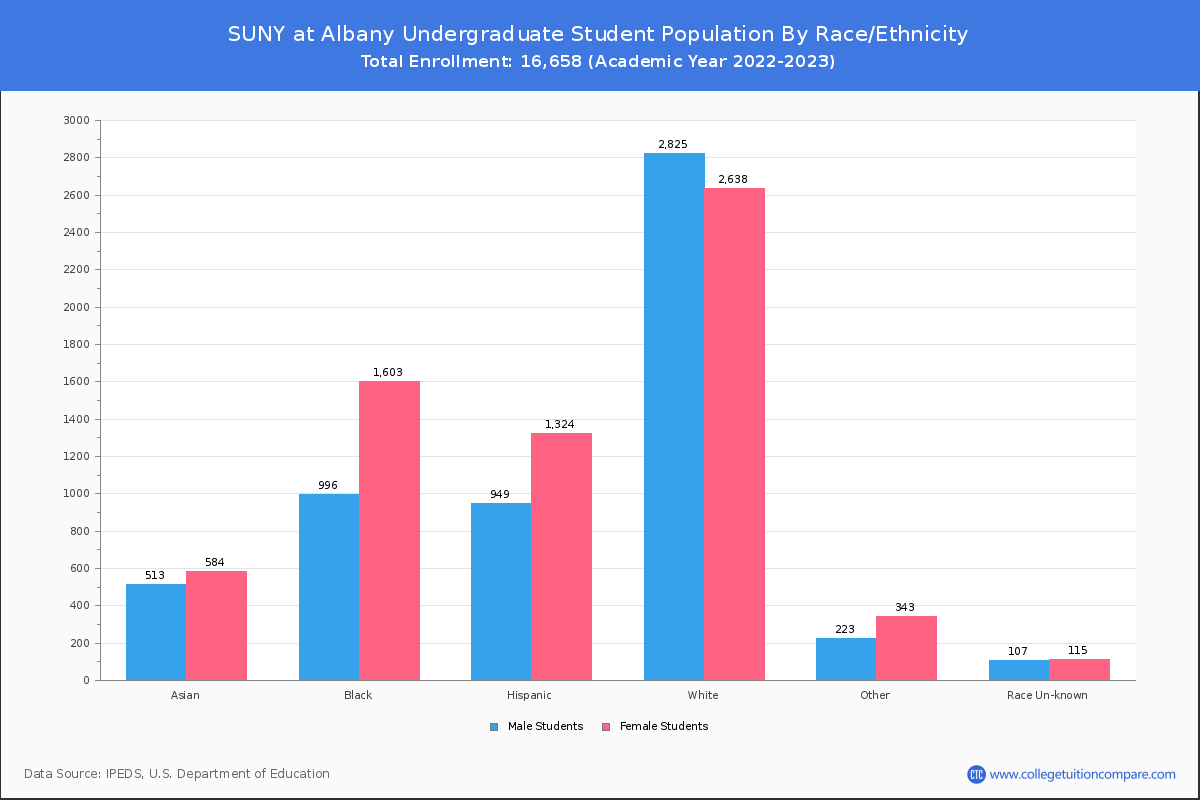
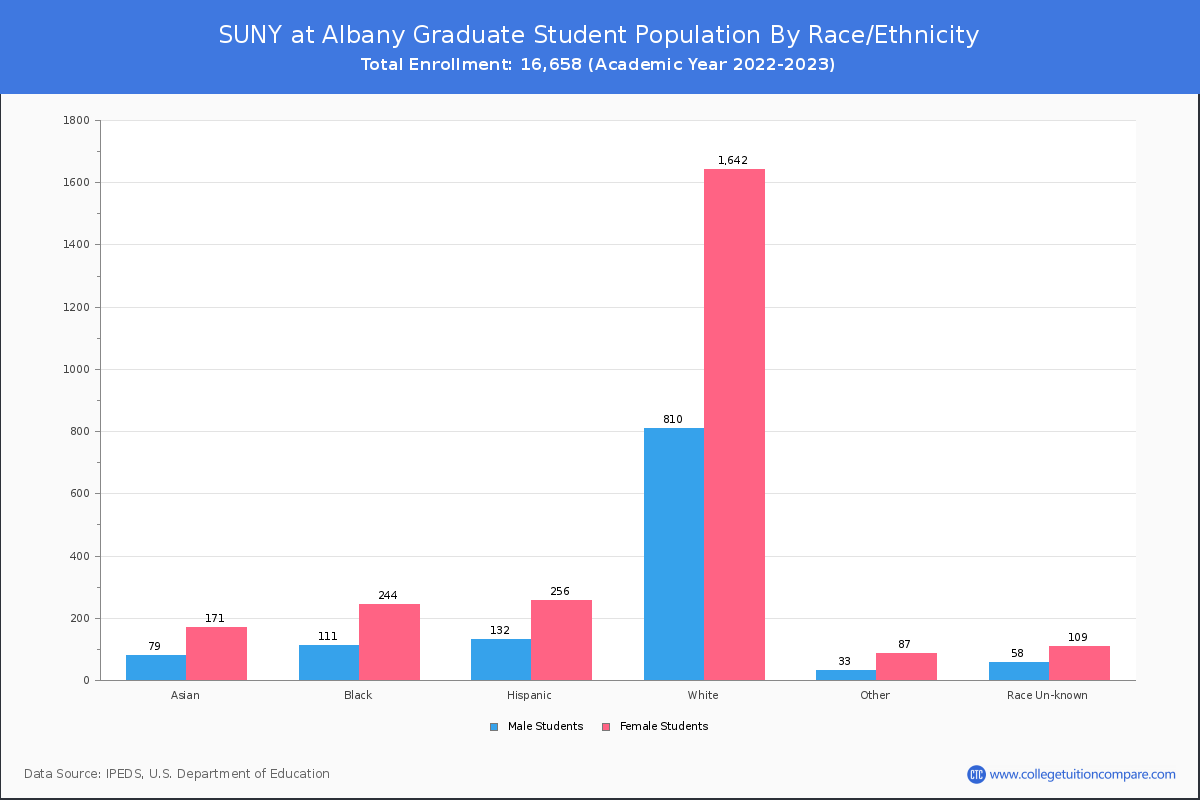
Student Distribution by Race/Ethnicity
By race/ethnicity, 7,302 White, 3,013 Black, and 1,378 Asian students out of a total of 16,658 are attending at SUNY at Albany. Comprehensive enrollment statistic data by race/ethnicity is shown in the next chart (Academic year 2022-2023 data).
| Race | Total | Men | Women |
|---|---|---|---|
| American Indian or Native American | 39 | 15 | 24 |
| Asian | 1,378 | 610 | 768 |
| Black | 3,013 | 1,163 | 1,850 |
| Hispanic | 2,671 | 1,043 | 1,628 |
| Native Hawaiian or Other Pacific Islanders | 11 | 3 | 8 |
| White | 7,302 | 3,322 | 3,980 |
| Two or more races | 628 | 240 | 388 |
| Race Unknown | 334 | 153 | 181 |
| Race | Total | Men | Women |
|---|---|---|---|
| American Indian or Native American | 35 | 14 | 21 |
| Asian | 1,138 | 535 | 603 |
| Black | 2,661 | 1,048 | 1,613 |
| Hispanic | 2,274 | 917 | 1,357 |
| Native Hawaiian or Other Pacific Islanders | 9 | 3 | 6 |
| White | 5,028 | 2,569 | 2,459 |
| Two or more races | 520 | 203 | 317 |
| Race Unknown | 184 | 96 | 88 |
| Race | Total | Men | Women |
|---|---|---|---|
| American Indian or Native American | 3 | 1 | 2 |
| Asian | 59 | 29 | 30 |
| Black | 153 | 78 | 75 |
| Hispanic | 120 | 58 | 62 |
| Native Hawaiian or Other Pacific Islanders | 2 | 1 | 1 |
| White | 425 | 228 | 197 |
| Two or more races | 41 | 20 | 21 |
| Race Unknown | 20 | 11 | 9 |
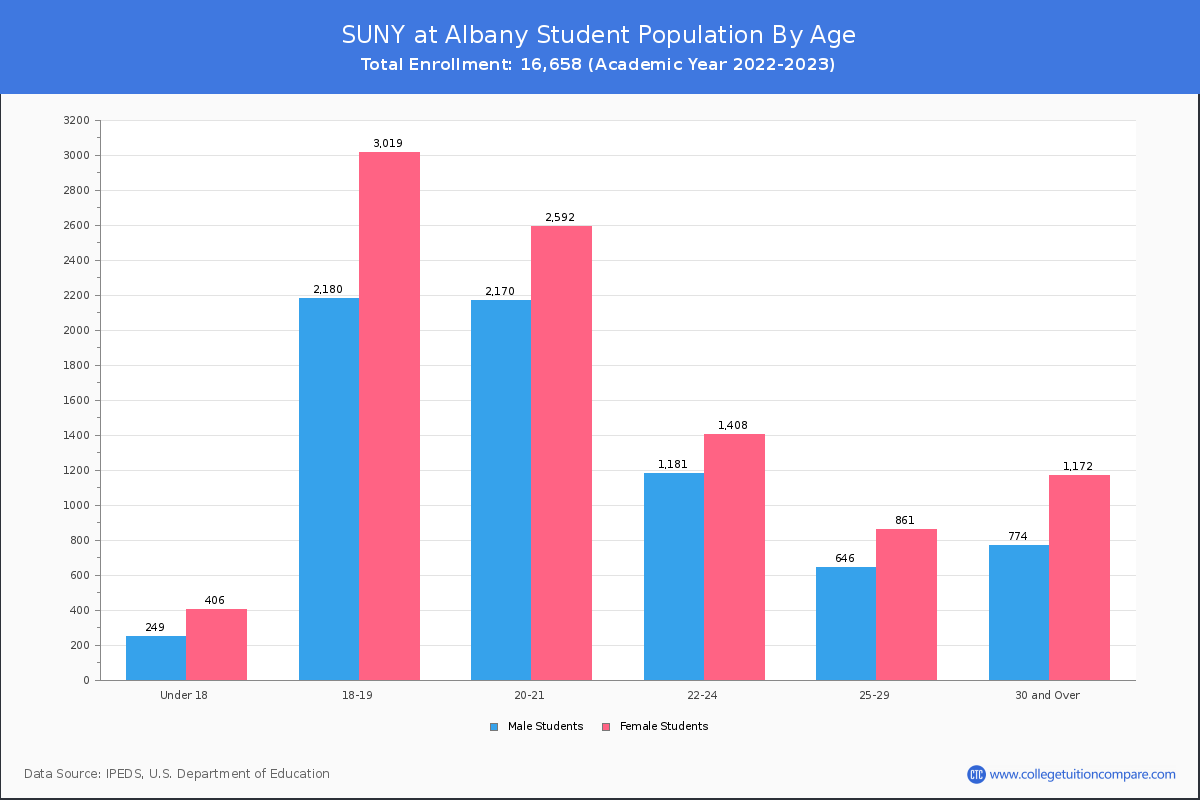
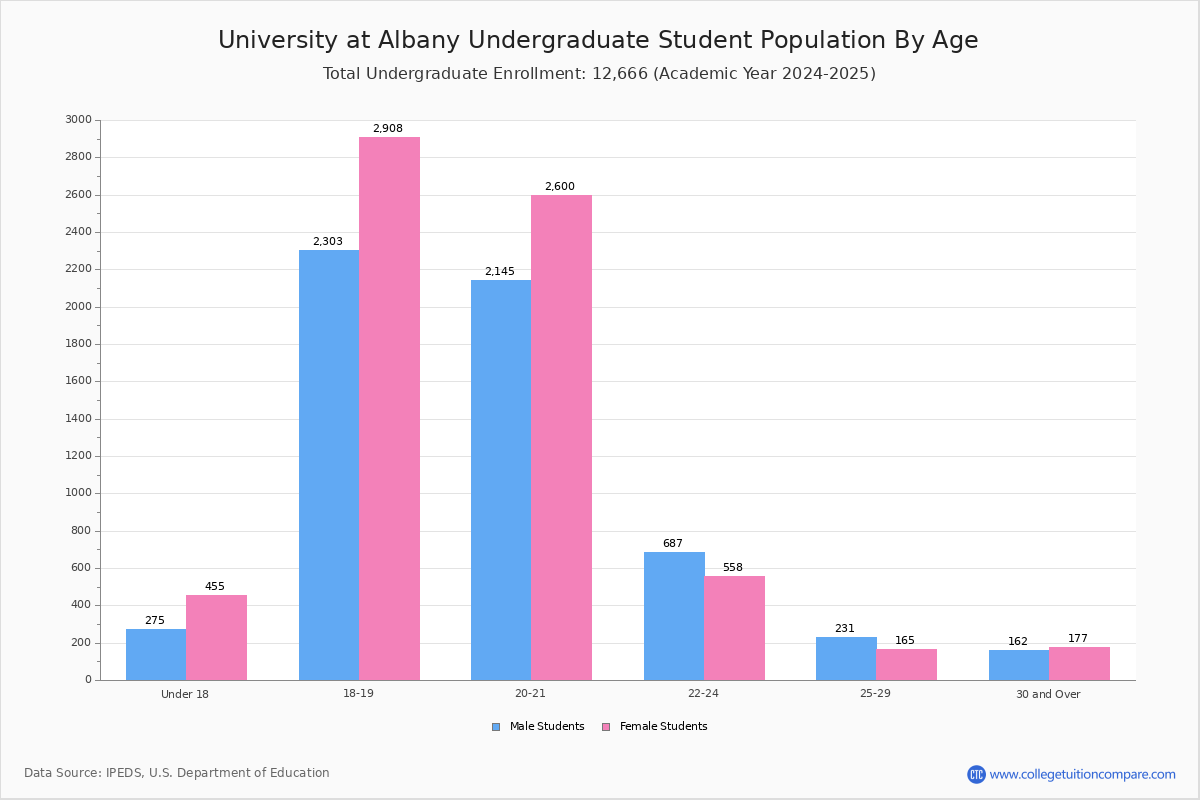
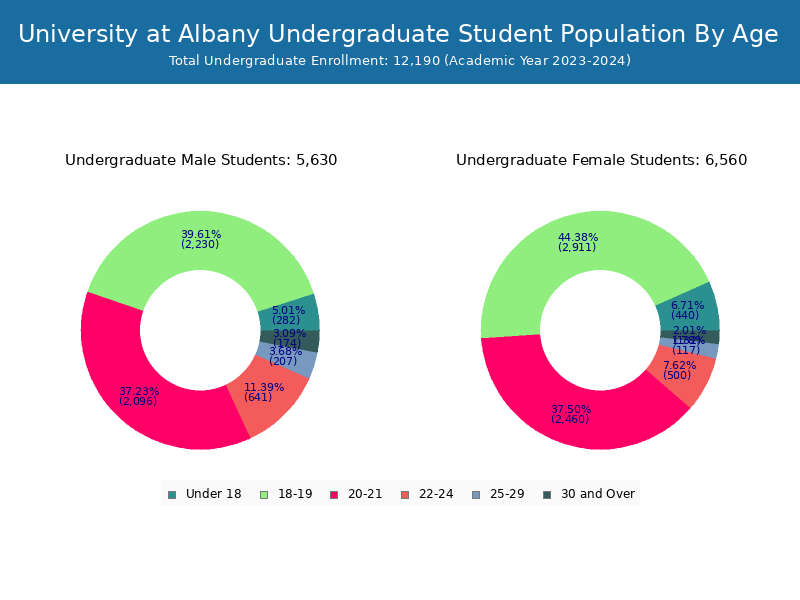
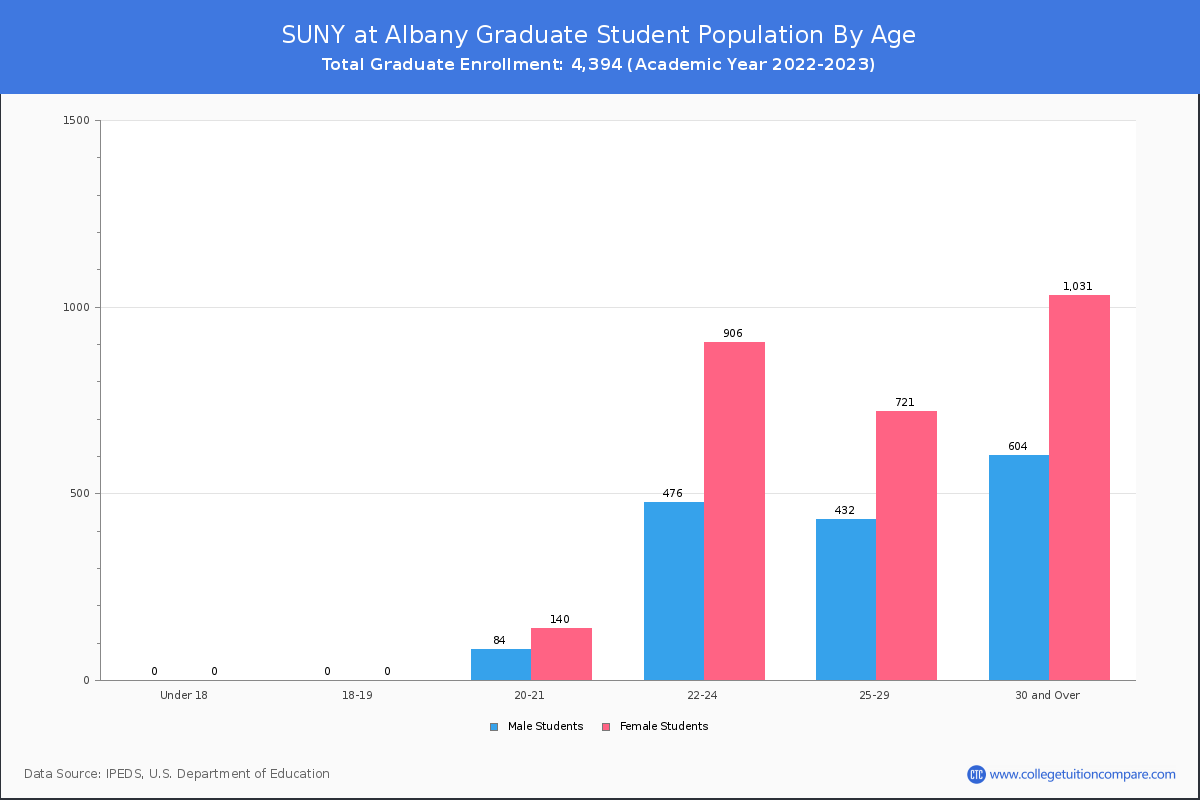
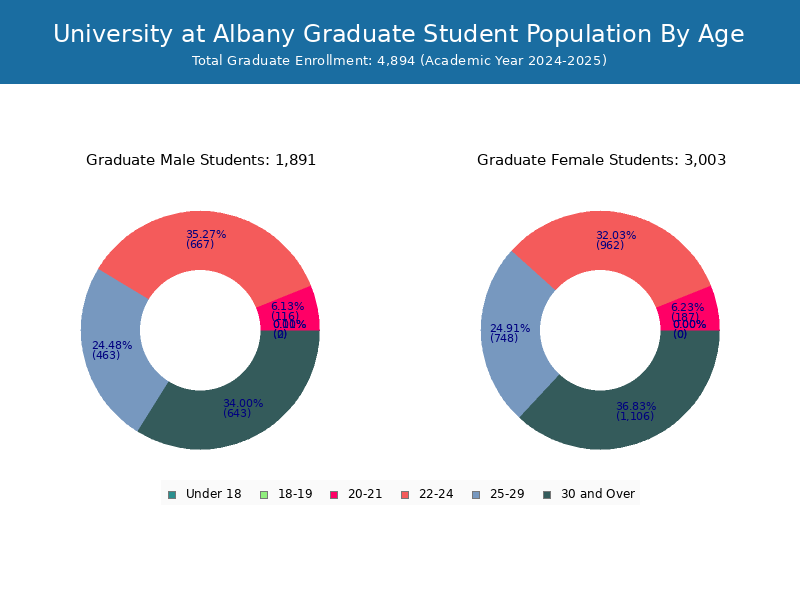
Student Age Distribution
By age, SUNY Albany has 655 students under 18 years old and 25 students over 65 years old. There are 13,205 students under 25 years old, and 3,453 students over 25 years old out of 16,658 total students.
In undergraduate programs, 655 students are younger than 18 and 4 students are older than 65. SUNY Albany has 11,599 undergraduate students aged under 25 and 665 students aged 25 and over.
It has 1,606 graduate students aged under 25 and 2,788 students aged 25 and over.
| Age | Total | Men | Women |
|---|---|---|---|
| Under 18 | 655 | 406 | 249 |
| 18-19 | 5,199 | 3,019 | 2,180 |
| 20-21 | 4,762 | 2,592 | 2,170 |
| 22-24 | 2,589 | 1,408 | 1,181 |
| 25-29 | 1,507 | 861 | 646 |
| 30-34 | 763 | 436 | 327 |
| 35-39 | 463 | 279 | 184 |
| 40-49 | 487 | 316 | 171 |
| 50-64 | 208 | 134 | 74 |
| Over 65 | 25 | 7 | 18 |
| Age | Total | Men | Women |
|---|---|---|---|
| Under 18 | 655 | 406 | 249 |
| 18-19 | 5,199 | 3,019 | 2,180 |
| 20-21 | 4,538 | 2,452 | 2,086 |
| 22-24 | 1,207 | 502 | 705 |
| 25-29 | 354 | 140 | 214 |
| 30-34 | 149 | 69 | 80 |
| 35-39 | 63 | 24 | 39 |
| 40-49 | 70 | 35 | 35 |
| 50-64 | 25 | 12 | 13 |
| Over 65 | 4 | 1 | 3 |
| Age | Total | Men | Women |
|---|
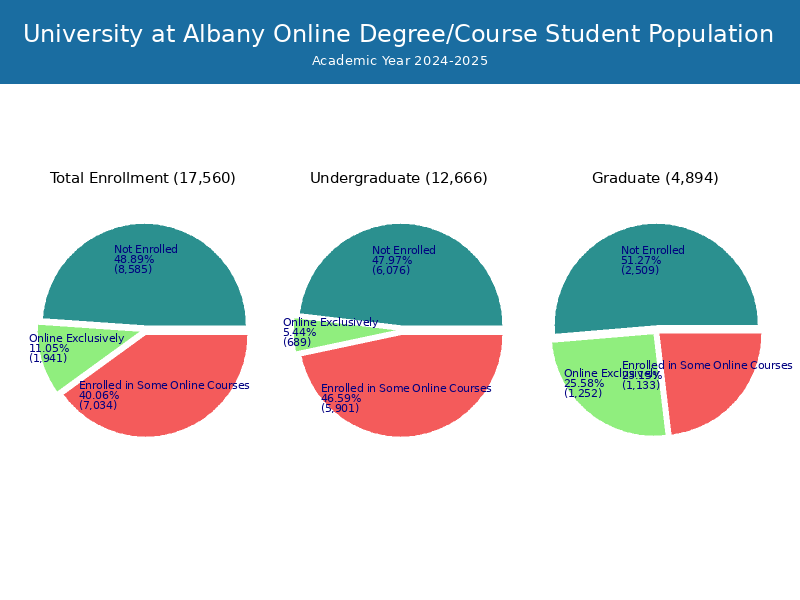
Online Student Enrollment
Distance learning, also called online education, is very attractive to students, especially who want to continue education and work in field. At SUNY at Albany, 1,494 students are enrolled exclusively in online courses and 5,239 students are enrolled in some online courses.
1,360 students lived in New York or jurisdiction in which the school is located are enrolled exclusively in online courses and 134 students live in other State or outside of the United States.
| All Students | Enrolled Exclusively Online Courses | Enrolled in Some Online Courses | |
|---|---|---|---|
| All Students | 16,658 | 1,494 | 5,239 |
| Undergraduate | 12,264 | 408 | 4,347 |
| Graduate | 4,394 | 1,086 | 892 |
| New York Residents | Other States in U.S. | Outside of U.S. | |
|---|---|---|---|
| All Students | 1,360 | 104 | 30 |
| Undergraduate | 383 | 14 | 11 |
| Graduate | 977 | 90 | 19 |
Transfer-in Students (Undergraduate)
Among 12,264 enrolled in undergraduate programs, 861 students have transferred-in from other institutions. The percentage of transfer-in students is 7.02%.808 students have transferred in as full-time status and 53 students transferred in as part-time status.
| Number of Students | |
|---|---|
| Regular Full-time | 10,733 |
| Transfer-in Full-time | 808 |
| Regular Part-time | 670 |
| Transfer-in Part-time | 53 |