Student Population by Gender
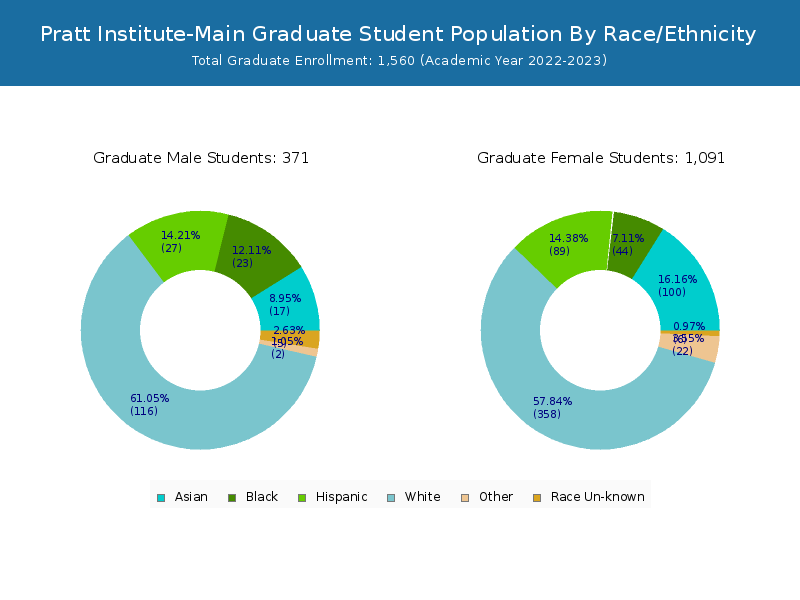
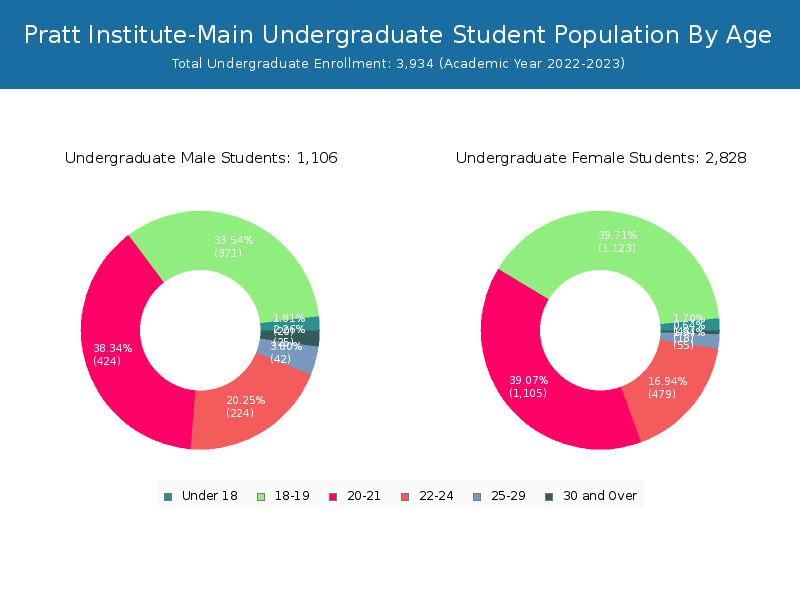
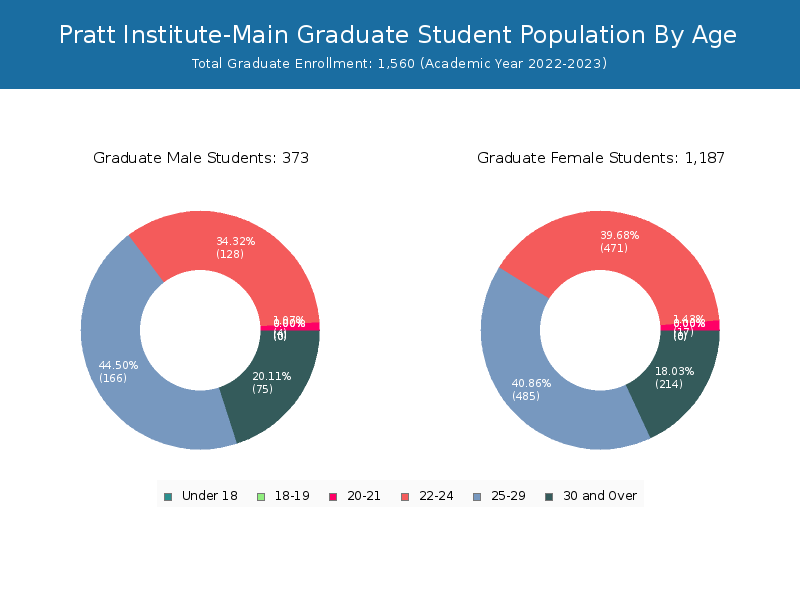
Pratt Institute-Main has a total of 5,494 enrolled students for the academic year 2022-2023. 3,934 students have enrolled in undergraduate programs and 1,560 students joined graduate programs.
By gender, 1,479 male and 4,015 female students (the male-female ratio is 27:73) are attending the school. The gender distribution is based on the 2022-2023 data.
| Total | Undergraduate | Graduate | |
|---|---|---|---|
| Total | 5,494 | 3,934 | 1,560 |
| Men | 1,479 | 1,106 | 373 |
| Women | 4,015 | 2,828 | 1,187 |
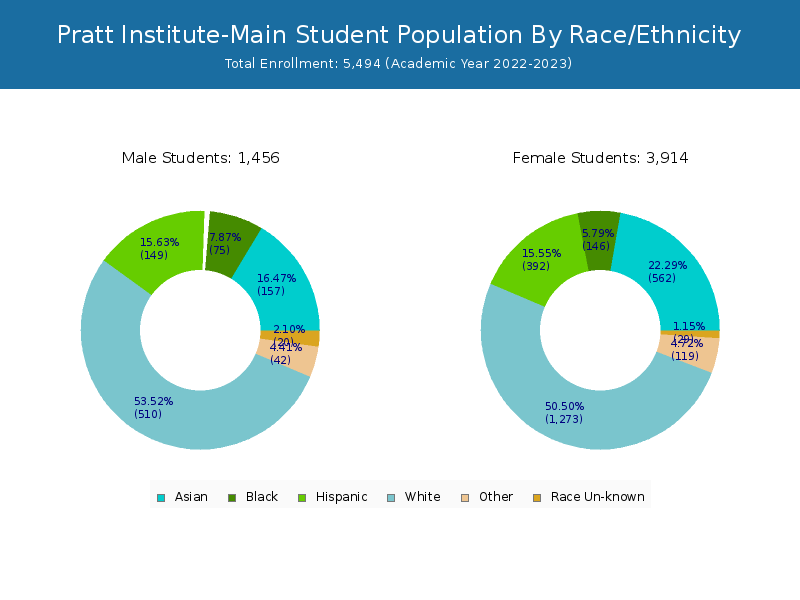
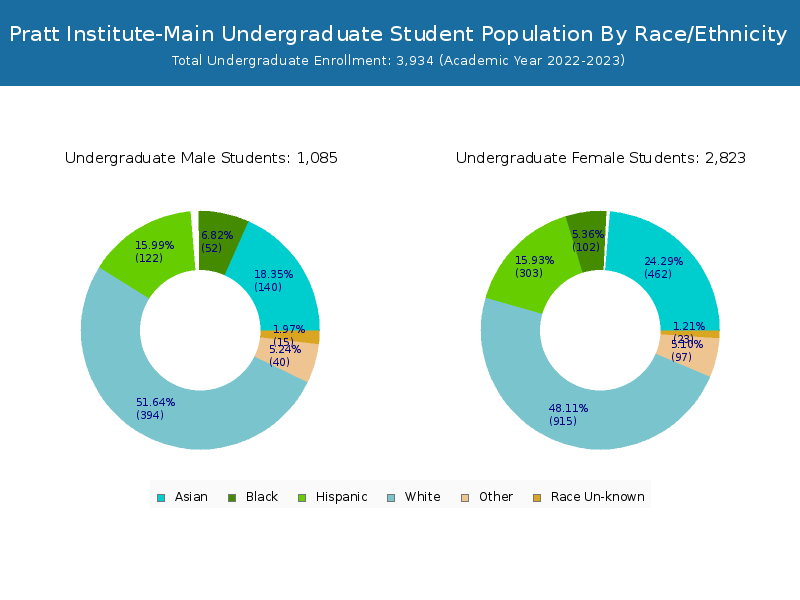
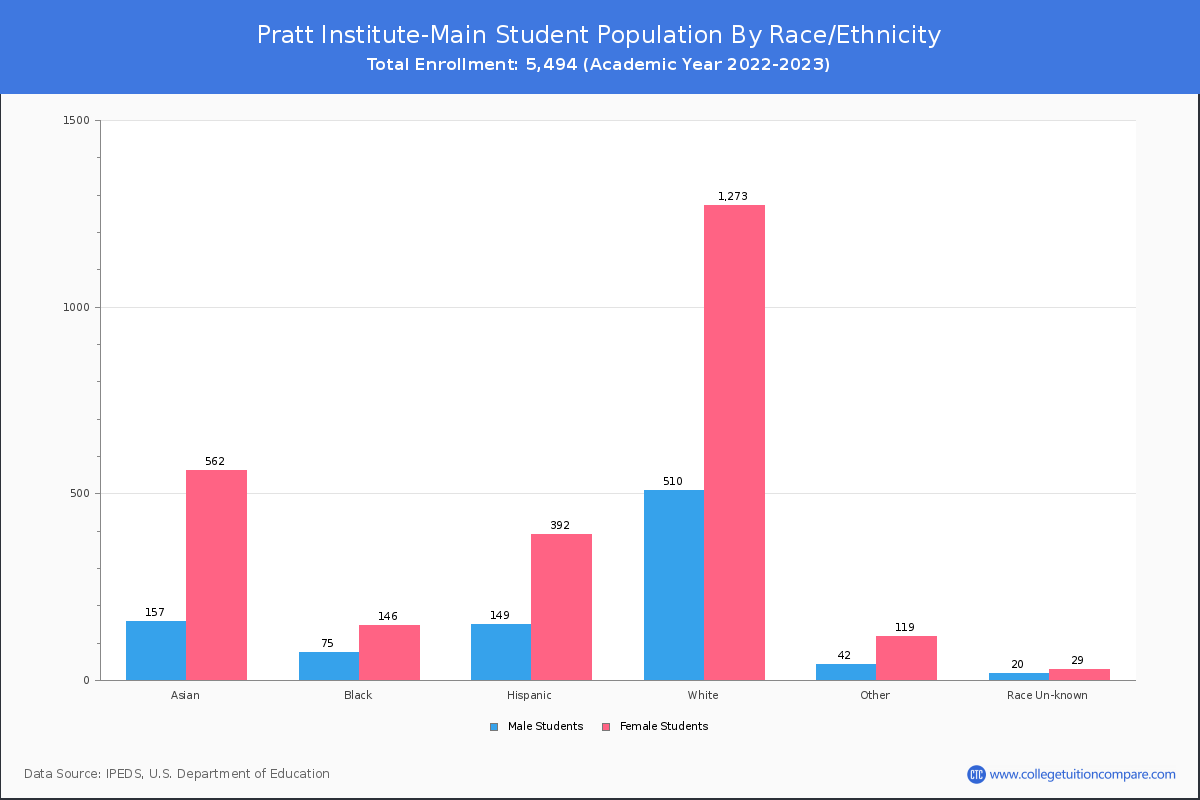
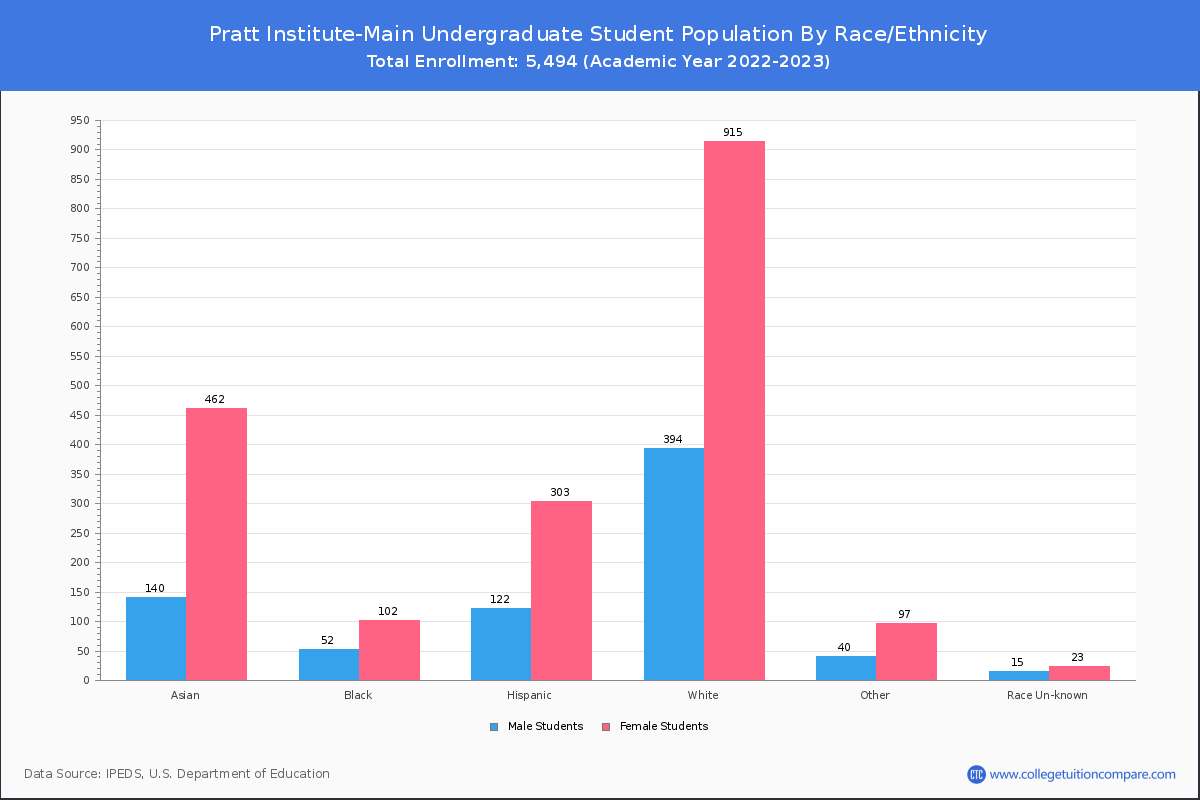
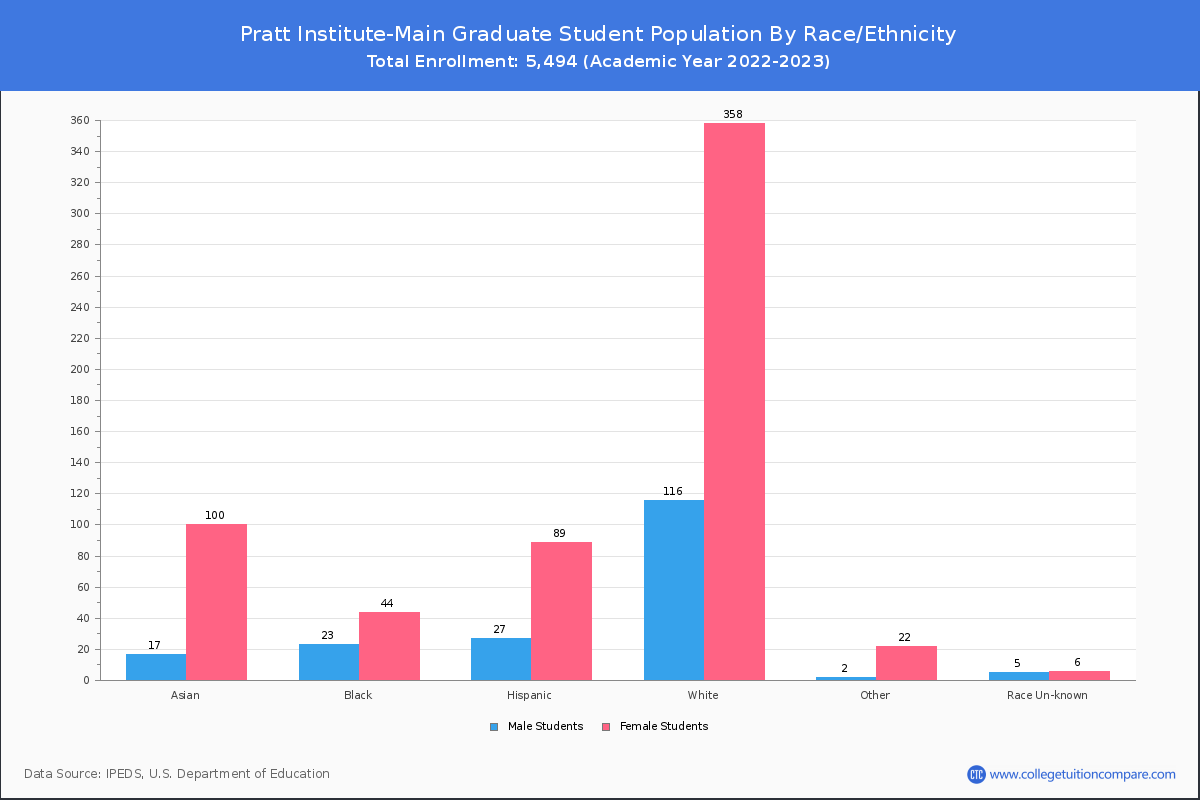
Student Distribution by Race/Ethnicity
By race/ethnicity, 1,753 White, 227 Black, and 751 Asian students out of a total of 5,494 are attending at Pratt Institute-Main. Comprehensive enrollment statistic data by race/ethnicity is shown in the next chart (Academic year 2022-2023 data).
| Race | Total | Men | Women |
|---|---|---|---|
| American Indian or Native American | 4 | 1 | 3 |
| Asian | 751 | 158 | 593 |
| Black | 227 | 68 | 159 |
| Hispanic | 528 | 160 | 368 |
| Native Hawaiian or Other Pacific Islanders | 2 | 0 | 2 |
| White | 1,753 | 507 | 1,246 |
| Two or more races | 164 | 45 | 119 |
| Race Unknown | 55 | 17 | 38 |
| Race | Total | Men | Women |
|---|---|---|---|
| American Indian or Native American | 4 | 1 | 3 |
| Asian | 626 | 143 | 483 |
| Black | 167 | 51 | 116 |
| Hispanic | 420 | 129 | 291 |
| Native Hawaiian or Other Pacific Islanders | 2 | 0 | 2 |
| White | 1,285 | 397 | 888 |
| Two or more races | 137 | 40 | 97 |
| Race Unknown | 43 | 14 | 29 |
| Race | Total | Men | Women |
|---|---|---|---|
| American Indian or Native American | 0 | 0 | 0 |
| Asian | 9 | 1 | 8 |
| Black | 8 | 3 | 5 |
| Hispanic | 18 | 4 | 14 |
| Native Hawaiian or Other Pacific Islanders | 0 | 0 | 0 |
| White | 28 | 10 | 18 |
| Two or more races | 3 | 0 | 3 |
| Race Unknown | 0 | 0 | 0 |
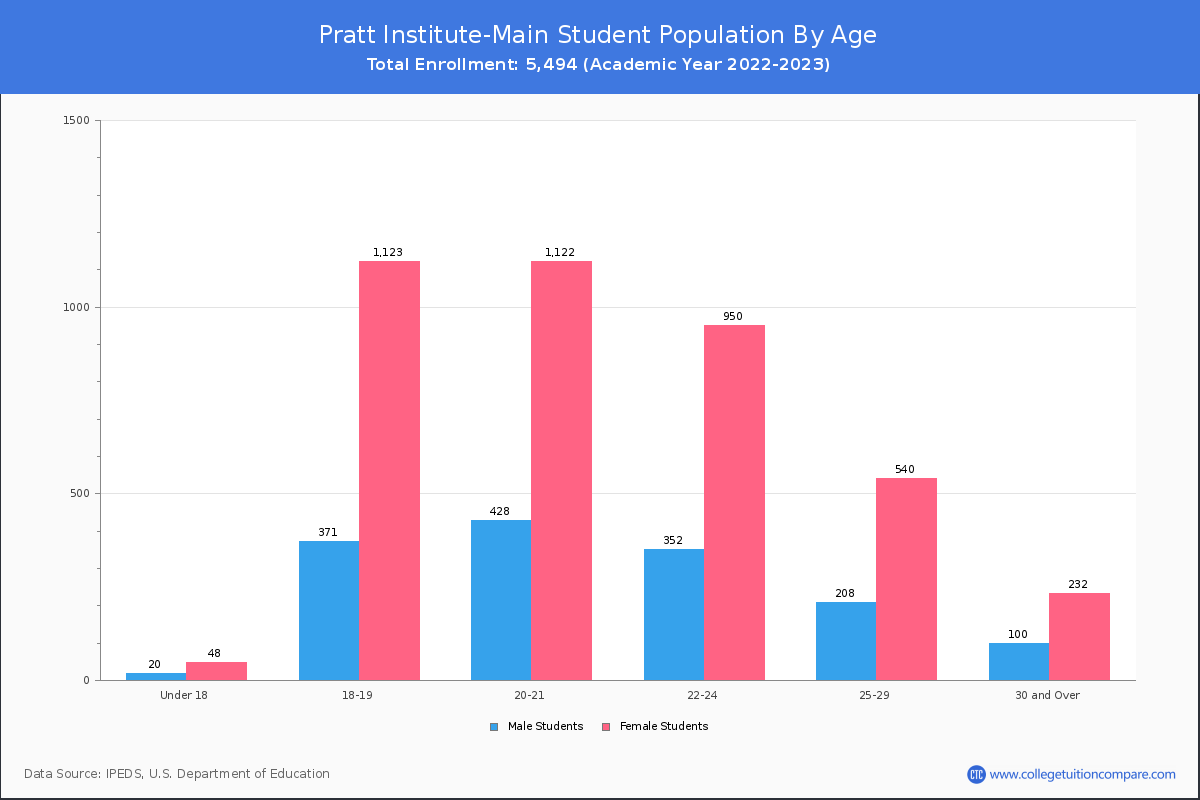
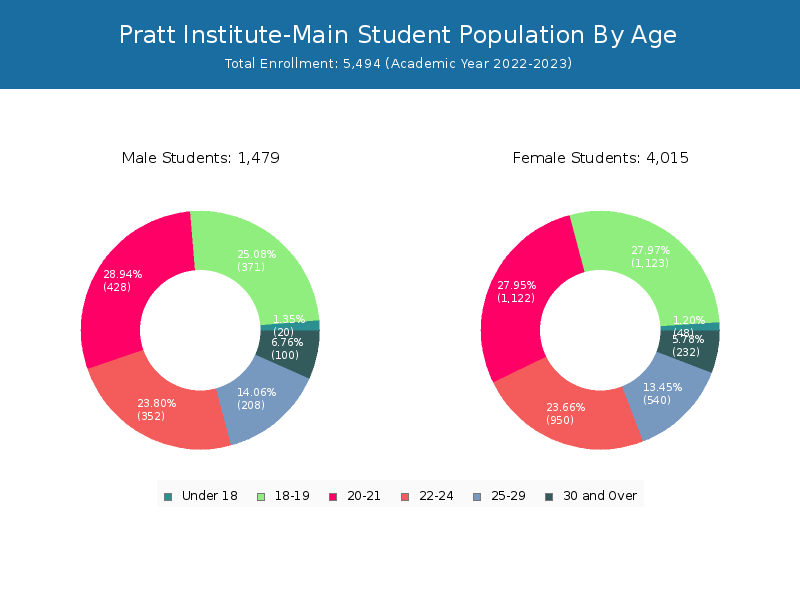
Student Age Distribution
By age, Pratt Institute has 68 students under 18 years old and 2 students over 65 years old. There are 4,414 students under 25 years old, and 1,080 students over 25 years old out of 5,494 total students.
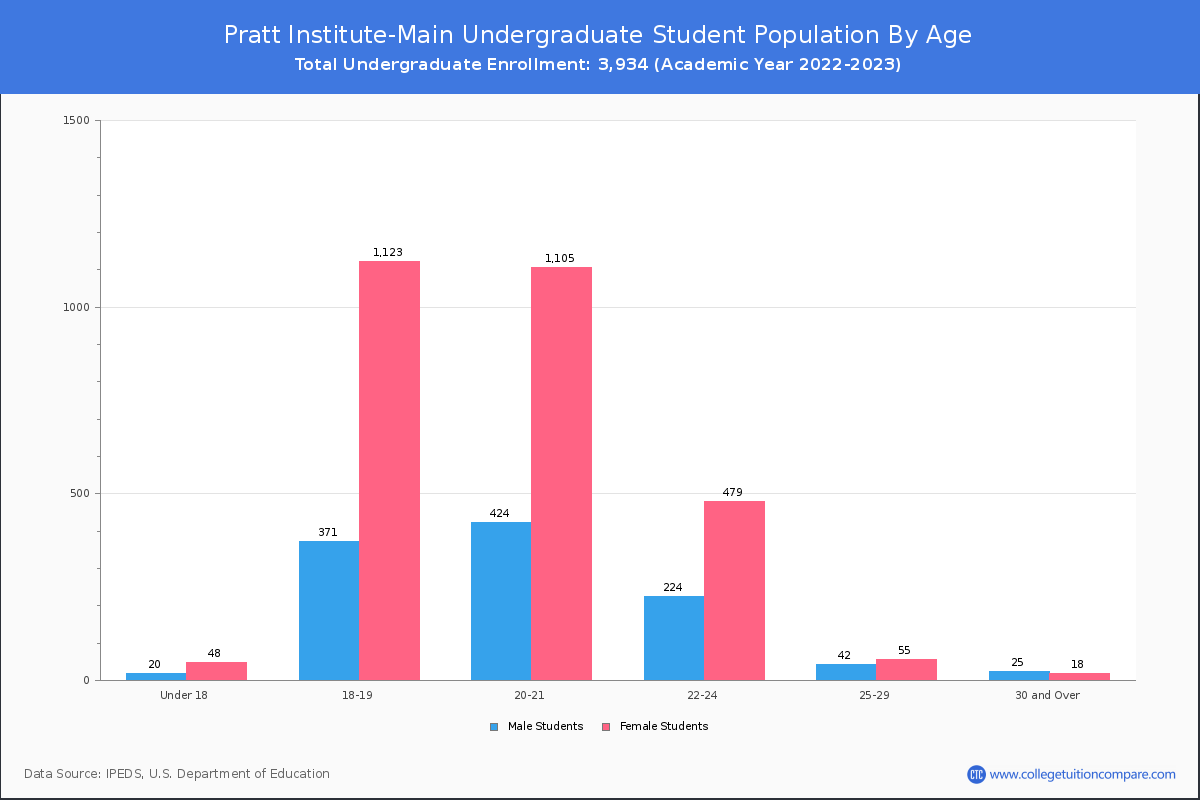
Pratt Institute has 3,794 undergraduate students aged under 25 and 140 students aged 25 and over.
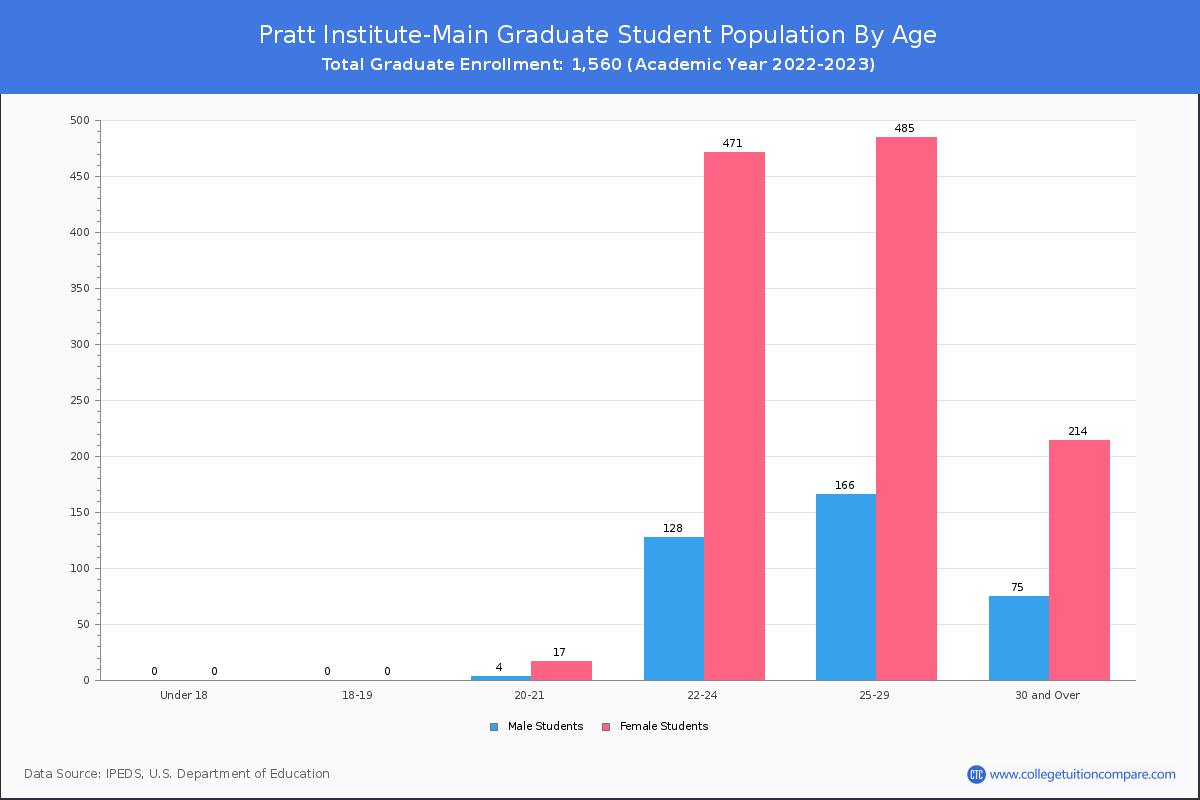
It has 620 graduate students aged under 25 and 940 students aged 25 and over.
| Age | Total | Men | Women |
|---|---|---|---|
| Under 18 | 68 | 48 | 20 |
| 18-19 | 1,494 | 1,123 | 371 |
| 20-21 | 1,550 | 1,122 | 428 |
| 22-24 | 1,302 | 950 | 352 |
| 25-29 | 748 | 540 | 208 |
| 30-34 | 205 | 139 | 66 |
| 35-39 | 62 | 39 | 23 |
| 40-49 | 47 | 39 | 8 |
| 50-64 | 16 | 13 | 3 |
| Over 65 | 2 | 2 | 0 |
| Age | Total | Men | Women |
|---|---|---|---|
| Under 18 | 68 | 48 | 20 |
| 18-19 | 1,494 | 1,123 | 371 |
| 20-21 | 1,529 | 1,105 | 424 |
| 22-24 | 703 | 479 | 224 |
| 25-29 | 97 | 55 | 42 |
| 30-34 | 29 | 13 | 16 |
| 35-39 | 7 | 2 | 5 |
| 40-49 | 5 | 3 | 2 |
| 50-64 | 2 | 0 | 2 |
| Age | Total | Men | Women |
|---|
Transfer-in Students (Undergraduate)
Among 3,934 enrolled in undergraduate programs, 82 students have transferred-in from other institutions. The percentage of transfer-in students is 2.08%.81 students have transferred in as full-time status and 1 students transferred in as part-time status.
| Number of Students | |
|---|---|
| Regular Full-time | 3,773 |
| Transfer-in Full-time | 81 |
| Regular Part-time | 79 |
| Transfer-in Part-time | 1 |