Student Population by Gender
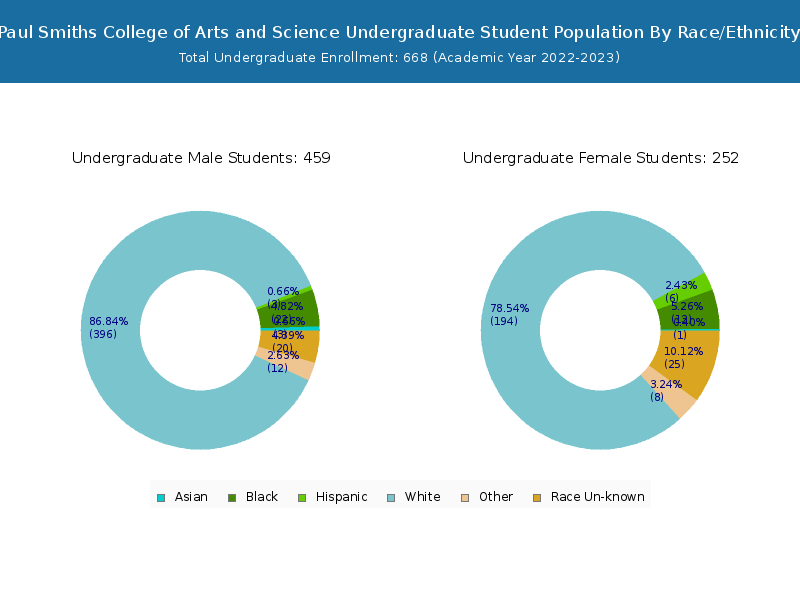
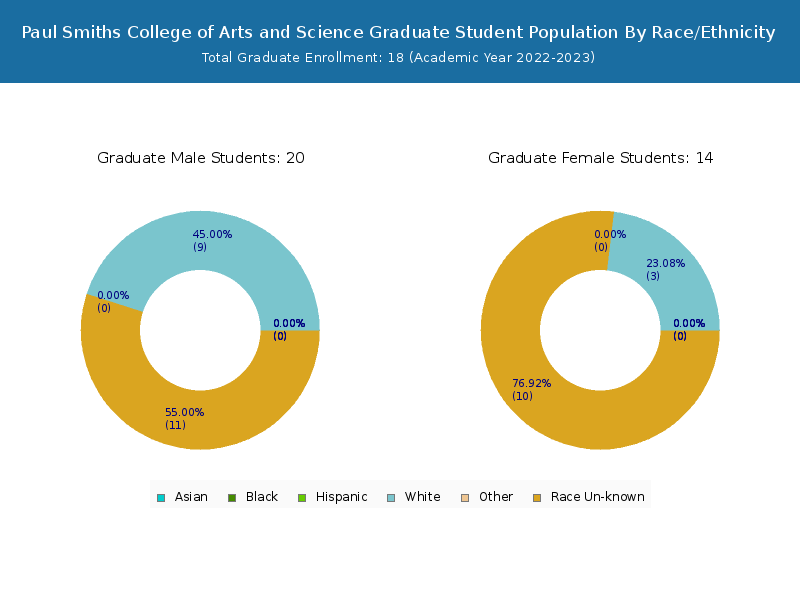
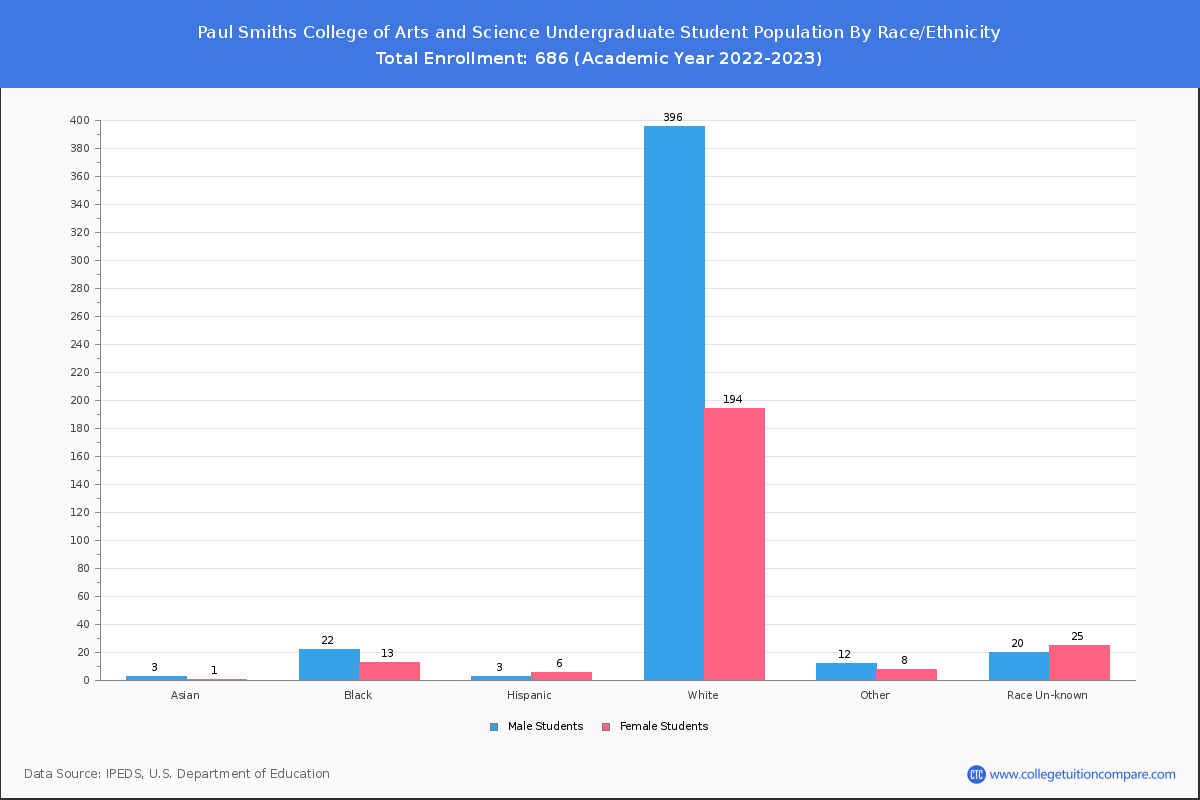
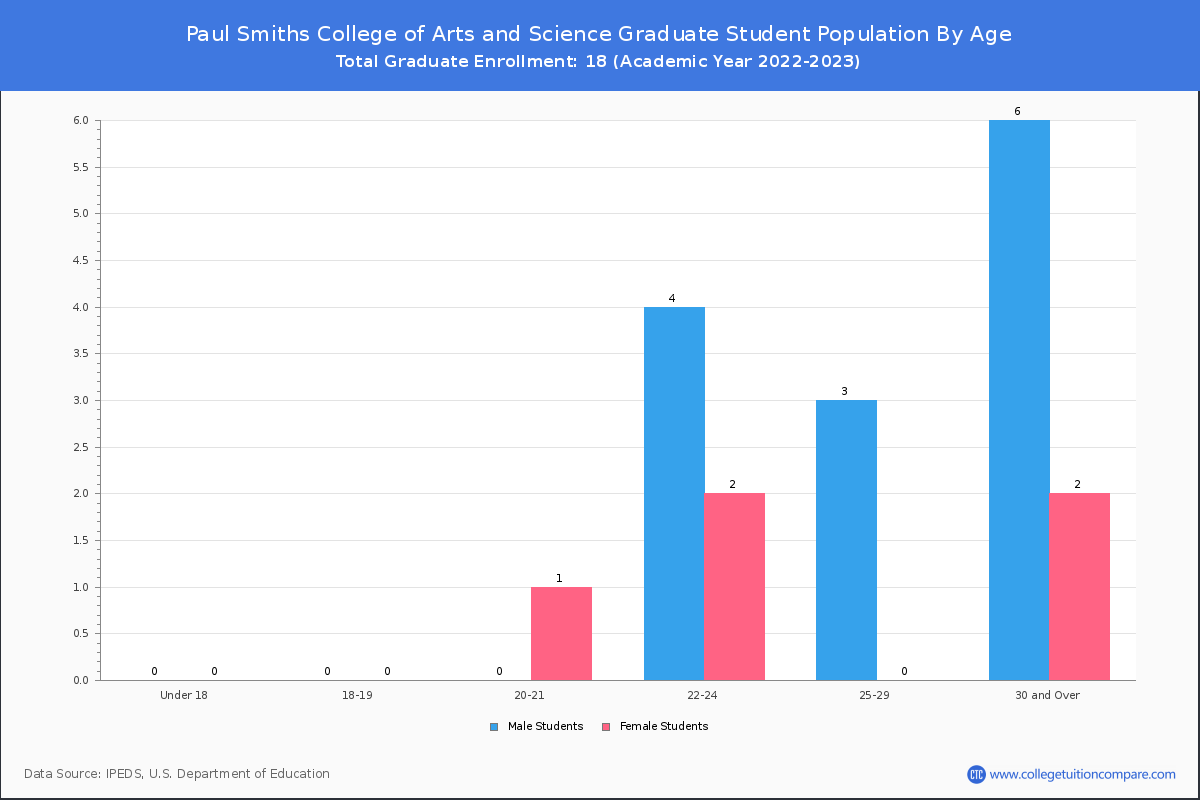
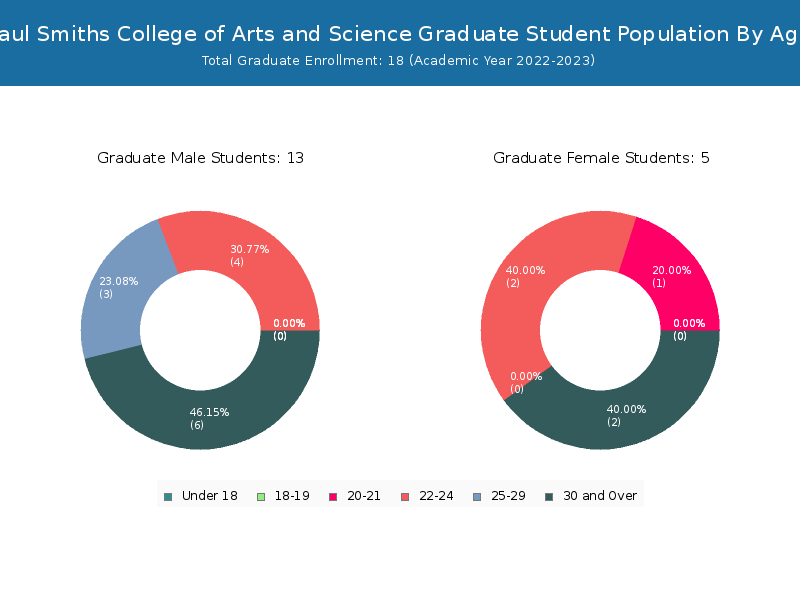
Paul Smiths College of Arts and Science has a total of 686 enrolled students for the academic year 2022-2023. 668 students have enrolled in undergraduate programs and 18 students joined graduate programs.
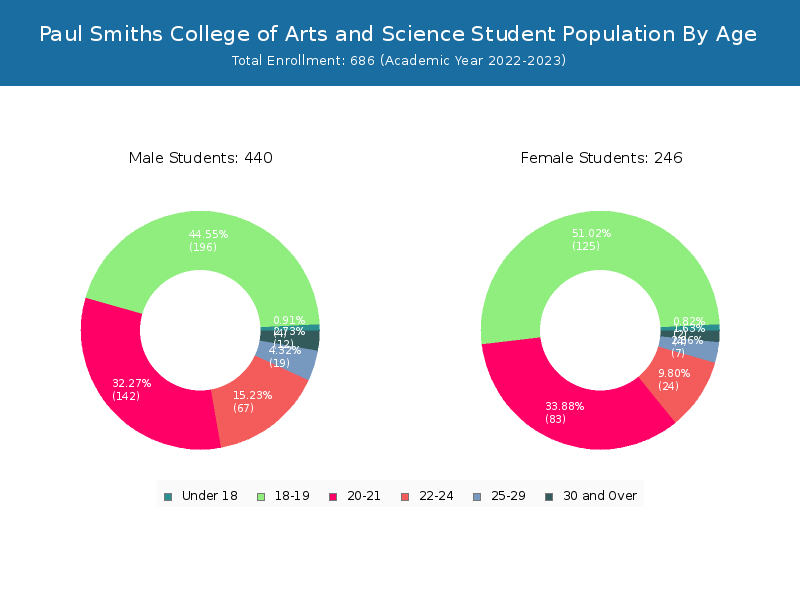
By gender, 440 male and 246 female students (the male-female ratio is 64:36) are attending the school. The gender distribution is based on the 2022-2023 data.
| Total | Undergraduate | Graduate | |
|---|---|---|---|
| Total | 686 | 668 | 18 |
| Men | 440 | 427 | 13 |
| Women | 246 | 241 | 5 |

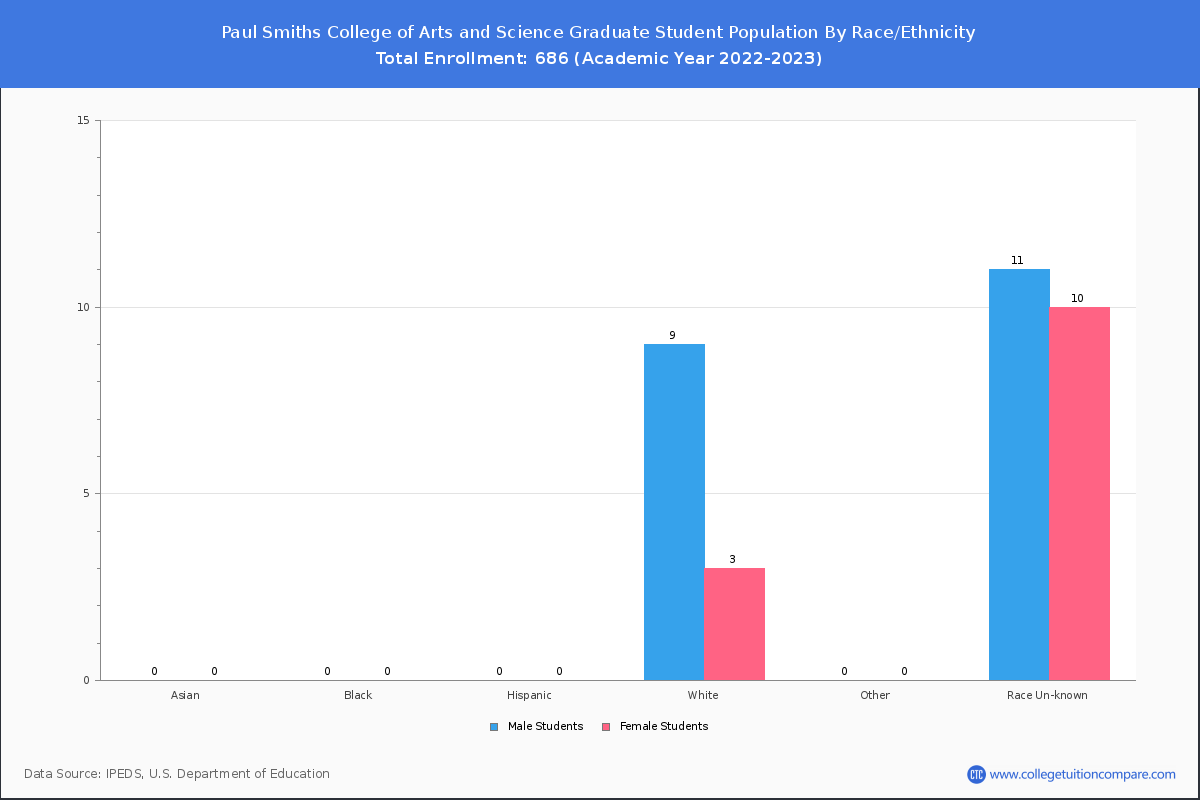
Student Distribution by Race/Ethnicity
By race/ethnicity, 554 White, 31 Black, and 6 Asian students out of a total of 686 are attending at Paul Smiths College of Arts and Science. Comprehensive enrollment statistic data by race/ethnicity is shown in the next chart (Academic year 2022-2023 data).
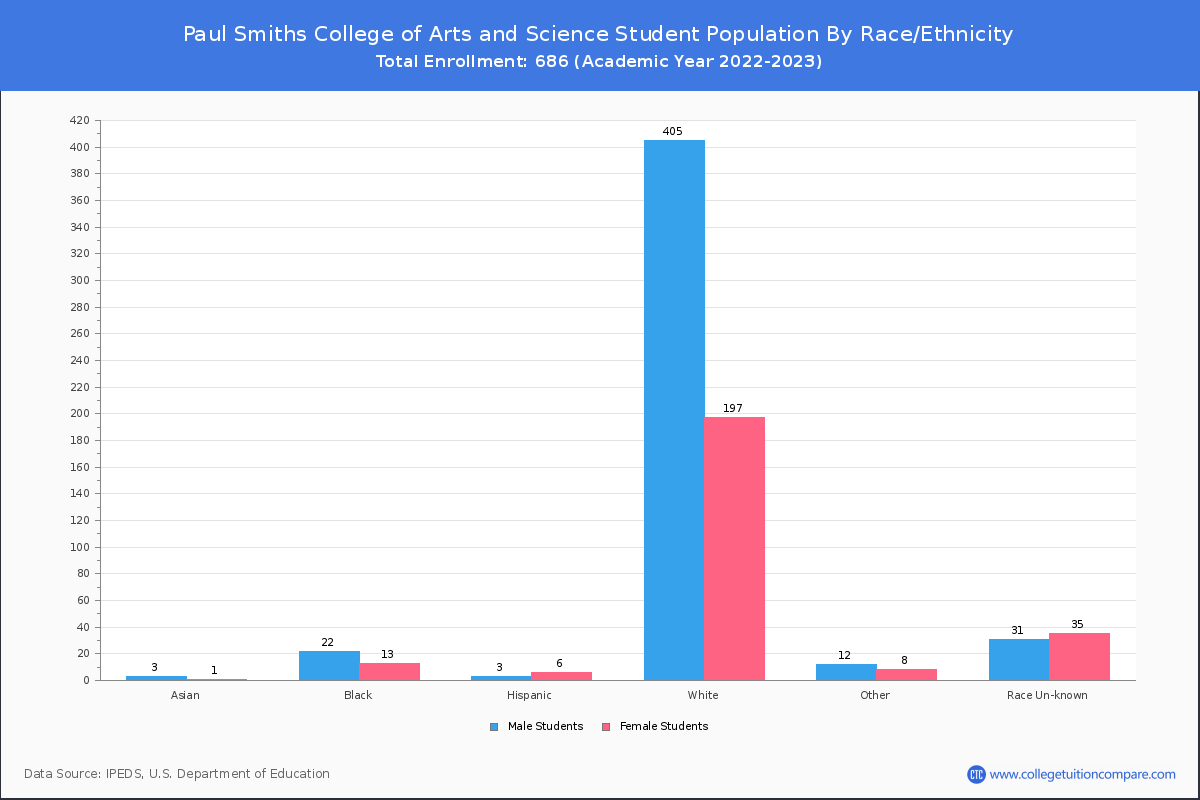
| Race | Total | Men | Women |
|---|---|---|---|
| American Indian or Native American | 14 | 10 | 4 |
| Asian | 6 | 4 | 2 |
| Black | 31 | 20 | 11 |
| Hispanic | 4 | 2 | 2 |
| Native Hawaiian or Other Pacific Islanders | 0 | 0 | 0 |
| White | 554 | 364 | 190 |
| Two or more races | 5 | 3 | 2 |
| Race Unknown | 67 | 35 | 32 |
| Race | Total | Men | Women |
|---|---|---|---|
| American Indian or Native American | 14 | 10 | 4 |
| Asian | 6 | 4 | 2 |
| Black | 31 | 20 | 11 |
| Hispanic | 4 | 2 | 2 |
| Native Hawaiian or Other Pacific Islanders | 0 | 0 | 0 |
| White | 544 | 355 | 189 |
| Two or more races | 5 | 3 | 2 |
| Race Unknown | 60 | 32 | 28 |
| Race | Total | Men | Women |
|---|---|---|---|
| American Indian or Native American | 0 | 0 | 0 |
| Asian | 0 | 0 | 0 |
| Black | 2 | 2 | 0 |
| Hispanic | 0 | 0 | 0 |
| Native Hawaiian or Other Pacific Islanders | 0 | 0 | 0 |
| White | 24 | 19 | 5 |
| Two or more races | 1 | 1 | 0 |
| Race Unknown | 3 | 1 | 2 |
Student Age Distribution
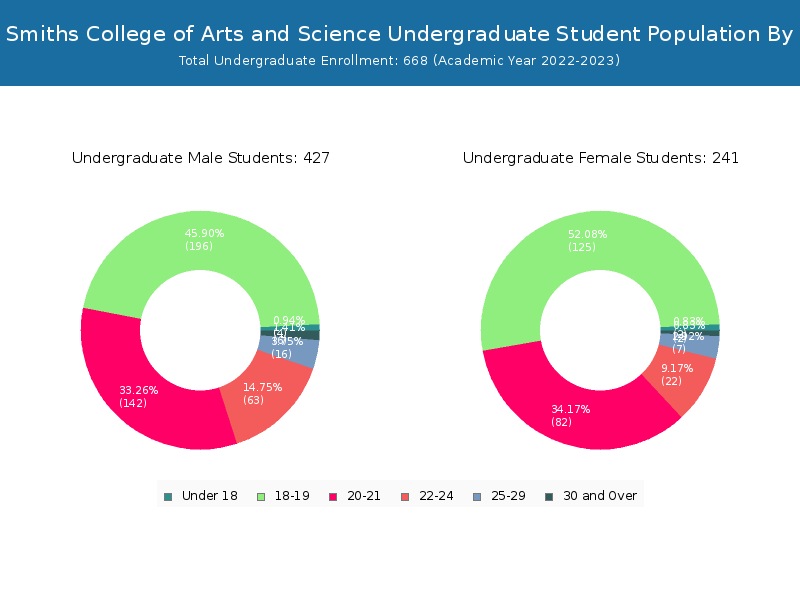
By age, Paul Smith's College has 6 students under 18 years old and 1 students over 65 years old. There are 643 students under 25 years old, and 42 students over 25 years old out of 686 total students.
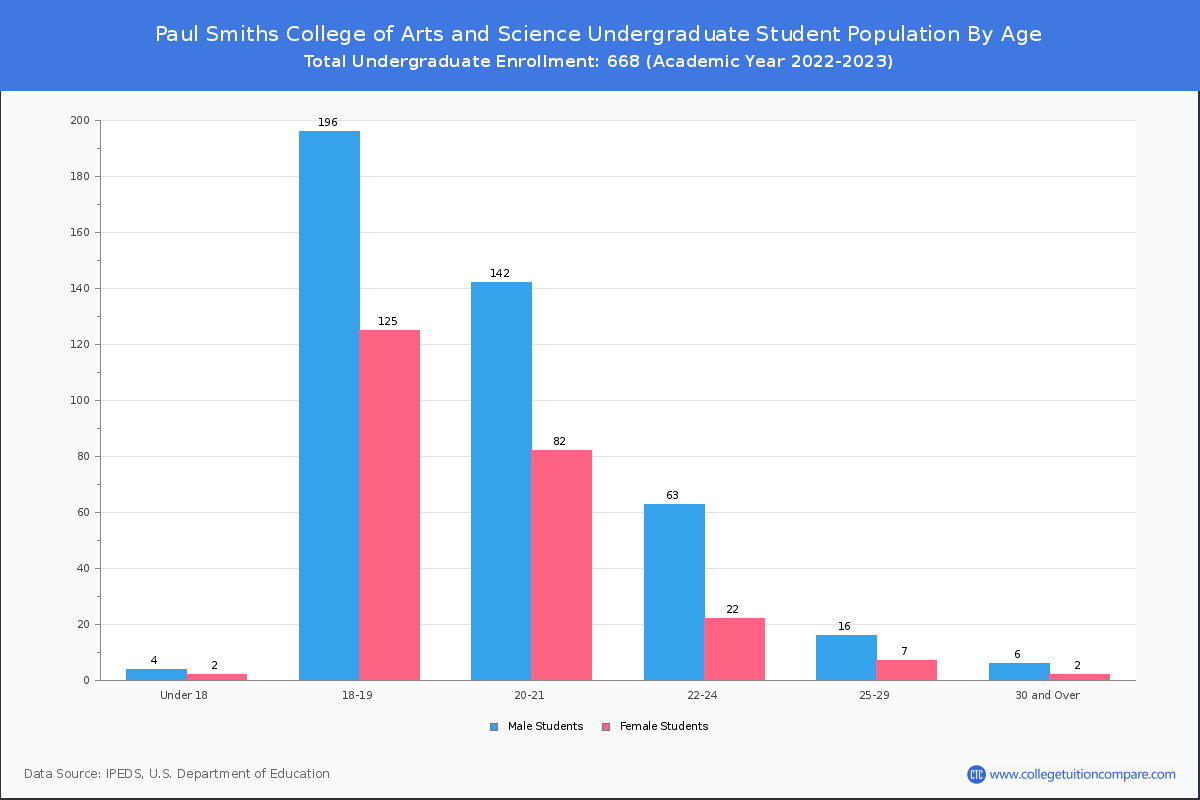
In undergraduate programs, 6 students are younger than 18 and 1 students are older than 65. Paul Smith's College has 636 undergraduate students aged under 25 and 31 students aged 25 and over.
It has 7 graduate students aged under 25 and 11 students aged 25 and over.
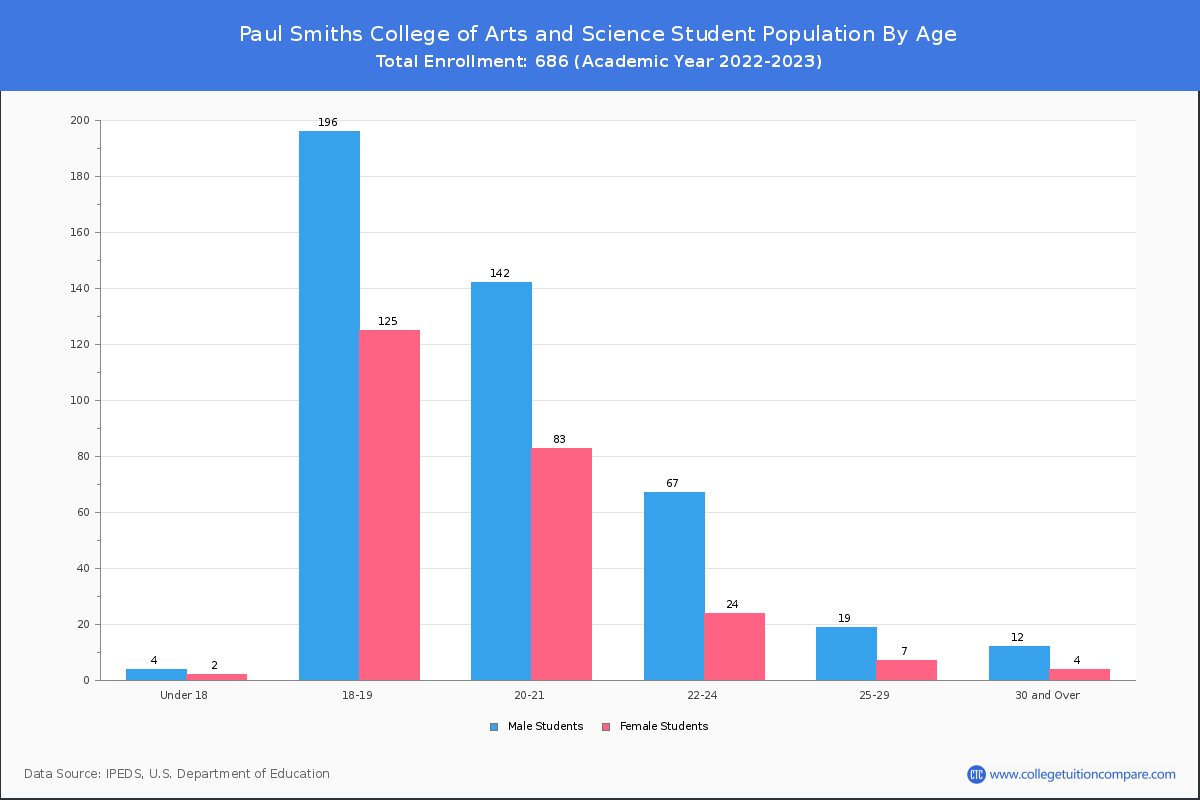
| Age | Total | Men | Women |
|---|---|---|---|
| Under 18 | 6 | 2 | 4 |
| 18-19 | 321 | 125 | 196 |
| 20-21 | 225 | 83 | 142 |
| 22-24 | 91 | 24 | 67 |
| 25-29 | 26 | 7 | 19 |
| 30-34 | 6 | 0 | 6 |
| 35-39 | 2 | 1 | 1 |
| 40-49 | 2 | 0 | 2 |
| 50-64 | 5 | 2 | 3 |
| Over 65 | 1 | 1 | 0 |
| Age | Total | Men | Women |
|---|---|---|---|
| Under 18 | 6 | 2 | 4 |
| 18-19 | 321 | 125 | 196 |
| 20-21 | 224 | 82 | 142 |
| 22-24 | 85 | 22 | 63 |
| 25-29 | 23 | 7 | 16 |
| 30-34 | 5 | 0 | 5 |
| Age | Total | Men | Women |
|---|
Online Student Enrollment
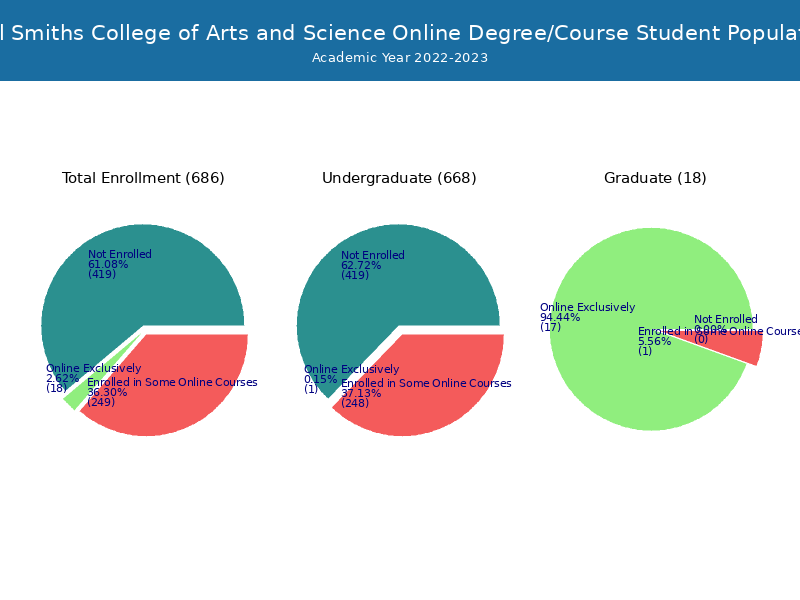
Distance learning, also called online education, is very attractive to students, especially who want to continue education and work in field. At Paul Smiths College of Arts and Science, 18 students are enrolled exclusively in online courses and 249 students are enrolled in some online courses.
13 students lived in New York or jurisdiction in which the school is located are enrolled exclusively in online courses and 5 students live in other State or outside of the United States.
| All Students | Enrolled Exclusively Online Courses | Enrolled in Some Online Courses | |
|---|---|---|---|
| All Students | 686 | 18 | 249 |
| Undergraduate | 668 | 1 | 248 |
| Graduate | 18 | 17 | 1 |
| New York Residents | Other States in U.S. | Outside of U.S. | |
|---|---|---|---|
| All Students | 13 | 5 | 0 |
| Undergraduate | 0 | 1 | 0 |
| Graduate | 13 | 4 | 0 |
Transfer-in Students (Undergraduate)
Among 668 enrolled in undergraduate programs, 30 students have transferred-in from other institutions. The percentage of transfer-in students is 4.49%.
| Number of Students | |
|---|---|
| Regular Full-time | 624 |
| Transfer-in Full-time | 30 |