Student Population by Gender
Hamilton College has a total of 2,072 enrolled students for the academic year 2022-2023. All 2,072 students are enrolled into undergraduate programs.
By gender, 928 male and 1,144 female students (the male-female ratio is 45:55) are attending the school. The gender distribution is based on the 2022-2023 data.
| Undergraduate | |
|---|---|
| Total | 2,072 |
| Men | 928 |
| Women | 1,144 |

Student Distribution by Race/Ethnicity
By race/ethnicity, 1,336 White, 65 Black, and 187 Asian students out of a total of 2,072 are attending at Hamilton College. Comprehensive enrollment statistic data by race/ethnicity is shown in the next chart (Academic year 2022-2023 data).
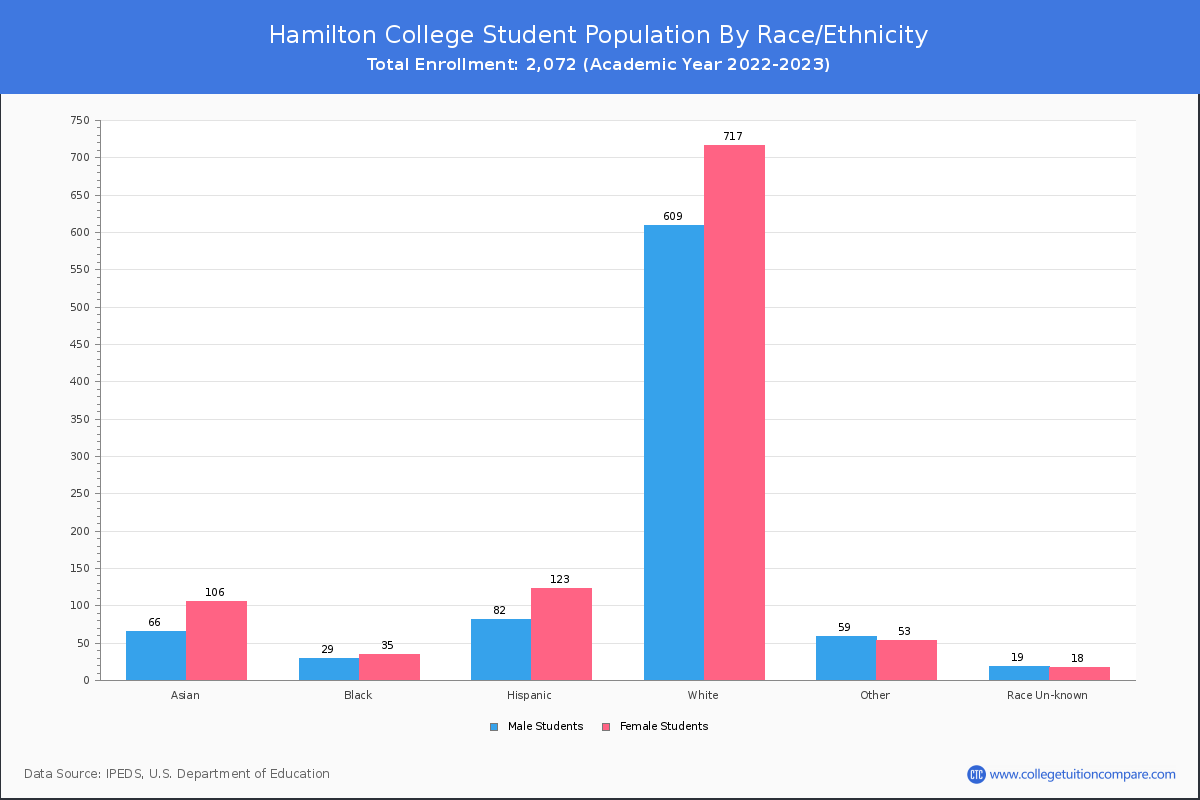
| Race | Total | Men | Women |
|---|---|---|---|
| American Indian or Native American | 1 | 1 | 0 |
| Asian | 187 | 78 | 109 |
| Black | 65 | 28 | 37 |
| Hispanic | 197 | 80 | 117 |
| Native Hawaiian or Other Pacific Islanders | 0 | 0 | 0 |
| White | 1,336 | 592 | 744 |
| Two or more races | 109 | 54 | 55 |
| Race Unknown | 26 | 12 | 14 |
Student Age Distribution
There are 2,071 students under 25 years old, and 1 students over 25 years old out of 2,072 total students.
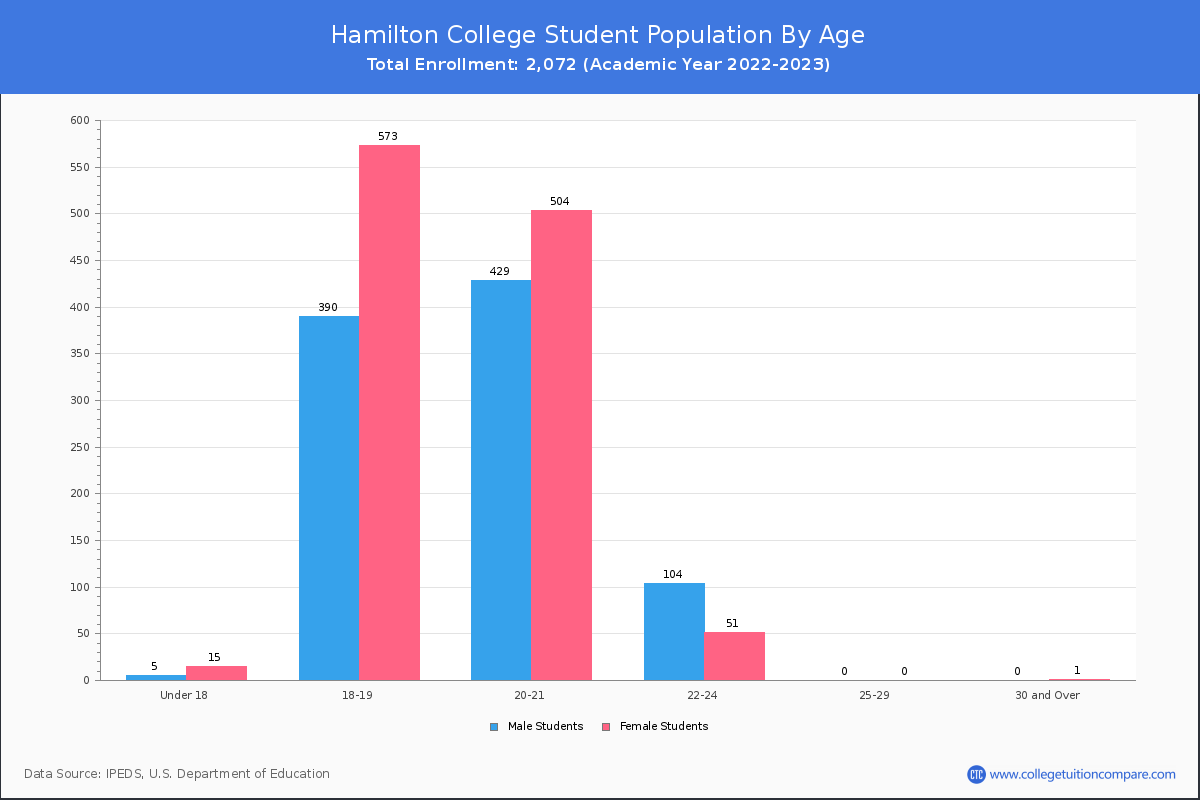

| Age | Total | Men | Women |
|---|---|---|---|
| Under 18 | 20 | 15 | 5 |
| 18-19 | 963 | 573 | 390 |
| 20-21 | 933 | 504 | 429 |
| 22-24 | 155 | 51 | 104 |
Transfer-in Students (Undergraduate)
Among 2,072 enrolled in undergraduate programs, 8 students have transferred-in from other institutions. The percentage of transfer-in students is 0.39%.
| Number of Students | |
|---|---|
| Regular Full-time | 2,062 |
| Transfer-in Full-time | 8 |