Student Population by Gender
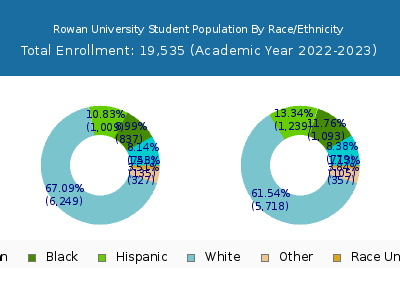
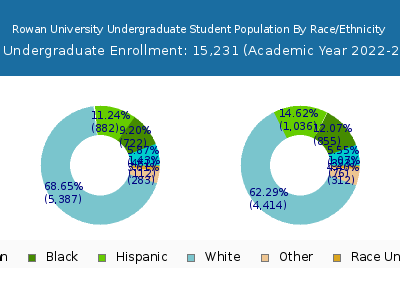
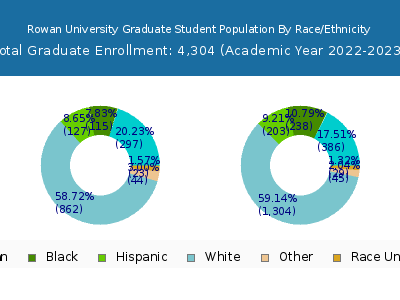
Rowan University has a total of 19,535 enrolled students for the academic year 2022-2023. 15,231 students have enrolled in undergraduate programs and 4,304 students joined graduate programs.
By gender, 9,611 male and 9,924 female students (the male-female ratio is 49:51) are attending the school. The gender distribution is based on the 2022-2023 data.
| Total | Undergraduate | Graduate | |
|---|---|---|---|
| Total | 19,535 | 15,231 | 4,304 |
| Men | 9,611 | 7,820 | 1,791 |
| Women | 9,924 | 7,411 | 2,513 |
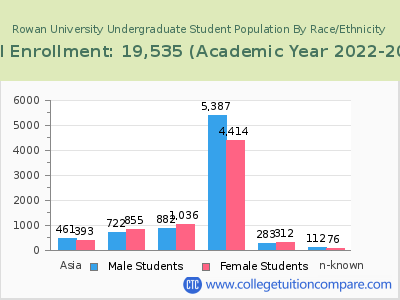
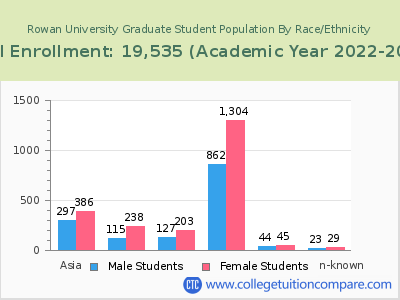
Student Distribution by Race/Ethnicity
| Race | Total | Men | Women |
|---|---|---|---|
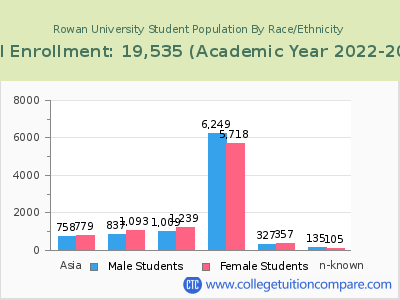
| American Indian or Native American | 22 | 6 | 16 |
| Asian | 1,594 | 777 | 817 |
| Black | 1,981 | 874 | 1,107 |
| Hispanic | 2,342 | 1,005 | 1,337 |
| Native Hawaiian or Other Pacific Islanders | 18 | 8 | 10 |
| White | 11,819 | 6,027 | 5,792 |
| Two or more races | 672 | 313 | 359 |
| Race Unknown | 290 | 134 | 156 |
| Race | Total | Men | Women |
|---|---|---|---|
| American Indian or Native American | 18 | 5 | 13 |
| Asian | 888 | 484 | 404 |
| Black | 1,641 | 755 | 886 |
| Hispanic | 2,033 | 888 | 1,145 |
| Native Hawaiian or Other Pacific Islanders | 13 | 6 | 7 |
| White | 9,602 | 5,186 | 4,416 |
| Two or more races | 559 | 269 | 290 |
| Race Unknown | 245 | 117 | 128 |
| Race | Total | Men | Women |
|---|---|---|---|
| American Indian or Native American | 2 | 0 | 2 |
| Asian | 91 | 47 | 44 |
| Black | 240 | 107 | 133 |
| Hispanic | 253 | 98 | 155 |
| Native Hawaiian or Other Pacific Islanders | 4 | 0 | 4 |
| White | 1,204 | 585 | 619 |
| Two or more races | 79 | 31 | 48 |
| Race Unknown | 13 | 6 | 7 |
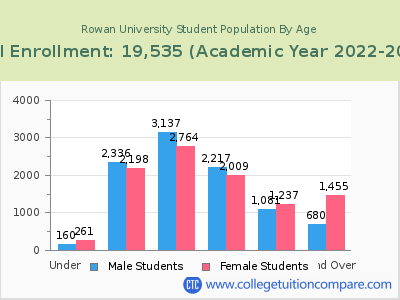
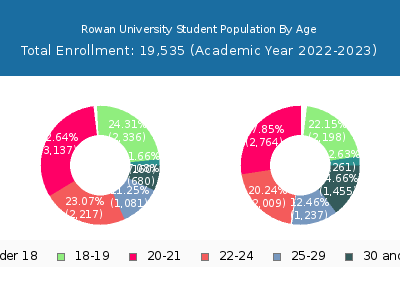
Student Age Distribution
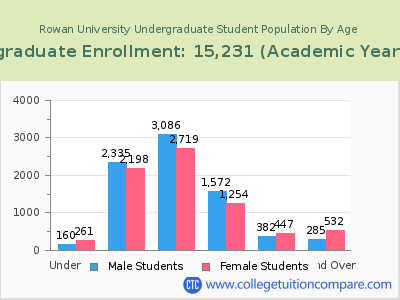
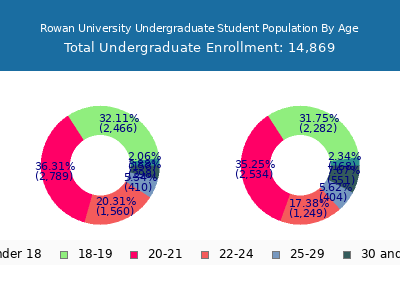
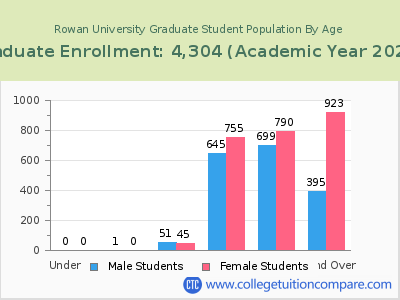
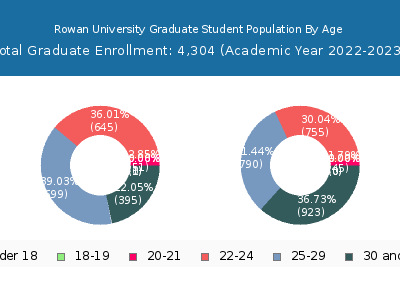
By age, Rowan has 421 students under 18 years old and 28 students over 65 years old. There are 15,082 students under 25 years old, and 4,453 students over 25 years old out of 19,535 total students.
In undergraduate programs, 421 students are younger than 18 and 22 students are older than 65. Rowan has 13,585 undergraduate students aged under 25 and 1,646 students aged 25 and over.
It has 1,497 graduate students aged under 25 and 2,807 students aged 25 and over.
| Age | Total | Men | Women |
|---|---|---|---|
| Under 18 | 421 | 261 | 160 |
| 18-19 | 4,534 | 2,198 | 2,336 |
| 20-21 | 5,901 | 2,764 | 3,137 |
| 22-24 | 4,226 | 2,009 | 2,217 |
| 25-29 | 2,318 | 1,237 | 1,081 |
| 30-34 | 793 | 484 | 309 |
| 35-39 | 460 | 317 | 143 |
| 40-49 | 566 | 427 | 139 |
| 50-64 | 288 | 213 | 75 |
| Over 65 | 28 | 14 | 14 |
| Age | Total | Men | Women |
|---|---|---|---|
| Under 18 | 421 | 261 | 160 |
| 18-19 | 4,533 | 2,198 | 2,335 |
| 20-21 | 5,805 | 2,719 | 3,086 |
| 22-24 | 2,826 | 1,254 | 1,572 |
| 25-29 | 829 | 447 | 382 |
| 30-34 | 305 | 185 | 120 |
| 35-39 | 179 | 115 | 64 |
| 40-49 | 208 | 148 | 60 |
| 50-64 | 103 | 74 | 29 |
| Over 65 | 22 | 10 | 12 |
| Age | Total | Men | Women |
|---|
Online Student Enrollment
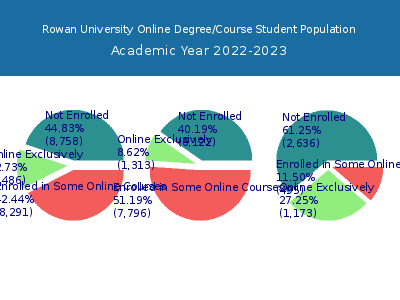
Distance learning, also called online education, is very attractive to students, especially who want to continue education and work in field. At Rowan University, 2,486 students are enrolled exclusively in online courses and 8,291 students are enrolled in some online courses.
2,312 students lived in New Jersey or jurisdiction in which the school is located are enrolled exclusively in online courses and 174 students live in other State or outside of the United States.
| All Students | Enrolled Exclusively Online Courses | Enrolled in Some Online Courses | |
|---|---|---|---|
| All Students | 19,535 | 2,486 | 8,291 |
| Undergraduate | 15,231 | 1,313 | 7,796 |
| Graduate | 4,304 | 1,173 | 495 |
| New Jersey Residents | Other States in U.S. | Outside of U.S. | |
|---|---|---|---|
| All Students | 2,312 | 166 | 8 |
| Undergraduate | 1,222 | 83 | 8 |
| Graduate | 1,090 | 83 | 0 |
Transfer-in Students (Undergraduate)
Among 15,231 enrolled in undergraduate programs, 1,915 students have transferred-in from other institutions. The percentage of transfer-in students is 12.57%.1,727 students have transferred in as full-time status and 188 students transferred in as part-time status.
| Number of Students | |
|---|---|
| Regular Full-time | 11,480 |
| Transfer-in Full-time | 1,727 |
| Regular Part-time | 1,836 |
| Transfer-in Part-time | 188 |
