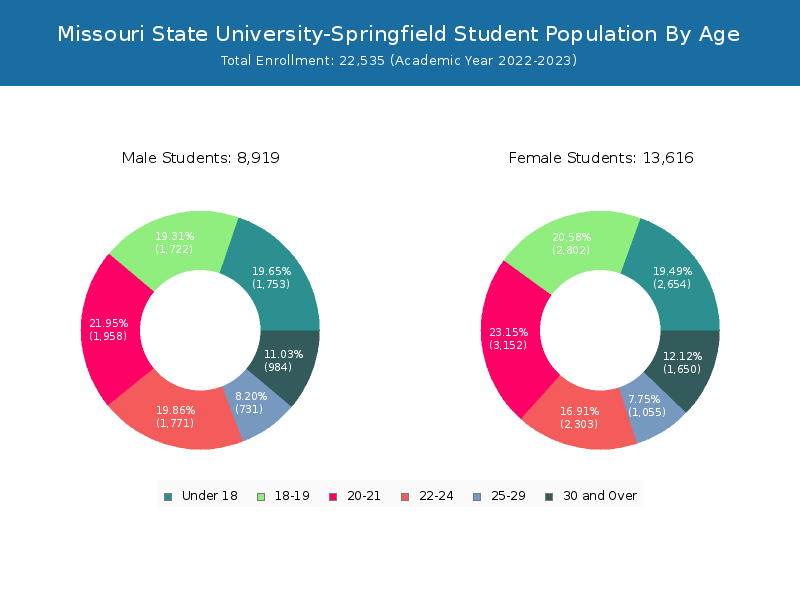
Student Population by Gender
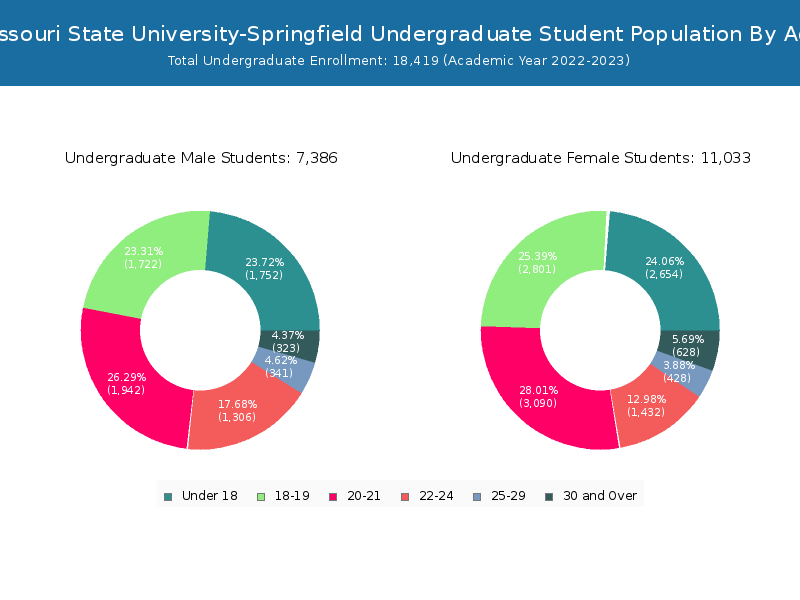
Missouri State University-Springfield has a total of 22,535 enrolled students for the academic year 2022-2023. 18,419 students have enrolled in undergraduate programs and 4,116 students joined graduate programs.
By gender, 8,919 male and 13,616 female students (the male-female ratio is 40:60) are attending the school. The gender distribution is based on the 2022-2023 data.
| Total | Undergraduate | Graduate | |
|---|---|---|---|
| Total | 22,535 | 18,419 | 4,116 |
| Men | 8,919 | 7,386 | 1,533 |
| Women | 13,616 | 11,033 | 2,583 |
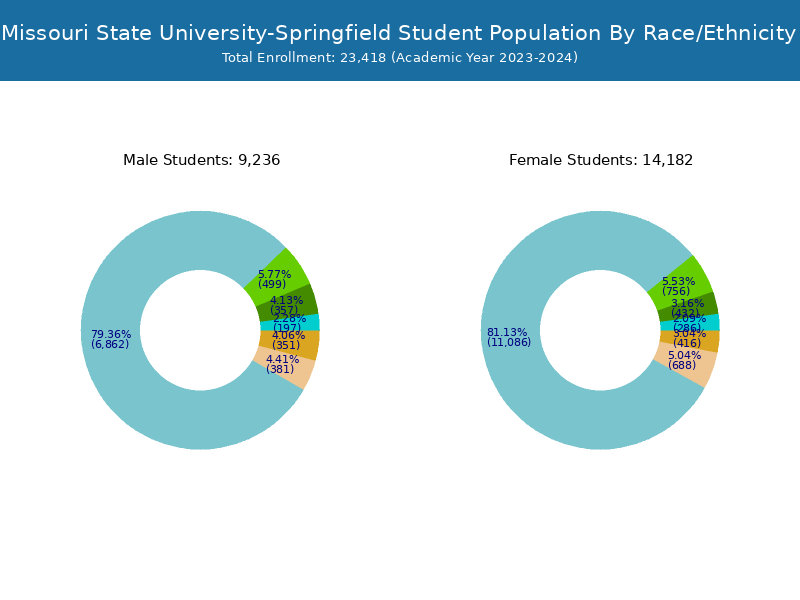
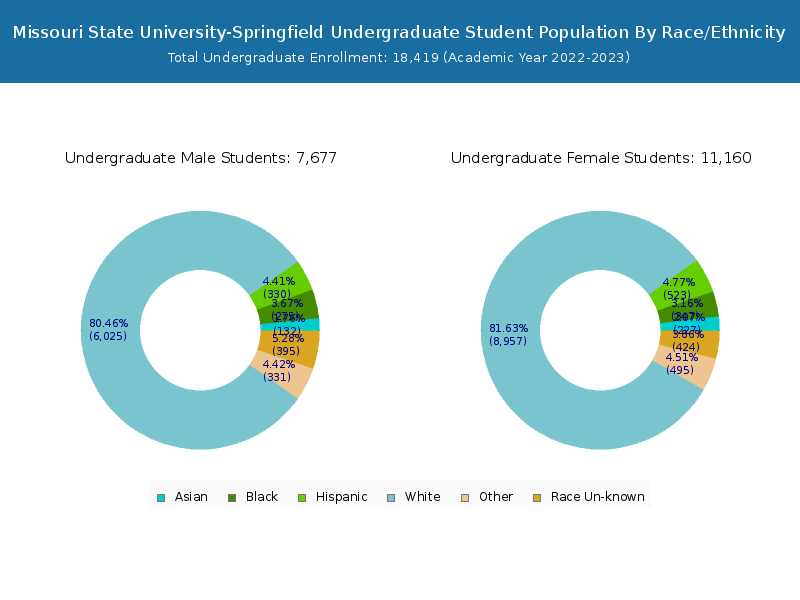
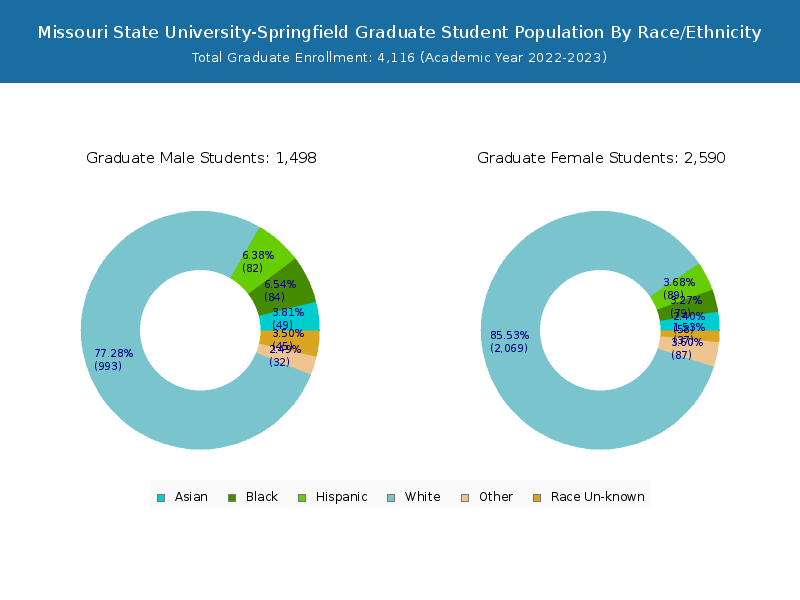
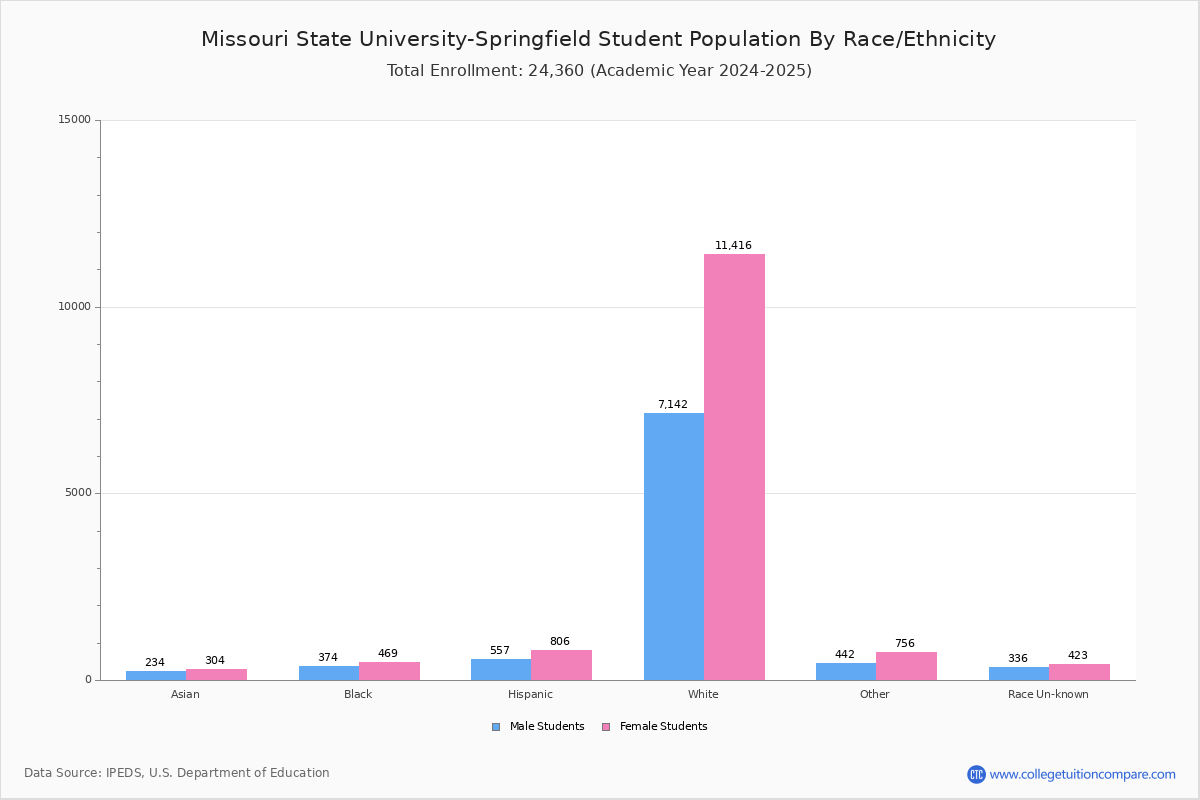
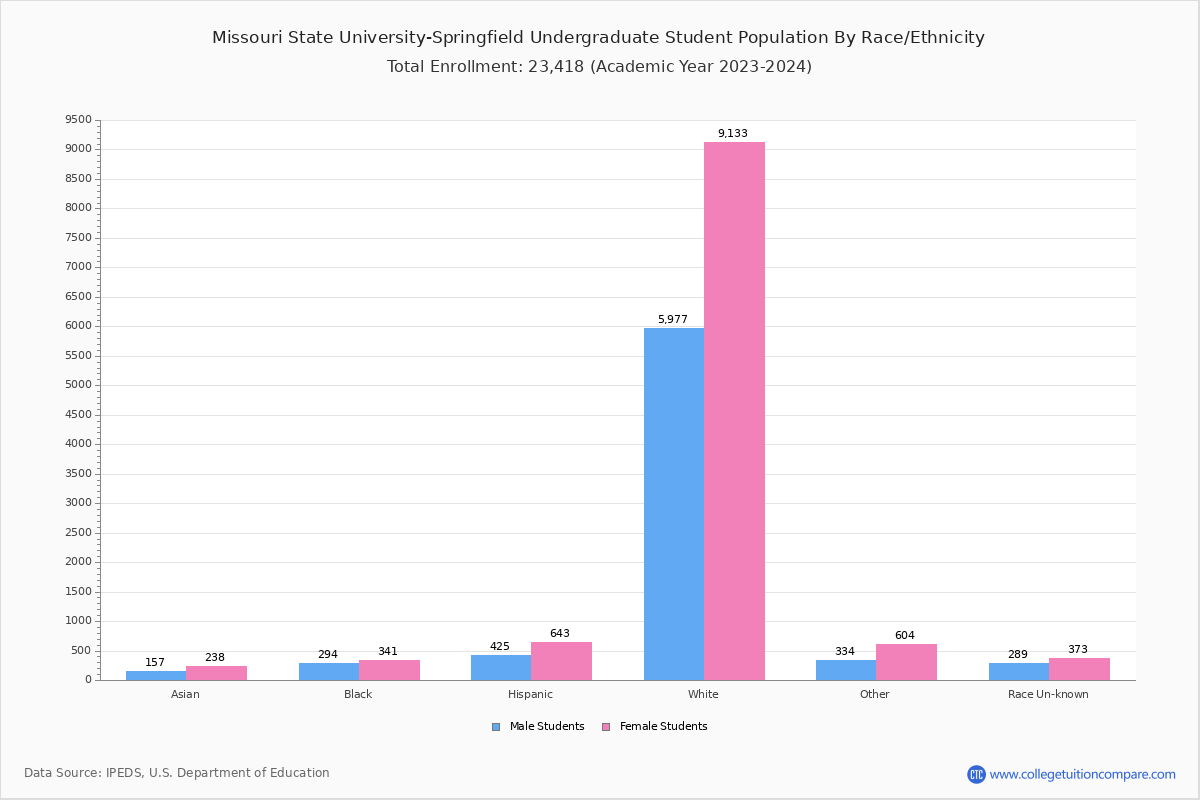
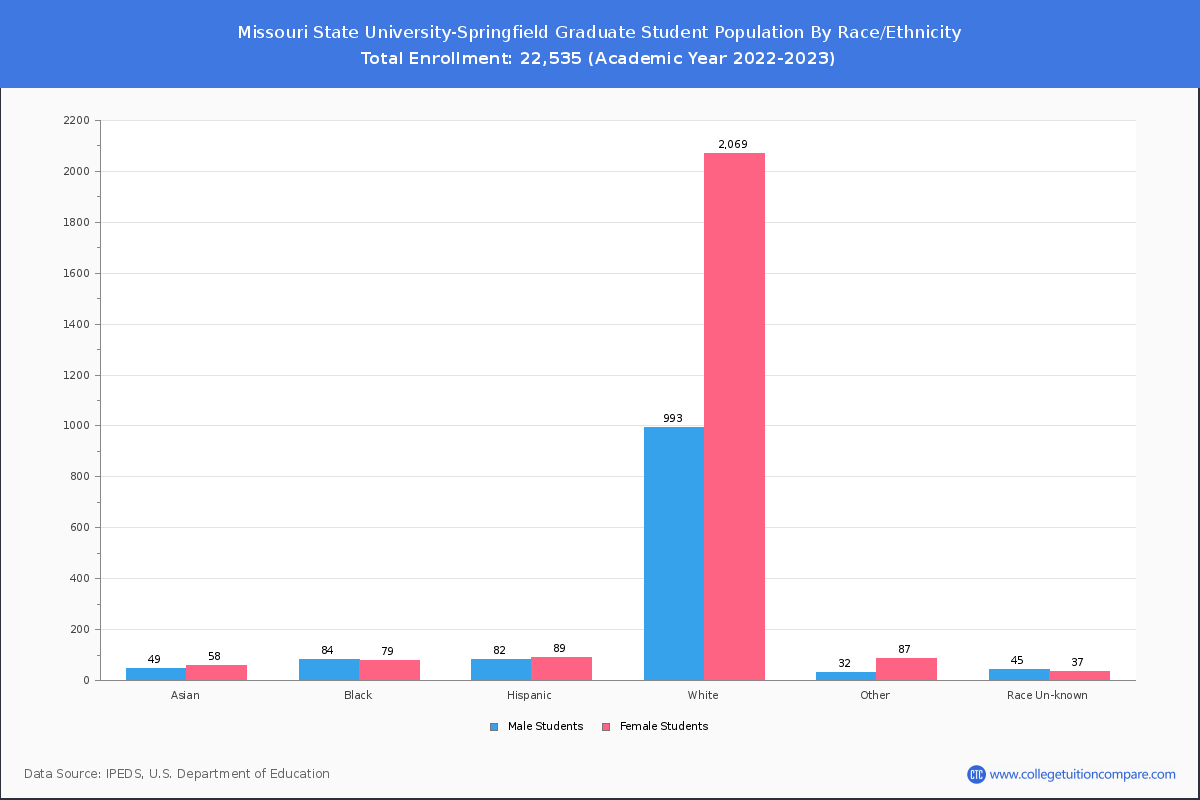
Student Distribution by Race/Ethnicity
By race/ethnicity, 17,415 White, 729 Black, and 499 Asian students out of a total of 22,535 are attending at Missouri State University-Springfield. Comprehensive enrollment statistic data by race/ethnicity is shown in the next chart (Academic year 2022-2023 data).
| Race | Total | Men | Women |
|---|---|---|---|
| American Indian or Native American | 72 | 24 | 48 |
| Asian | 499 | 208 | 291 |
| Black | 729 | 344 | 385 |
| Hispanic | 1,087 | 416 | 671 |
| Native Hawaiian or Other Pacific Islanders | 27 | 14 | 13 |
| White | 17,415 | 6,654 | 10,761 |
| Two or more races | 821 | 296 | 525 |
| Race Unknown | 905 | 409 | 496 |
| Race | Total | Men | Women |
|---|---|---|---|
| American Indian or Native American | 57 | 22 | 35 |
| Asian | 395 | 163 | 232 |
| Black | 572 | 265 | 307 |
| Hispanic | 925 | 346 | 579 |
| Native Hawaiian or Other Pacific Islanders | 23 | 11 | 12 |
| White | 14,500 | 5,738 | 8,762 |
| Two or more races | 715 | 263 | 452 |
| Race Unknown | 804 | 351 | 453 |
| Race | Total | Men | Women |
|---|---|---|---|
| American Indian or Native American | 9 | 4 | 5 |
| Asian | 21 | 13 | 8 |
| Black | 51 | 29 | 22 |
| Hispanic | 63 | 24 | 39 |
| Native Hawaiian or Other Pacific Islanders | 4 | 3 | 1 |
| White | 1,043 | 383 | 660 |
| Two or more races | 54 | 19 | 35 |
| Race Unknown | 5 | 4 | 1 |
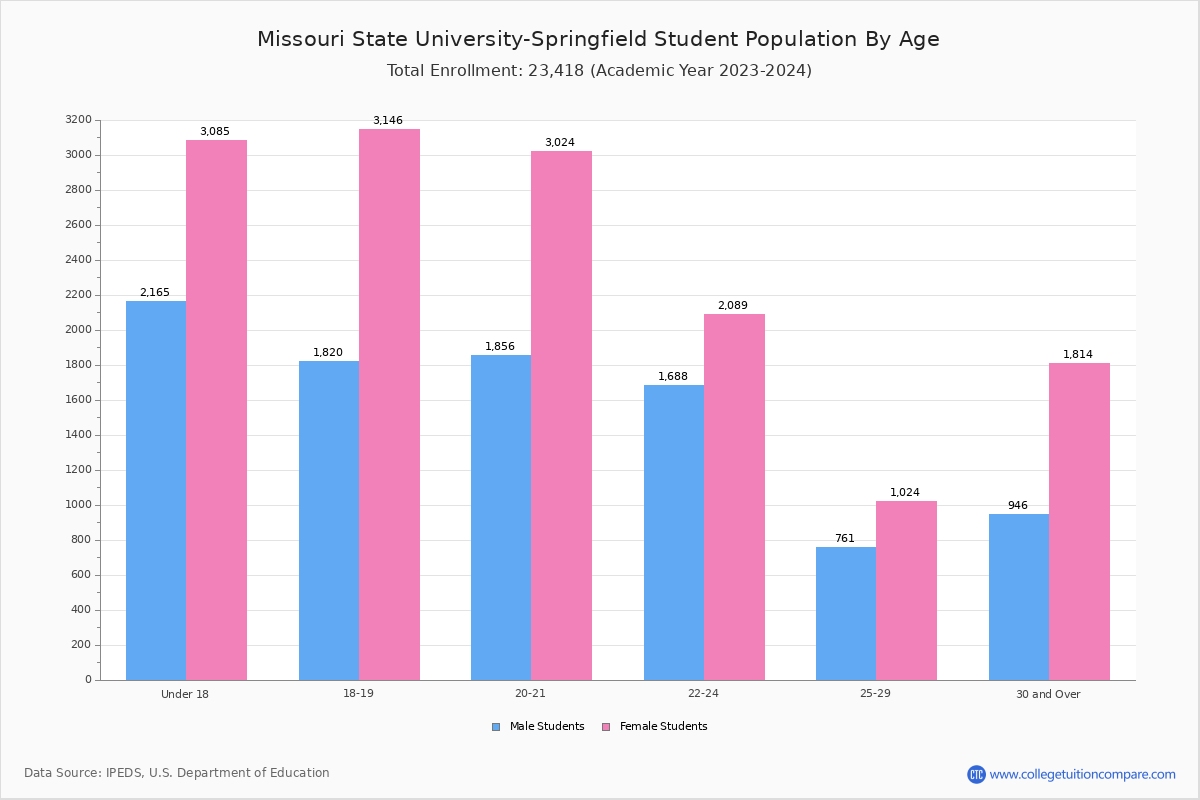
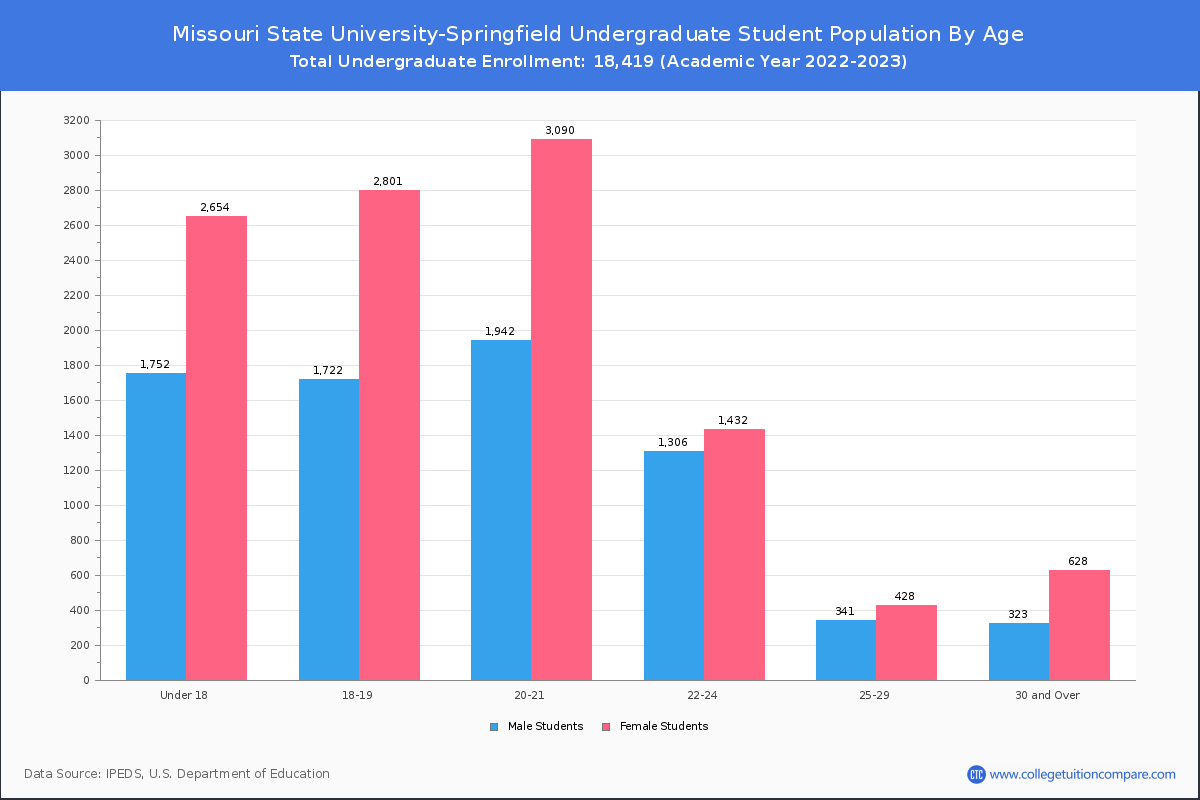
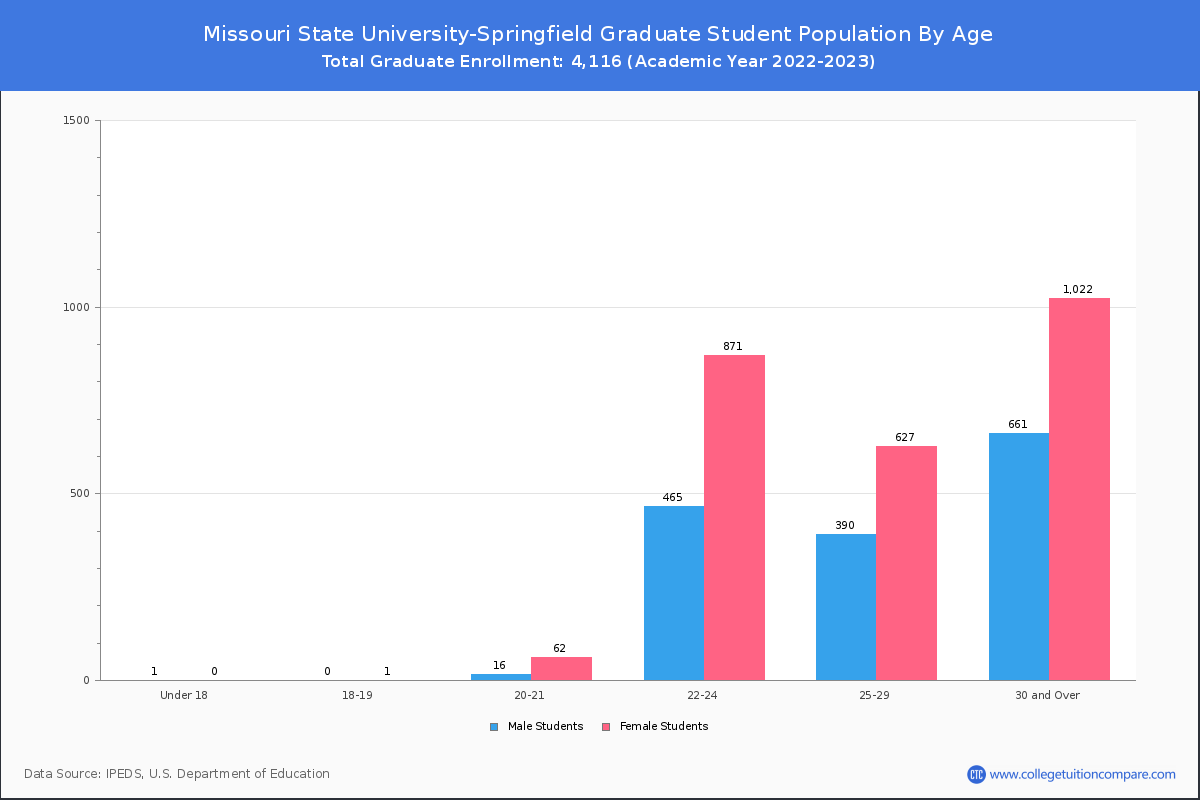
Student Age Distribution
By age, Missouri State University-Springfield has 4,407 students under 18 years old and 32 students over 65 years old. There are 18,115 students under 25 years old, and 4,420 students over 25 years old out of 22,535 total students.
In undergraduate programs, 4,406 students are younger than 18 and 7 students are older than 65. Missouri State University-Springfield has 16,699 undergraduate students aged under 25 and 1,720 students aged 25 and over.
In graduate schools at Missouri State University-Springfield, 1 students are younger than 18 and 25 students are older than 65. It has 1,416 graduate students aged under 25 and 2,700 students aged 25 and over.

| Age | Total | Men | Women |
|---|---|---|---|
| Under 18 | 4,407 | 2,654 | 1,753 |
| 18-19 | 4,524 | 2,802 | 1,722 |
| 20-21 | 5,110 | 3,152 | 1,958 |
| 22-24 | 4,074 | 2,303 | 1,771 |
| 25-29 | 1,786 | 1,055 | 731 |
| 30-34 | 925 | 561 | 364 |
| 35-39 | 622 | 400 | 222 |
| 40-49 | 774 | 504 | 270 |
| 50-64 | 281 | 171 | 110 |
| Over 65 | 32 | 14 | 18 |
| Age | Total | Men | Women |
|---|---|---|---|
| Under 18 | 4,406 | 2,654 | 1,752 |
| 18-19 | 4,523 | 2,801 | 1,722 |
| 20-21 | 5,032 | 3,090 | 1,942 |
| 22-24 | 2,738 | 1,432 | 1,306 |
| 25-29 | 769 | 428 | 341 |
| 30-34 | 371 | 229 | 142 |
| 35-39 | 230 | 160 | 70 |
| 40-49 | 259 | 180 | 79 |
| 50-64 | 84 | 55 | 29 |
| Over 65 | 7 | 4 | 3 |
| Age | Total | Men | Women |
|---|---|---|---|
| Under 18 | 1 | 0 | 1 |
| 18-19 | 1 | 1 | 0 |
| 20-21 | 78 | 62 | 16 |
| 22-24 | 1,336 | 871 | 465 |
| 25-29 | 1,017 | 627 | 390 |
| 30-34 | 554 | 332 | 222 |
| 35-39 | 392 | 240 | 152 |
| 40-49 | 515 | 324 | 191 |
| 50-64 | 197 | 116 | 81 |
| Over 65 | 25 | 10 | 15 |
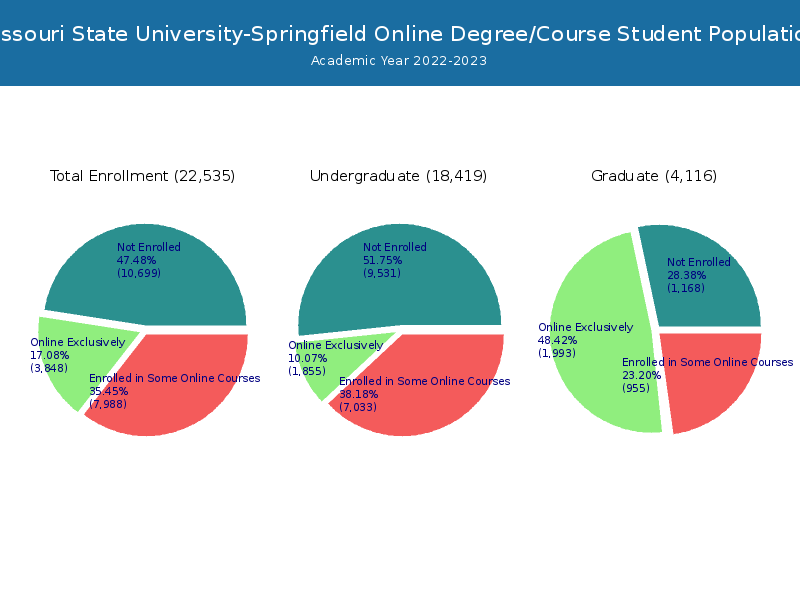
Online Student Enrollment
Distance learning, also called online education, is very attractive to students, especially who want to continue education and work in field. At Missouri State University-Springfield, 3,848 students are enrolled exclusively in online courses and 7,988 students are enrolled in some online courses.
2,736 students lived in Missouri or jurisdiction in which the school is located are enrolled exclusively in online courses and 1,112 students live in other State or outside of the United States.
| All Students | Enrolled Exclusively Online Courses | Enrolled in Some Online Courses | |
|---|---|---|---|
| All Students | 22,535 | 3,848 | 7,988 |
| Undergraduate | 18,419 | 1,855 | 7,033 |
| Graduate | 4,116 | 1,993 | 955 |
| Missouri Residents | Other States in U.S. | Outside of U.S. | |
|---|---|---|---|
| All Students | 2,736 | 857 | 255 |
| Undergraduate | 1,511 | 170 | 174 |
| Graduate | 1,225 | 687 | 81 |
Transfer-in Students (Undergraduate)
Among 18,419 enrolled in undergraduate programs, 1,289 students have transferred-in from other institutions. The percentage of transfer-in students is 7.00%.1,083 students have transferred in as full-time status and 206 students transferred in as part-time status.
| Number of Students | |
|---|---|
| Regular Full-time | 10,258 |
| Transfer-in Full-time | 1,083 |
| Regular Part-time | 6,872 |
| Transfer-in Part-time | 206 |