Student Population by Gender
Southwest Baptist University has a total of 2,386 enrolled students for the academic year 2022-2023. 1,836 students have enrolled in undergraduate programs and 550 students joined graduate programs.
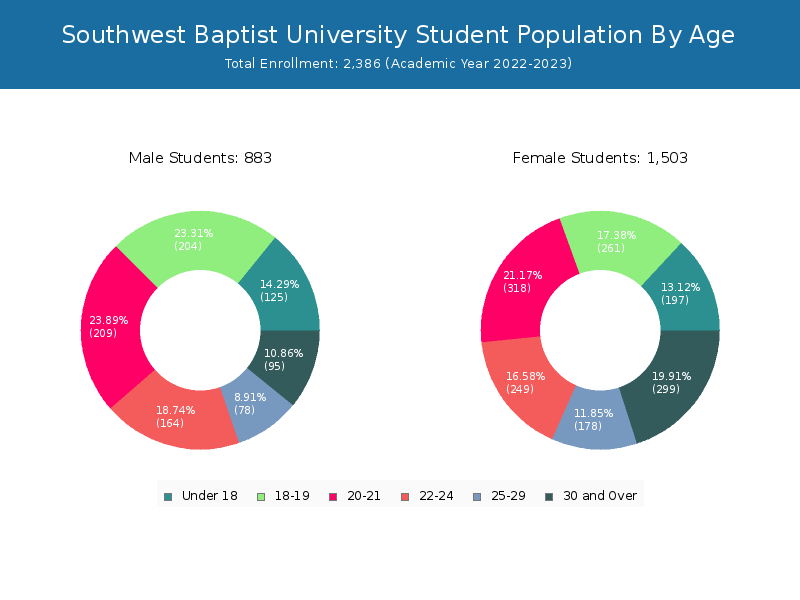
By gender, 883 male and 1,503 female students (the male-female ratio is 37:63) are attending the school. The gender distribution is based on the 2022-2023 data.
| Total | Undergraduate | Graduate | |
|---|---|---|---|
| Total | 2,386 | 1,836 | 550 |
| Men | 883 | 696 | 187 |
| Women | 1,503 | 1,140 | 363 |
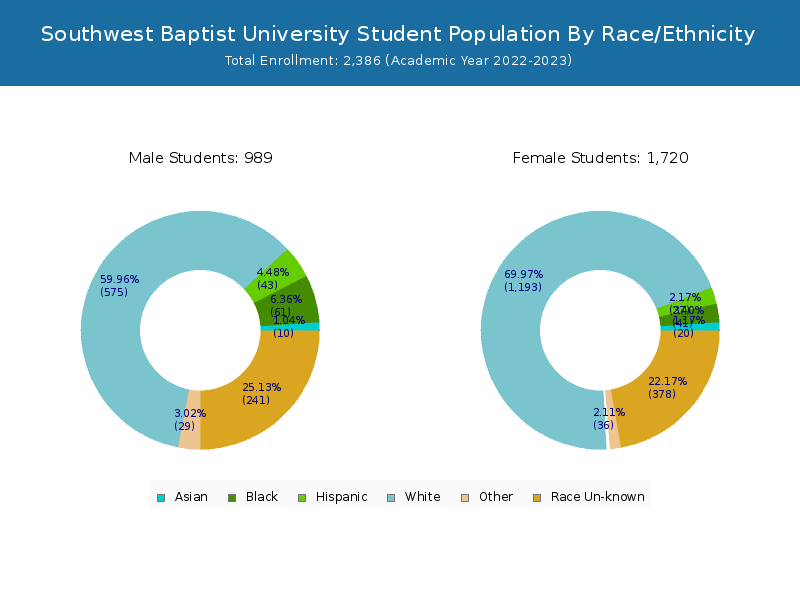
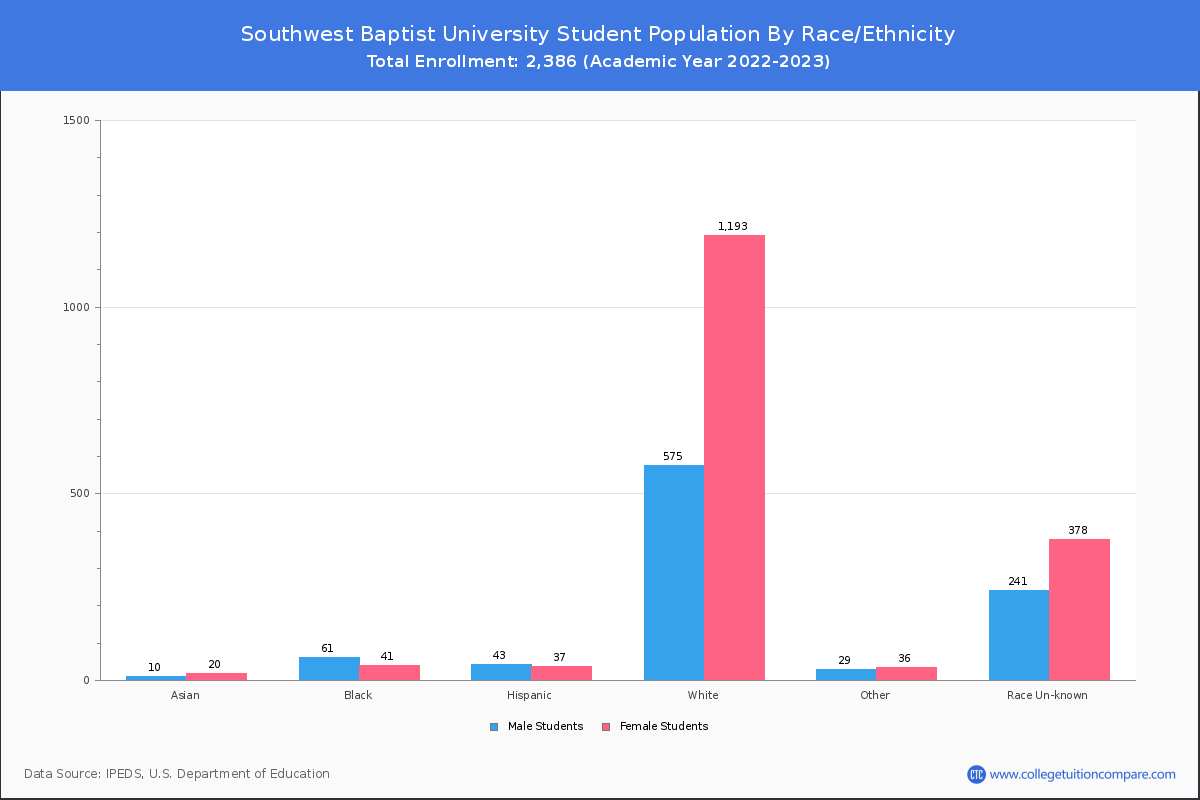
Student Distribution by Race/Ethnicity
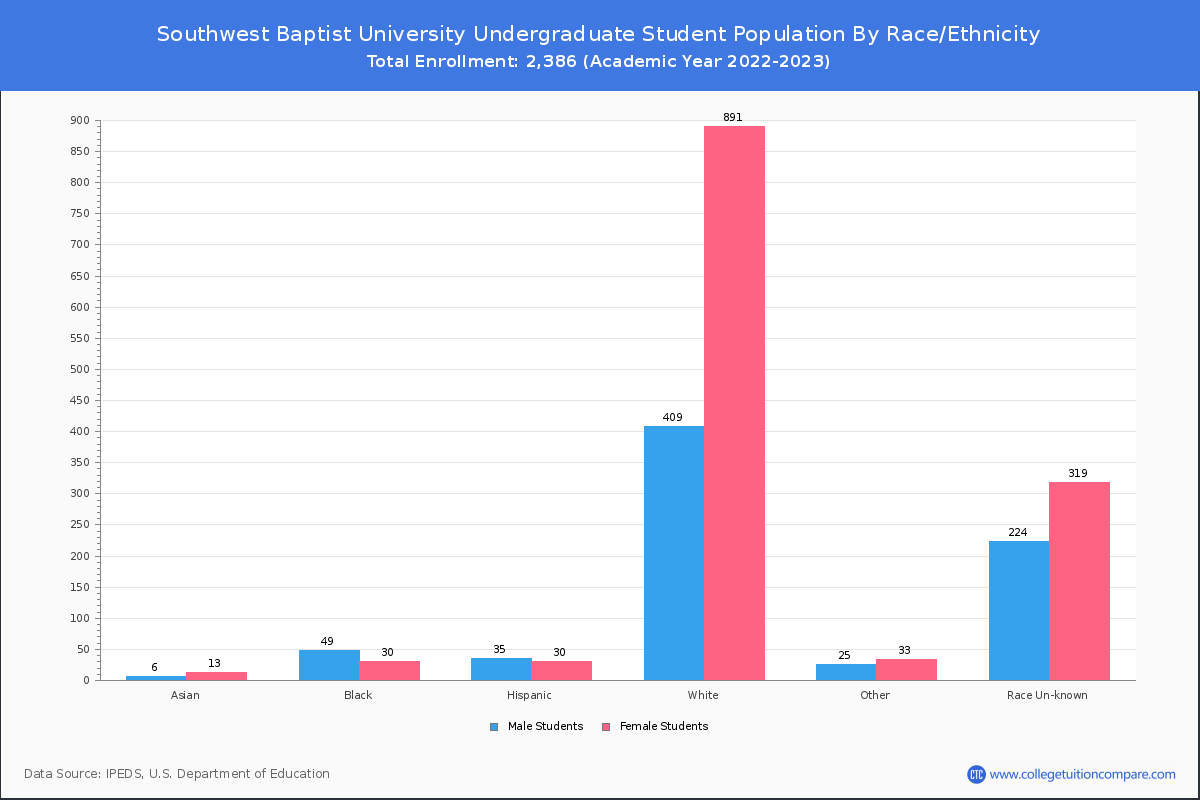
By race/ethnicity, 1,670 White, 99 Black, and 28 Asian students out of a total of 2,386 are attending at Southwest Baptist University. Comprehensive enrollment statistic data by race/ethnicity is shown in the next chart (Academic year 2022-2023 data).
| Race | Total | Men | Women |
|---|---|---|---|
| American Indian or Native American | 14 | 1 | 13 |
| Asian | 28 | 7 | 21 |
| Black | 99 | 59 | 40 |
| Hispanic | 76 | 41 | 35 |
| Native Hawaiian or Other Pacific Islanders | 4 | 3 | 1 |
| White | 1,670 | 576 | 1,094 |
| Two or more races | 44 | 21 | 23 |
| Race Unknown | 415 | 150 | 265 |
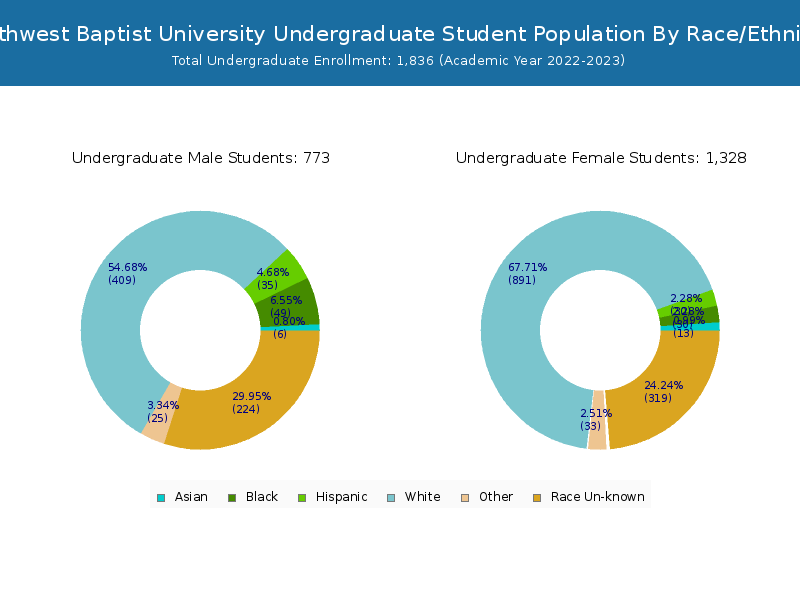
| Race | Total | Men | Women |
|---|---|---|---|
| American Indian or Native American | 10 | 0 | 10 |
| Asian | 20 | 5 | 15 |
| Black | 79 | 50 | 29 |
| Hispanic | 60 | 32 | 28 |
| Native Hawaiian or Other Pacific Islanders | 3 | 2 | 1 |
| White | 1,246 | 441 | 805 |
| Two or more races | 42 | 19 | 23 |
| Race Unknown | 344 | 126 | 218 |
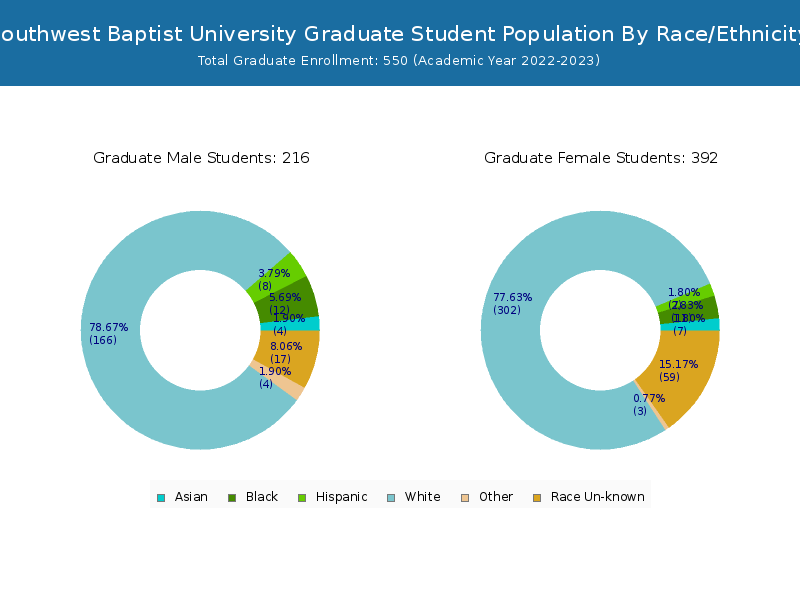
| Race | Total | Men | Women |
|---|---|---|---|
| American Indian or Native American | 3 | 0 | 3 |
| Asian | 4 | 0 | 4 |
| Black | 15 | 10 | 5 |
| Hispanic | 12 | 5 | 7 |
| Native Hawaiian or Other Pacific Islanders | 0 | 0 | 0 |
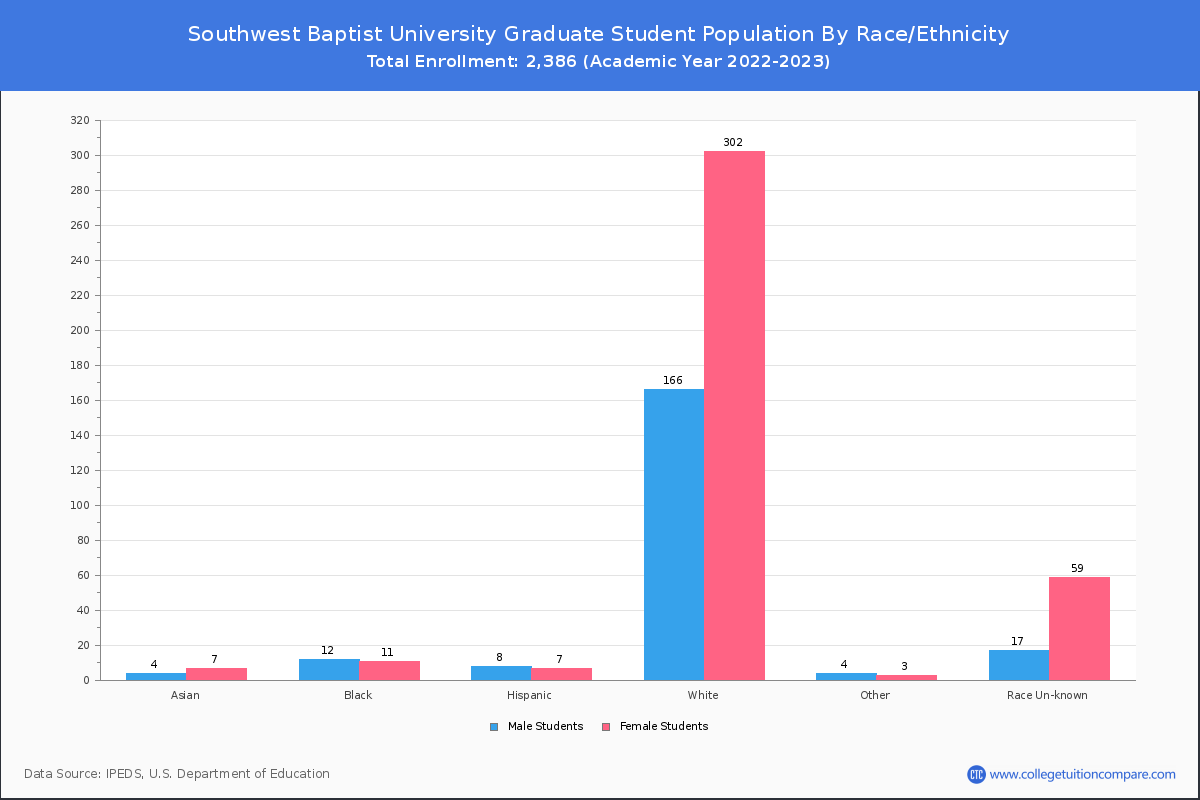
| White | 131 | 39 | 92 |
| Two or more races | 6 | 3 | 3 |
| Race Unknown | 7 | 4 | 3 |
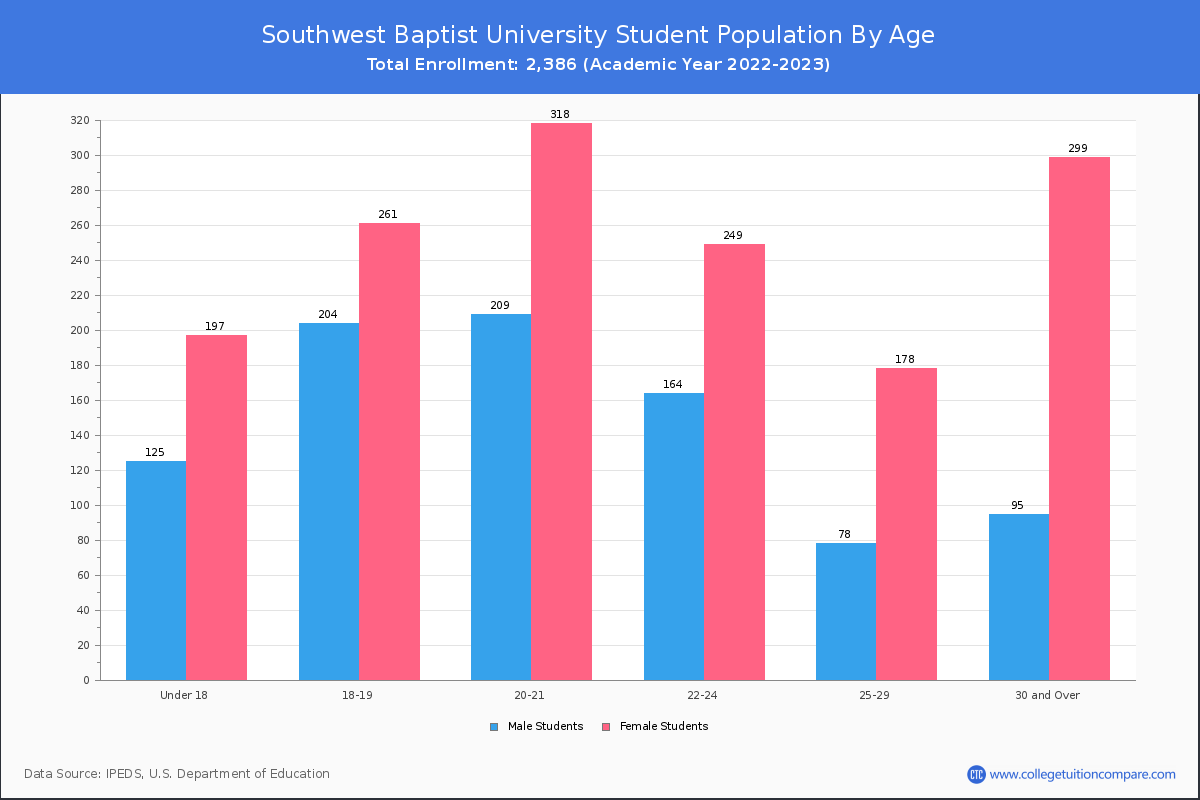
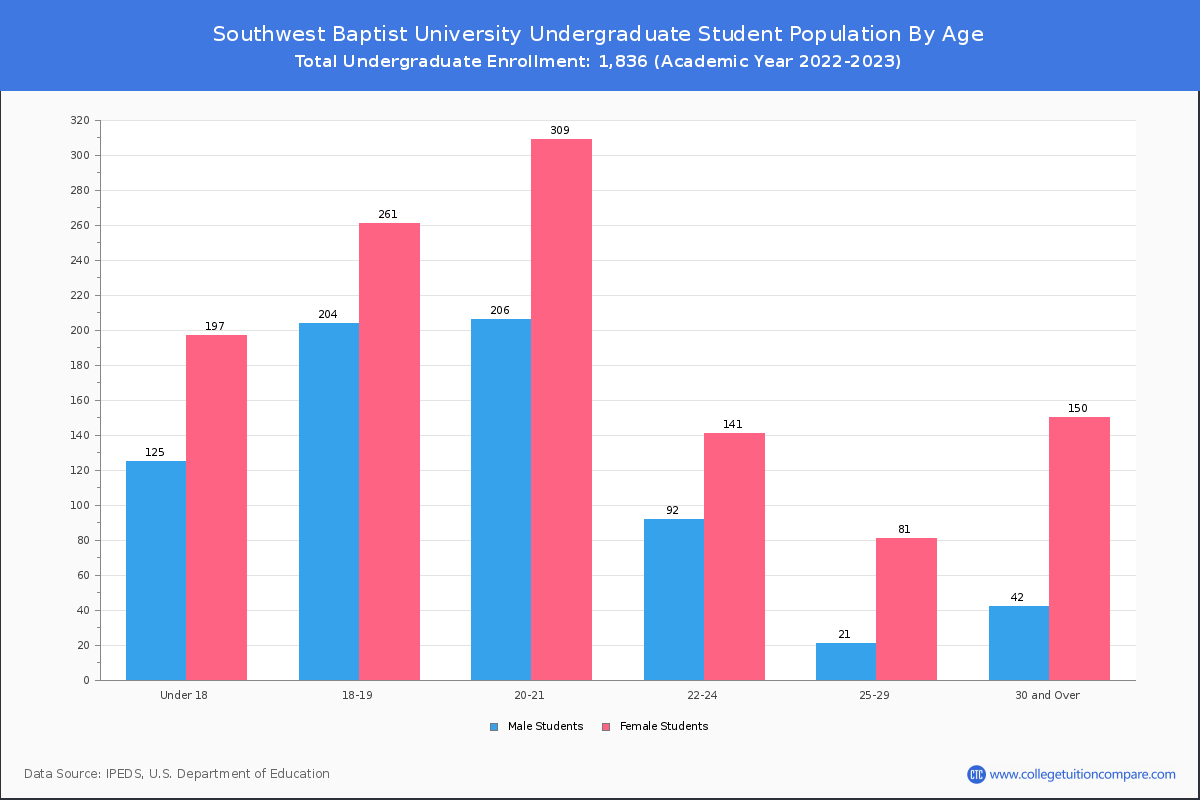
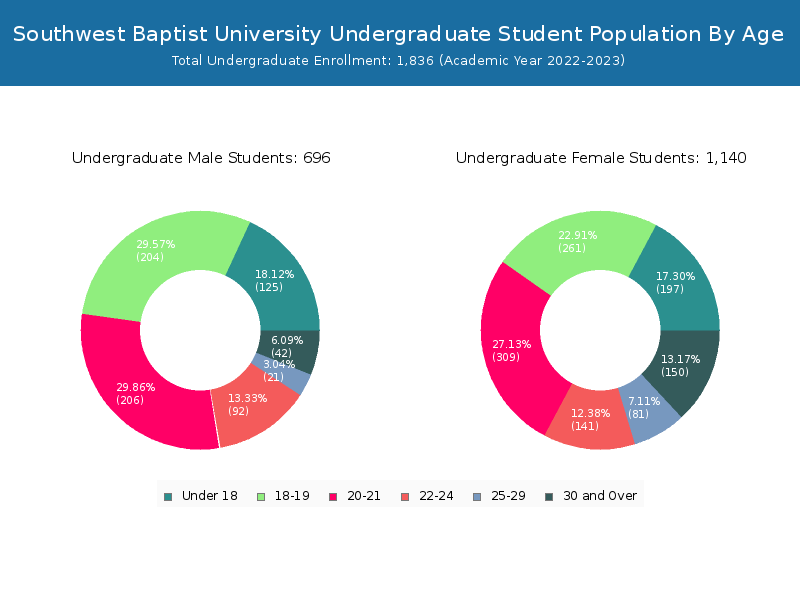
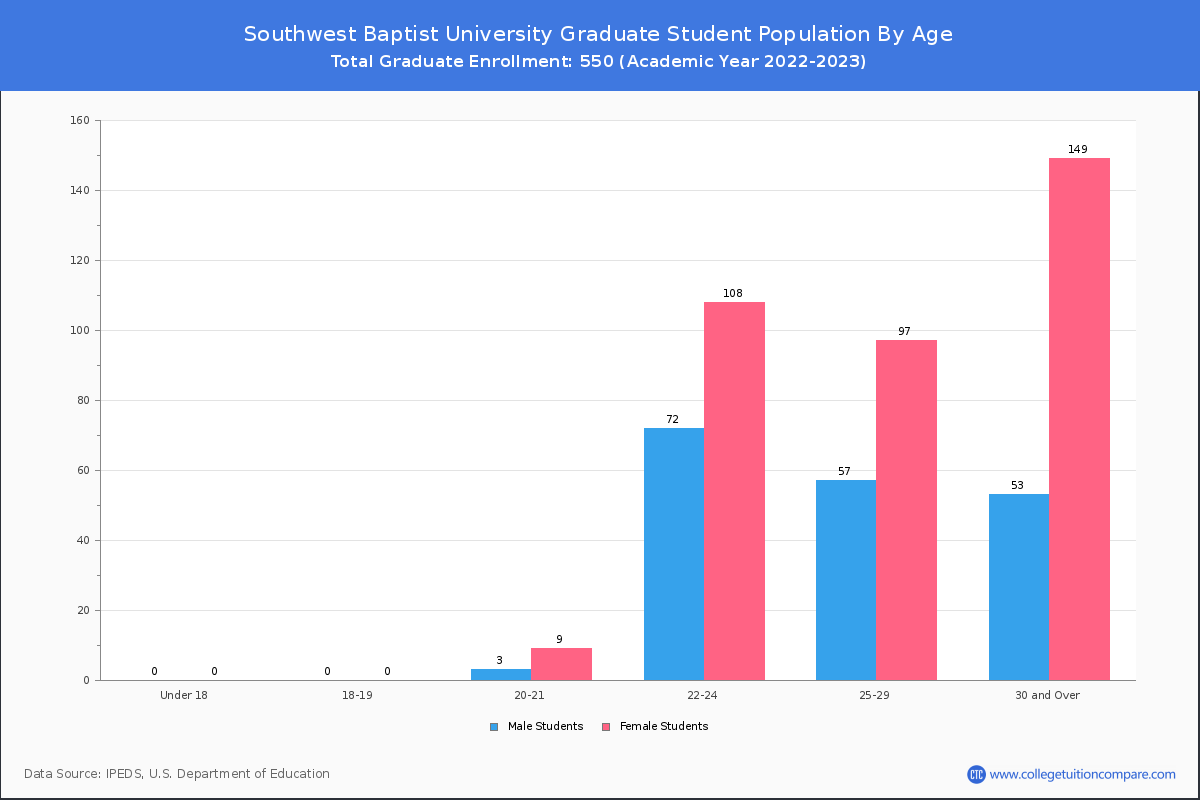
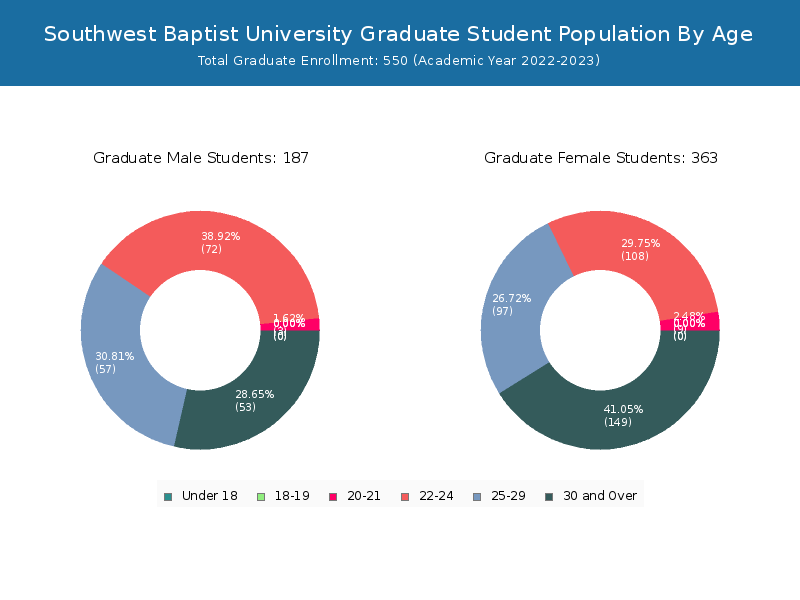
Student Age Distribution
By age, Southwest Baptist has 322 students under 18 years old and 2 students over 65 years old. There are 1,727 students under 25 years old, and 650 students over 25 years old out of 2,386 total students.
In undergraduate programs, 322 students are younger than 18 and 1 students are older than 65. Southwest Baptist has 1,535 undergraduate students aged under 25 and 294 students aged 25 and over.
It has 192 graduate students aged under 25 and 356 students aged 25 and over.
| Age | Total | Men | Women |
|---|---|---|---|
| Under 18 | 322 | 197 | 125 |
| 18-19 | 465 | 261 | 204 |
| 20-21 | 527 | 318 | 209 |
| 22-24 | 413 | 249 | 164 |
| 25-29 | 256 | 178 | 78 |
| 30-34 | 134 | 103 | 31 |
| 35-39 | 103 | 77 | 26 |
| 40-49 | 124 | 95 | 29 |
| 50-64 | 31 | 23 | 8 |
| Over 65 | 2 | 1 | 1 |
| Age | Total | Men | Women |
|---|---|---|---|
| Under 18 | 322 | 197 | 125 |
| 18-19 | 465 | 261 | 204 |
| 20-21 | 515 | 309 | 206 |
| 22-24 | 233 | 141 | 92 |
| 25-29 | 102 | 81 | 21 |
| 30-34 | 75 | 64 | 11 |
| 35-39 | 50 | 34 | 16 |
| 40-49 | 48 | 39 | 9 |
| 50-64 | 18 | 13 | 5 |
| Over 65 | 1 | 0 | 1 |
| Age | Total | Men | Women |
|---|
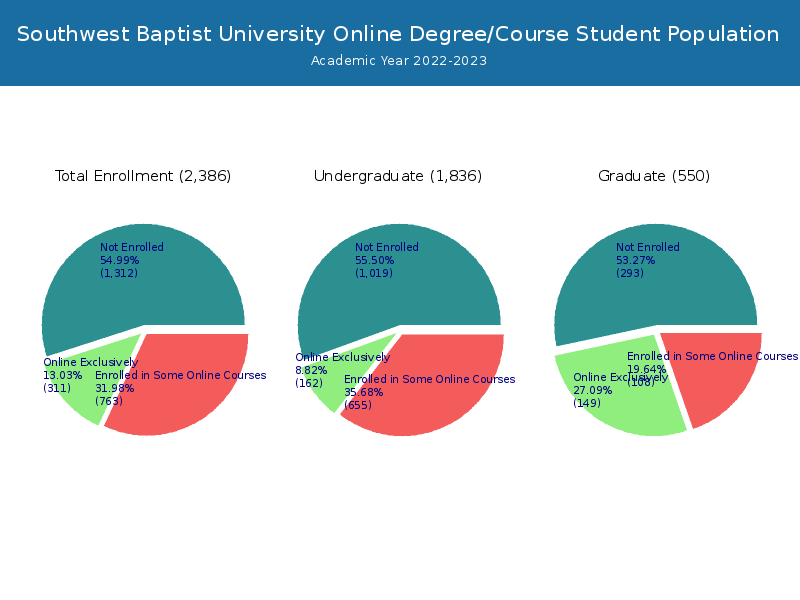
Online Student Enrollment
Distance learning, also called online education, is very attractive to students, especially who want to continue education and work in field. At Southwest Baptist University, 311 students are enrolled exclusively in online courses and 763 students are enrolled in some online courses.
120 students lived in Missouri or jurisdiction in which the school is located are enrolled exclusively in online courses and 191 students live in other State or outside of the United States.
| All Students | Enrolled Exclusively Online Courses | Enrolled in Some Online Courses | |
|---|---|---|---|
| All Students | 2,386 | 311 | 763 |
| Undergraduate | 1,836 | 162 | 655 |
| Graduate | 550 | 149 | 108 |
| Missouri Residents | Other States in U.S. | Outside of U.S. | |
|---|---|---|---|
| All Students | 120 | 191 | 0 |
| Undergraduate | 86 | 76 | 0 |
| Graduate | 34 | 115 | 0 |
Transfer-in Students (Undergraduate)
Among 1,836 enrolled in undergraduate programs, 178 students have transferred-in from other institutions. The percentage of transfer-in students is 9.69%.122 students have transferred in as full-time status and 56 students transferred in as part-time status.
| Number of Students | |
|---|---|
| Regular Full-time | 1,087 |
| Transfer-in Full-time | 122 |
| Regular Part-time | 571 |
| Transfer-in Part-time | 56 |