Student Population by Gender
Cox College has a total of 852 enrolled students for the academic year 2022-2023. 677 students have enrolled in undergraduate programs and 175 students joined graduate programs.
By gender, 109 male and 743 female students (the male-female ratio is 13:87) are attending the school. The gender distribution is based on the 2022-2023 data.
| Total | Undergraduate | Graduate | |
|---|---|---|---|
| Total | 852 | 677 | 175 |
| Men | 109 | 87 | 22 |
| Women | 743 | 590 | 153 |
Student Distribution by Race/Ethnicity
| Race | Total | Men | Women |
|---|---|---|---|
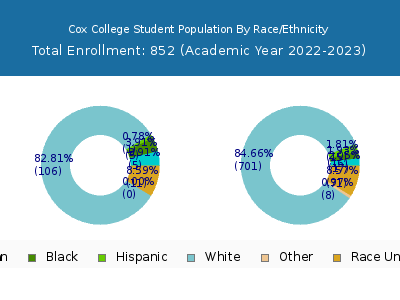
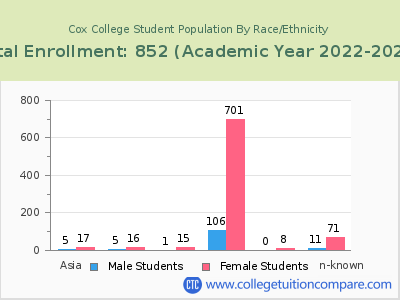
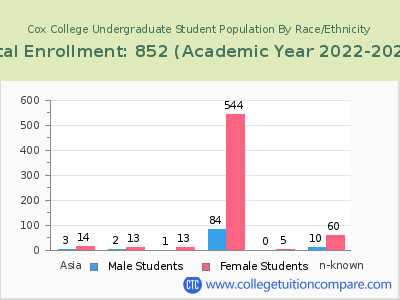
| American Indian or Native American | 6 | 0 | 6 |
| Asian | 15 | 2 | 13 |
| Black | 16 | 0 | 16 |
| Hispanic | 36 | 8 | 28 |
| Native Hawaiian or Other Pacific Islanders | 1 | 0 | 1 |
| White | 716 | 86 | 630 |
| Two or more races | 37 | 6 | 31 |
| Race Unknown | 25 | 7 | 18 |
| Race | Total | Men | Women |
|---|---|---|---|
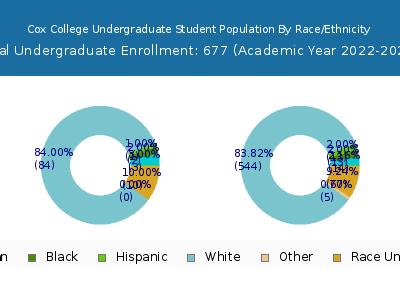
| American Indian or Native American | 5 | 0 | 5 |
| Asian | 12 | 2 | 10 |
| Black | 8 | 0 | 8 |
| Hispanic | 32 | 7 | 25 |
| Native Hawaiian or Other Pacific Islanders | 0 | 0 | 0 |
| White | 569 | 67 | 502 |
| Two or more races | 29 | 5 | 24 |
| Race Unknown | 22 | 6 | 16 |
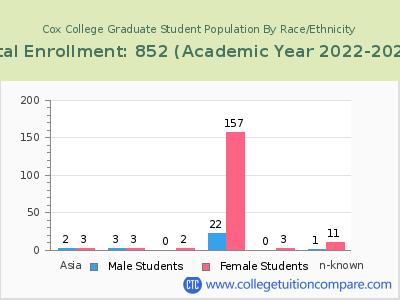
| Race | Total | Men | Women |
|---|---|---|---|
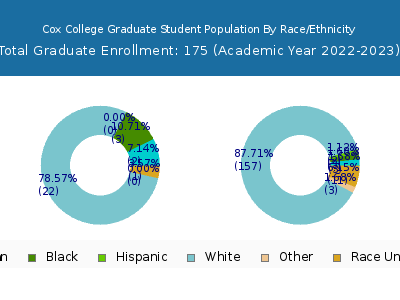
| American Indian or Native American | 1 | 0 | 1 |
| Asian | 0 | 0 | 0 |
| Black | 4 | 0 | 4 |
| Hispanic | 10 | 4 | 6 |
| Native Hawaiian or Other Pacific Islanders | 0 | 0 | 0 |
| White | 140 | 17 | 123 |
| Two or more races | 10 | 2 | 8 |
| Race Unknown | 3 | 1 | 2 |
Online Student Enrollment
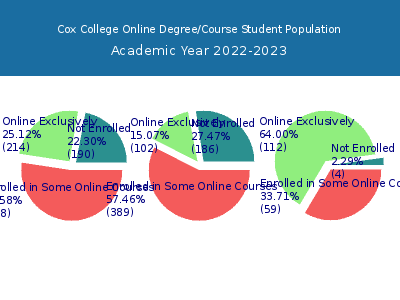
Distance learning, also called online education, is very attractive to students, especially who want to continue education and work in field. At Cox College, 214 students are enrolled exclusively in online courses and 448 students are enrolled in some online courses.
187 students lived in Missouri or jurisdiction in which the school is located are enrolled exclusively in online courses and 27 students live in other State or outside of the United States.
| All Students | Enrolled Exclusively Online Courses | Enrolled in Some Online Courses | |
|---|---|---|---|
| All Students | 852 | 214 | 448 |
| Undergraduate | 677 | 102 | 389 |
| Graduate | 175 | 112 | 59 |
| Missouri Residents | Other States in U.S. | Outside of U.S. | |
|---|---|---|---|
| All Students | 187 | 27 | 0 |
| Undergraduate | 99 | 3 | 0 |
| Graduate | 88 | 24 | 0 |
Transfer-in Students (Undergraduate)
Among 677 enrolled in undergraduate programs, 168 students have transferred-in from other institutions. The percentage of transfer-in students is 24.82%.105 students have transferred in as full-time status and 63 students transferred in as part-time status.
| Number of Students | |
|---|---|
| Regular Full-time | 244 |
| Transfer-in Full-time | 105 |
| Regular Part-time | 265 |
| Transfer-in Part-time | 63 |
