Student Population by Gender
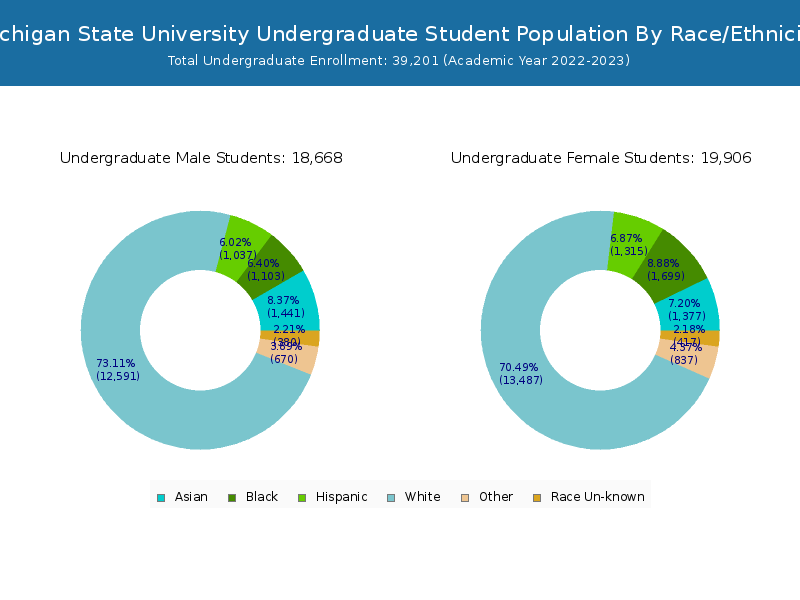
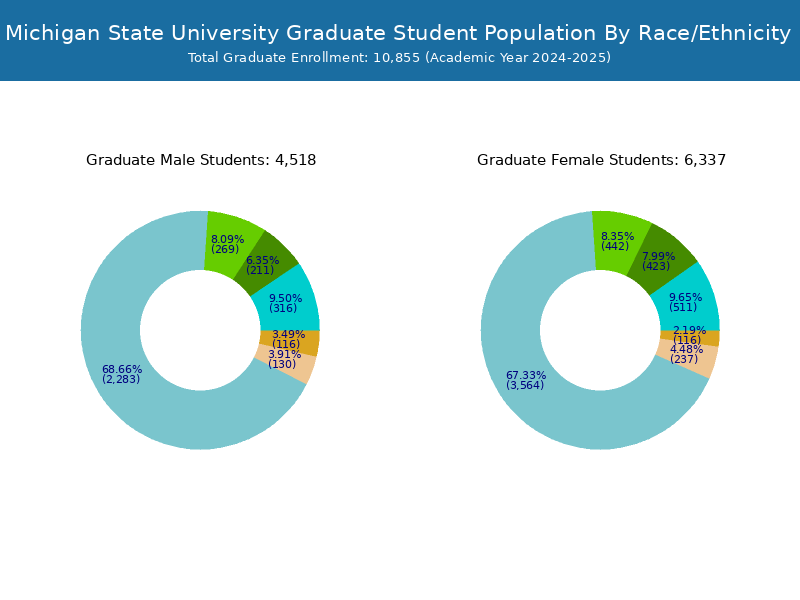
Michigan State University has a total of 50,023 enrolled students for the academic year 2022-2023. 39,201 students have enrolled in undergraduate programs and 10,822 students joined graduate programs.
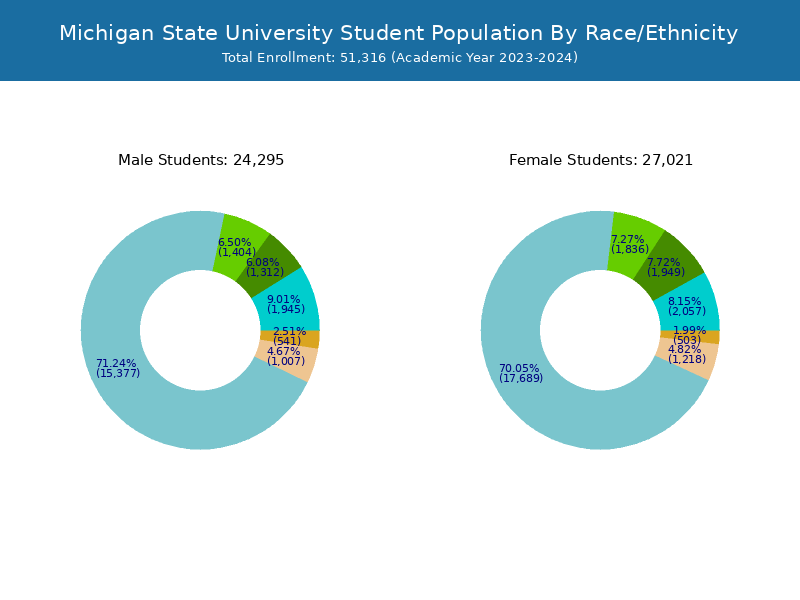
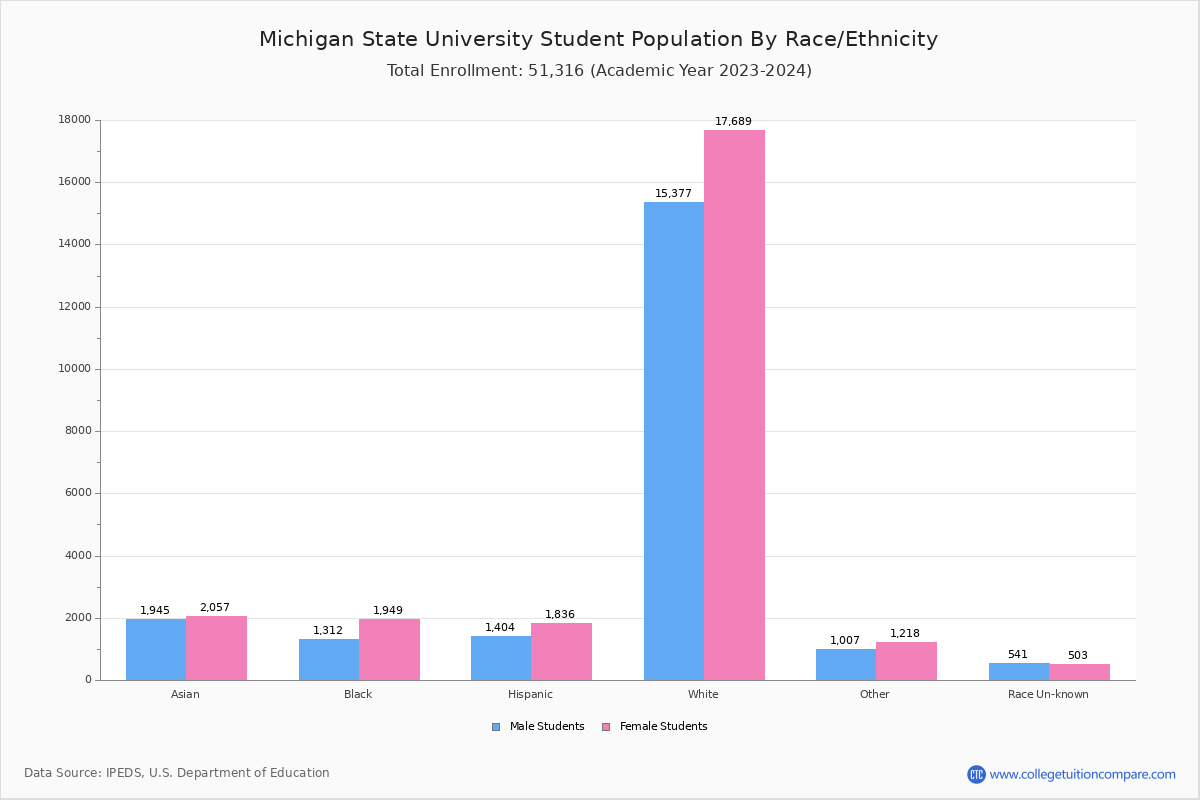
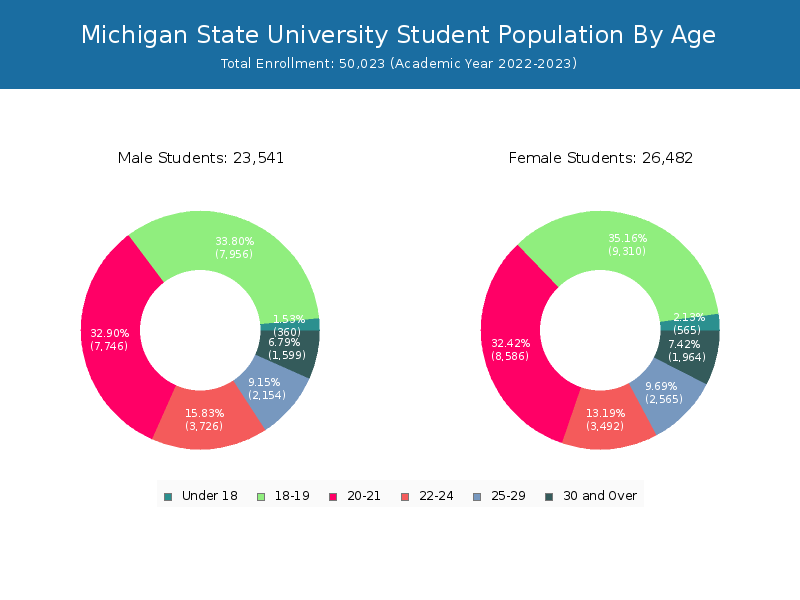
By gender, 23,541 male and 26,482 female students (the male-female ratio is 47:53) are attending the school. The gender distribution is based on the 2022-2023 data.
| Total | Undergraduate | Graduate | |
|---|---|---|---|
| Total | 50,023 | 39,201 | 10,822 |
| Men | 23,541 | 18,944 | 4,597 |
| Women | 26,482 | 20,257 | 6,225 |
Student Distribution by Race/Ethnicity
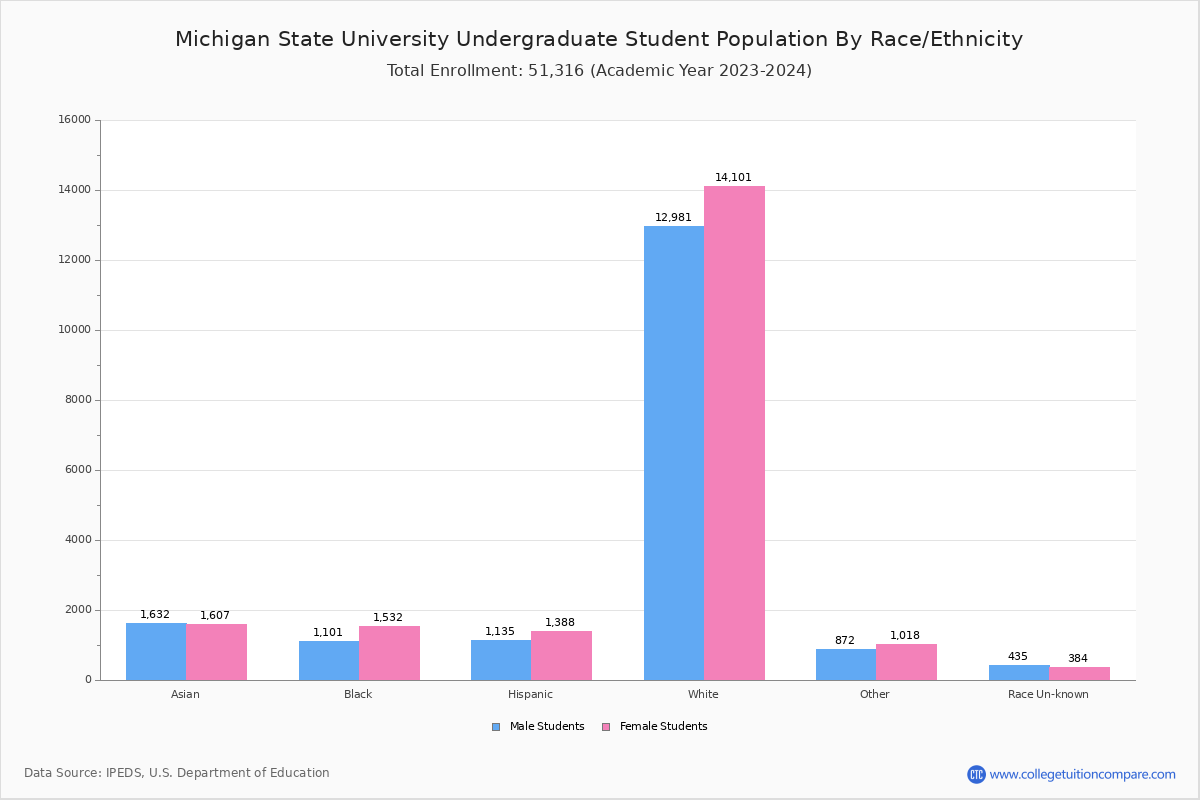
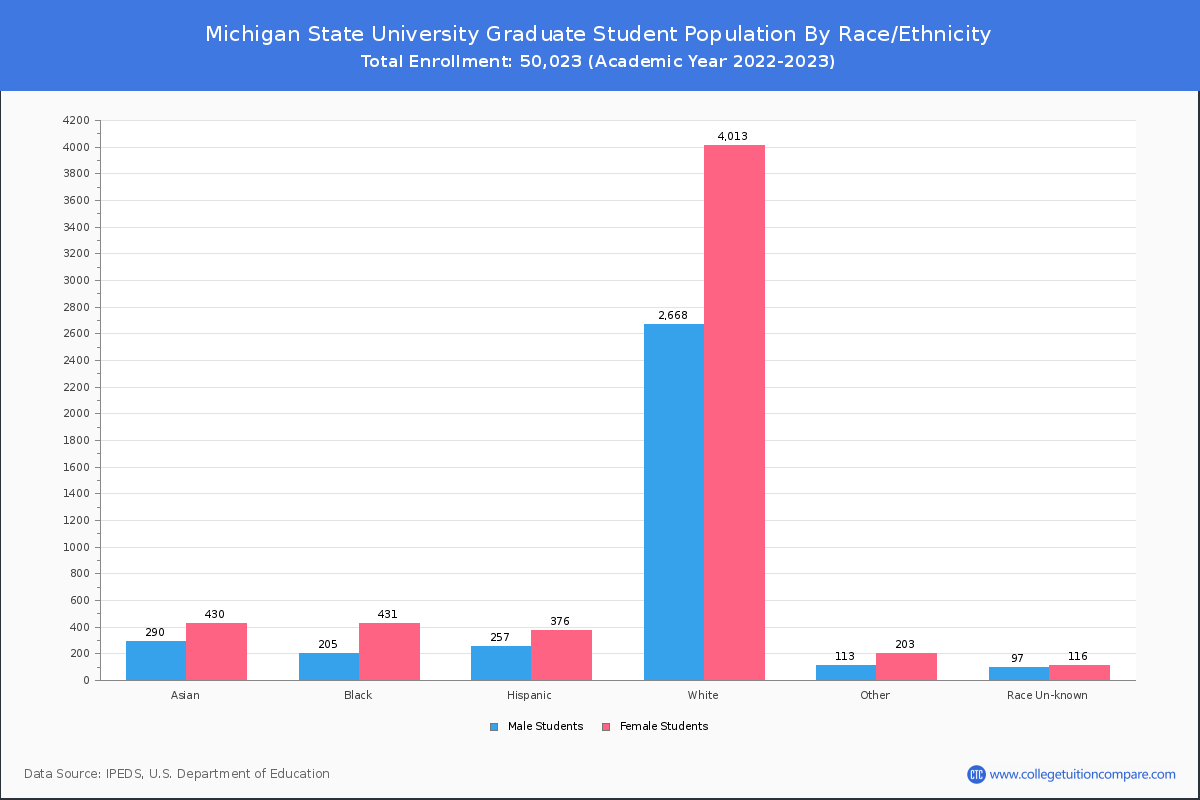
By race/ethnicity, 32,451 White, 3,228 Black, and 3,781 Asian students out of a total of 50,023 are attending at Michigan State University. Comprehensive enrollment statistic data by race/ethnicity is shown in the next chart (Academic year 2022-2023 data).
| Race | Total | Men | Women |
|---|---|---|---|
| American Indian or Native American | 130 | 56 | 74 |
| Asian | 3,781 | 1,869 | 1,912 |
| Black | 3,228 | 1,263 | 1,965 |
| Hispanic | 3,061 | 1,324 | 1,737 |
| Native Hawaiian or Other Pacific Islanders | 30 | 18 | 12 |
| White | 32,451 | 15,036 | 17,415 |
| Two or more races | 1,935 | 838 | 1,097 |
| Race Unknown | 1,036 | 508 | 528 |
| Race | Total | Men | Women |
|---|---|---|---|
| American Indian or Native American | 93 | 42 | 51 |
| Asian | 3,044 | 1,560 | 1,484 |
| Black | 2,590 | 1,052 | 1,538 |
| Hispanic | 2,358 | 1,053 | 1,305 |
| Native Hawaiian or Other Pacific Islanders | 26 | 16 | 10 |
| White | 26,300 | 12,585 | 13,715 |
| Two or more races | 1,593 | 698 | 895 |
| Race Unknown | 857 | 421 | 436 |
| Race | Total | Men | Women |
|---|---|---|---|
| American Indian or Native American | 6 | 1 | 5 |
| Asian | 76 | 43 | 33 |
| Black | 82 | 36 | 46 |
| Hispanic | 91 | 46 | 45 |
| Native Hawaiian or Other Pacific Islanders | 3 | 2 | 1 |
| White | 1,017 | 483 | 534 |
| Two or more races | 50 | 19 | 31 |
| Race Unknown | 27 | 16 | 11 |
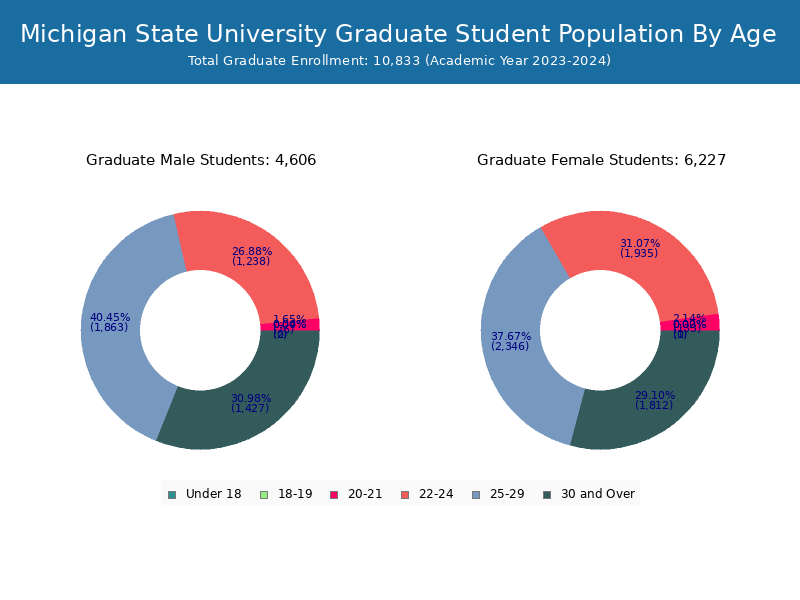
Student Age Distribution
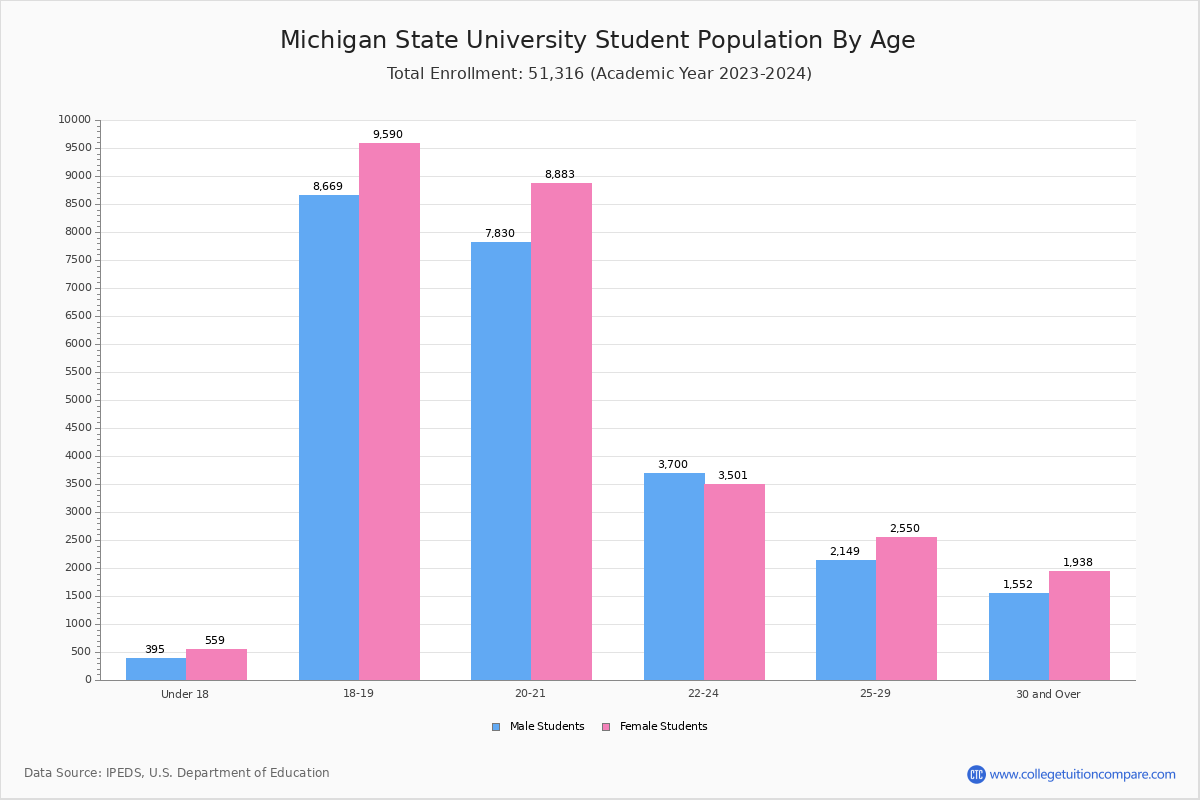
By age, MSU has 925 students under 18 years old and 9 students over 65 years old. There are 41,741 students under 25 years old, and 8,282 students over 25 years old out of 50,023 total students.
In undergraduate programs, 925 students are younger than 18 and 1 students are older than 65. MSU has 38,421 undergraduate students aged under 25 and 780 students aged 25 and over.
It has 3,320 graduate students aged under 25 and 7,502 students aged 25 and over.
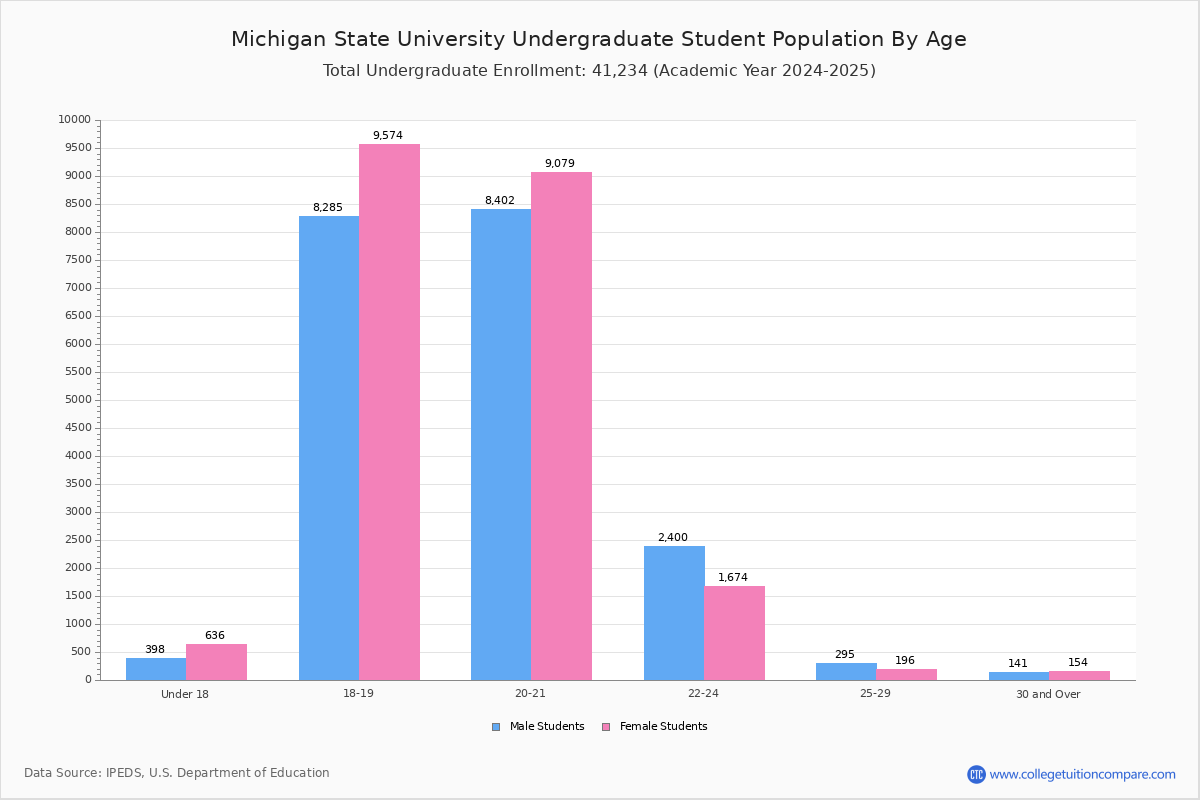
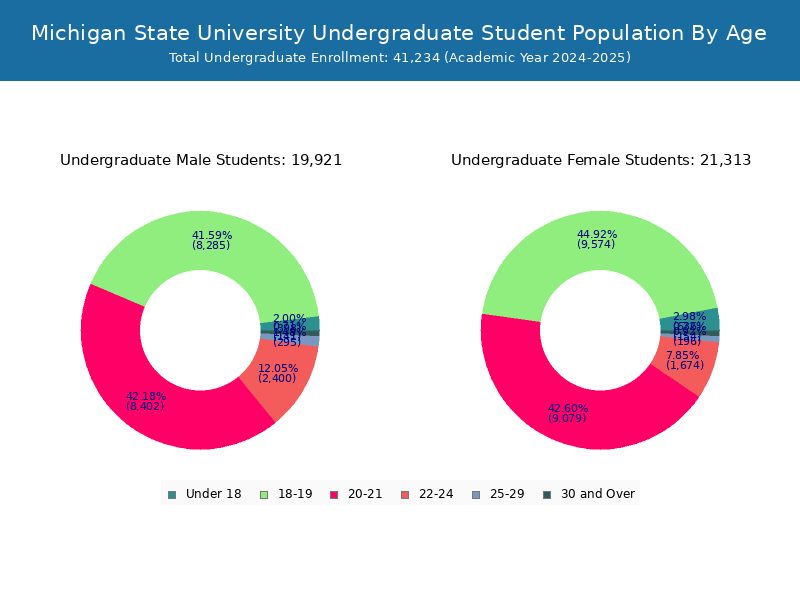

| Age | Total | Men | Women |
|---|---|---|---|
| Under 18 | 925 | 565 | 360 |
| 18-19 | 17,266 | 9,310 | 7,956 |
| 20-21 | 16,332 | 8,586 | 7,746 |
| 22-24 | 7,218 | 3,492 | 3,726 |
| 25-29 | 4,719 | 2,565 | 2,154 |
| 30-34 | 1,834 | 987 | 847 |
| 35-39 | 732 | 390 | 342 |
| 40-49 | 738 | 432 | 306 |
| 50-64 | 250 | 152 | 98 |
| Over 65 | 9 | 3 | 6 |
| Age | Total | Men | Women |
|---|---|---|---|
| Under 18 | 925 | 565 | 360 |
| 18-19 | 17,265 | 9,309 | 7,956 |
| 20-21 | 16,125 | 8,434 | 7,691 |
| 22-24 | 4,106 | 1,603 | 2,503 |
| 25-29 | 528 | 218 | 310 |
| 30-34 | 120 | 64 | 56 |
| 35-39 | 55 | 24 | 31 |
| 40-49 | 50 | 26 | 24 |
| 50-64 | 26 | 13 | 13 |
| Over 65 | 1 | 1 | 0 |
| Age | Total | Men | Women |
|---|
Online Student Enrollment
Distance learning, also called online education, is very attractive to students, especially who want to continue education and work in field. At Michigan State University, 2,728 students are enrolled exclusively in online courses and 23,498 students are enrolled in some online courses.
1,705 students lived in Michigan or jurisdiction in which the school is located are enrolled exclusively in online courses and 1,023 students live in other State or outside of the United States.
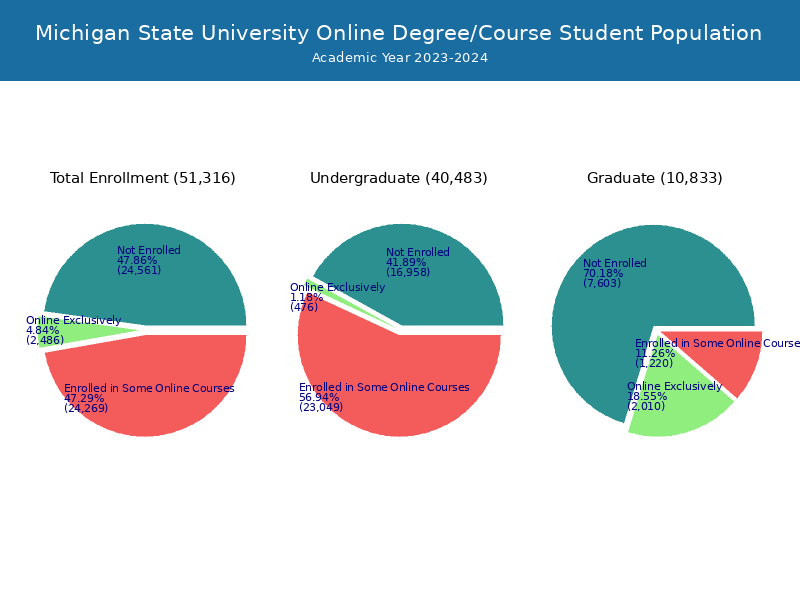
| All Students | Enrolled Exclusively Online Courses | Enrolled in Some Online Courses | |
|---|---|---|---|
| All Students | 50,023 | 2,728 | 23,498 |
| Undergraduate | 39,201 | 611 | 22,156 |
| Graduate | 10,822 | 2,117 | 1,342 |
| Michigan Residents | Other States in U.S. | Outside of U.S. | |
|---|---|---|---|
| All Students | 1,705 | 933 | 90 |
| Undergraduate | 525 | 56 | 30 |
| Graduate | 1,180 | 877 | 60 |
Transfer-in Students (Undergraduate)
Among 39,201 enrolled in undergraduate programs, 1,378 students have transferred-in from other institutions. The percentage of transfer-in students is 3.52%.1,251 students have transferred in as full-time status and 127 students transferred in as part-time status.
| Number of Students | |
|---|---|
| Regular Full-time | 34,731 |
| Transfer-in Full-time | 1,251 |
| Regular Part-time | 3,092 |
| Transfer-in Part-time | 127 |