Student Population by Gender
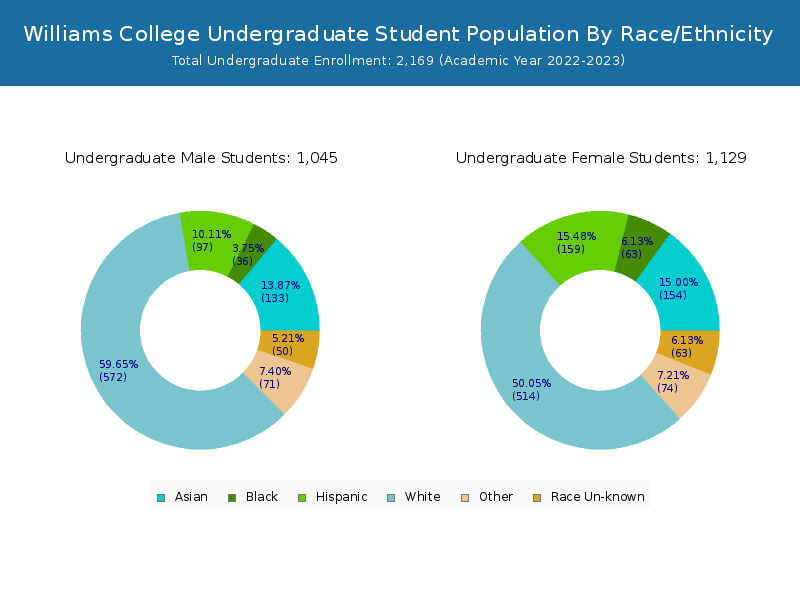
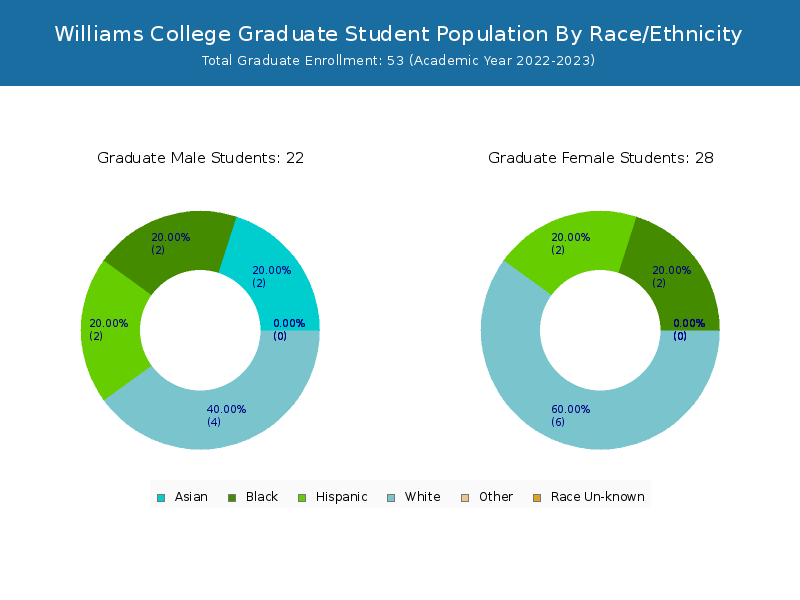
Williams College has a total of 2,222 enrolled students for the academic year 2022-2023. 2,169 students have enrolled in undergraduate programs and 53 students joined graduate programs.
By gender, 1,047 male and 1,175 female students (the male-female ratio is 47:53) are attending the school. The gender distribution is based on the 2022-2023 data.
| Total | Undergraduate | Graduate | |
|---|---|---|---|
| Total | 2,222 | 2,169 | 53 |
| Men | 1,047 | 1,025 | 22 |
| Women | 1,175 | 1,144 | 31 |
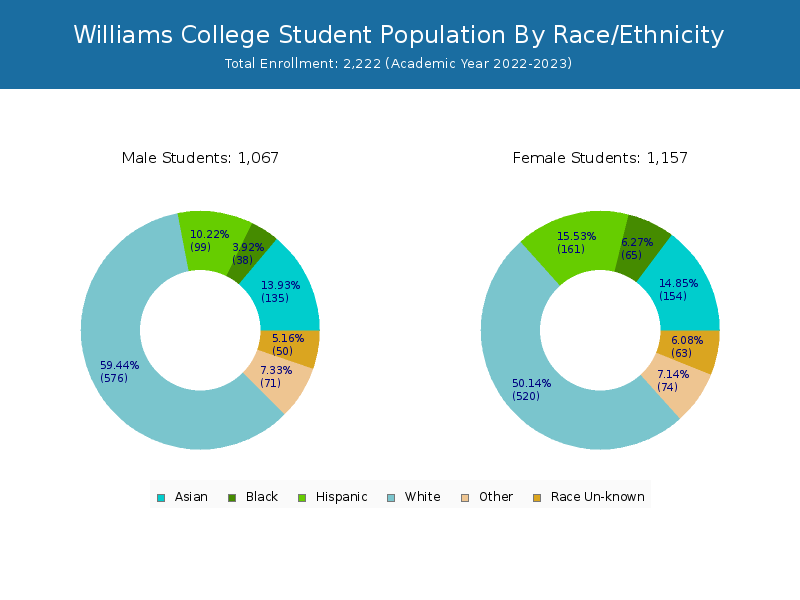
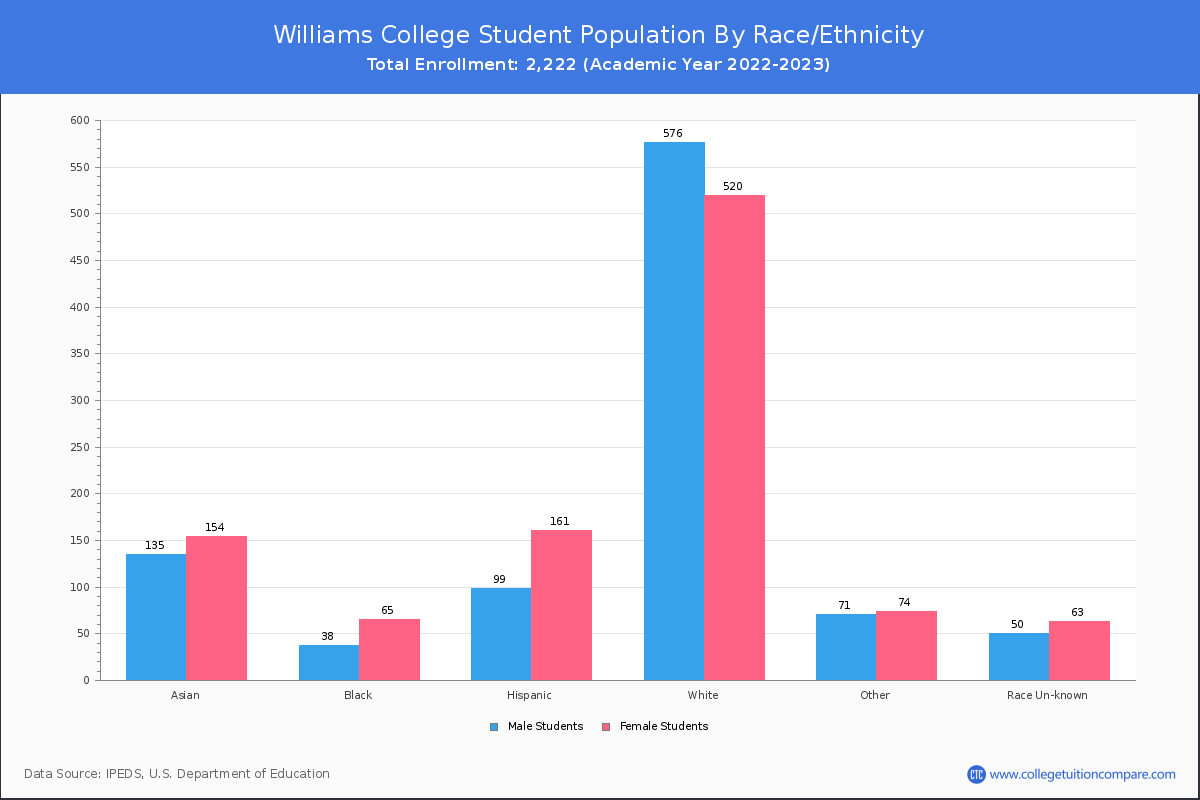
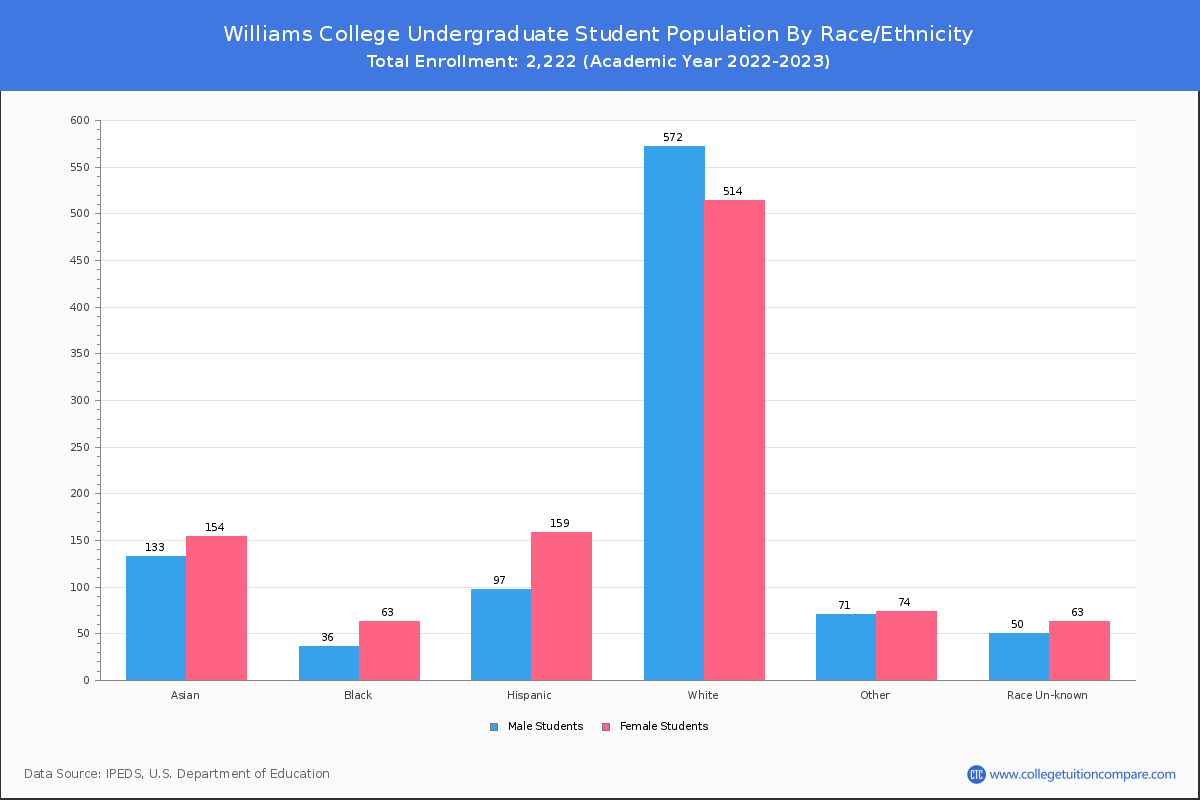
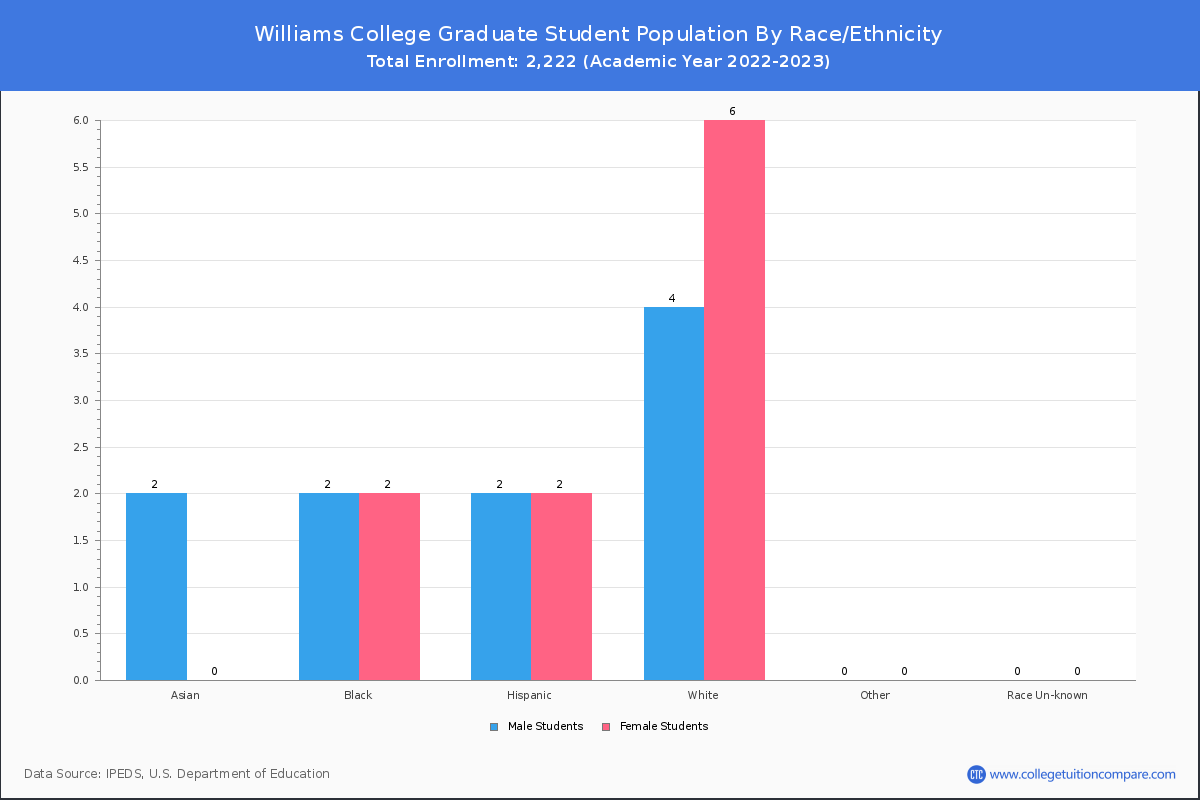
Student Distribution by Race/Ethnicity
By race/ethnicity, 1,056 White, 112 Black, and 293 Asian students out of a total of 2,222 are attending at Williams College. Comprehensive enrollment statistic data by race/ethnicity is shown in the next chart (Academic year 2022-2023 data).
| Race | Total | Men | Women |
|---|---|---|---|
| American Indian or Native American | 0 | 0 | 0 |
| Asian | 293 | 127 | 166 |
| Black | 112 | 40 | 72 |
| Hispanic | 277 | 104 | 173 |
| Native Hawaiian or Other Pacific Islanders | 1 | 0 | 1 |
| White | 1,056 | 546 | 510 |
| Two or more races | 166 | 85 | 81 |
| Race Unknown | 96 | 40 | 56 |
| Race | Total | Men | Women |
|---|---|---|---|
| American Indian or Native American | 0 | 0 | 0 |
| Asian | 290 | 126 | 164 |
| Black | 107 | 38 | 69 |
| Hispanic | 271 | 101 | 170 |
| Native Hawaiian or Other Pacific Islanders | 1 | 0 | 1 |
| White | 1,047 | 545 | 502 |
| Two or more races | 166 | 85 | 81 |
| Race Unknown | 96 | 40 | 56 |
| Race | Total | Men | Women |
|---|---|---|---|
| American Indian or Native American | 0 | 0 | 0 |
| Asian | 1 | 1 | 0 |
| Black | 1 | 1 | 0 |
| Hispanic | 1 | 1 | 0 |
| Native Hawaiian or Other Pacific Islanders | 0 | 0 | 0 |
| White | 6 | 6 | 0 |
| Two or more races | 1 | 1 | 0 |
| Race Unknown | 0 | 0 | 0 |
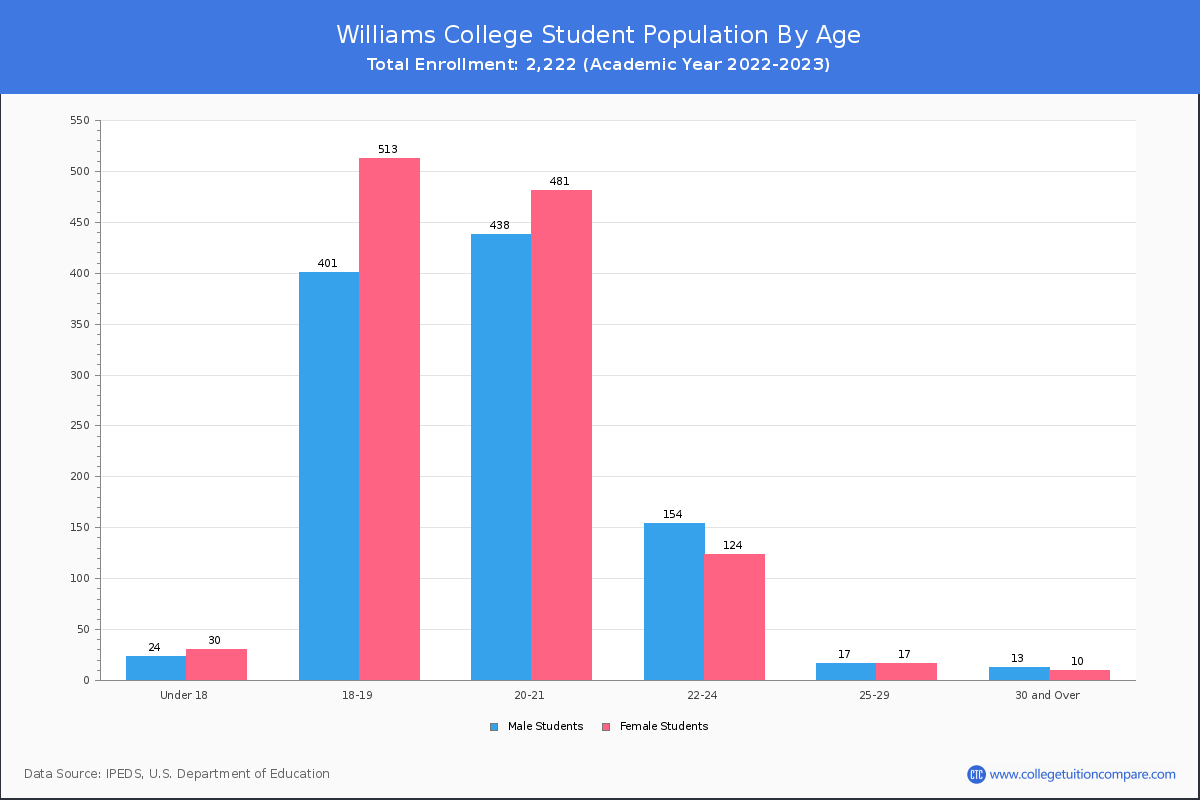
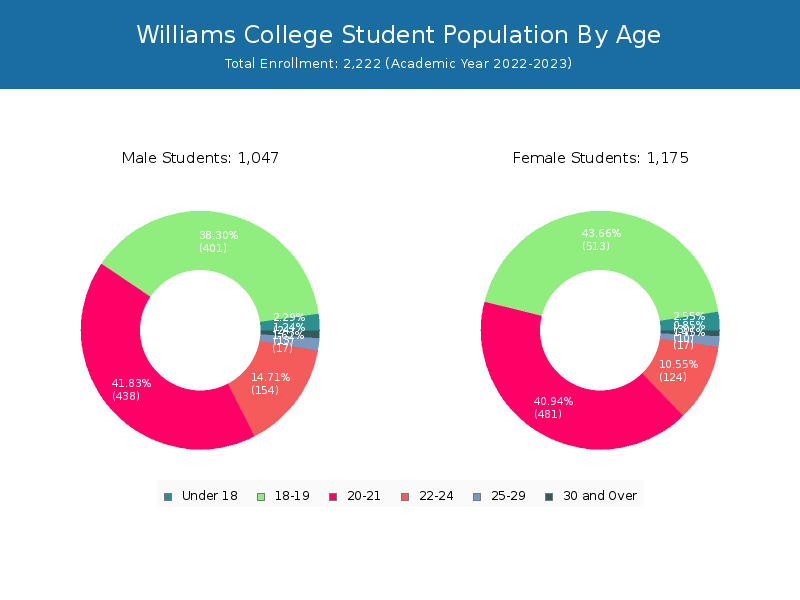
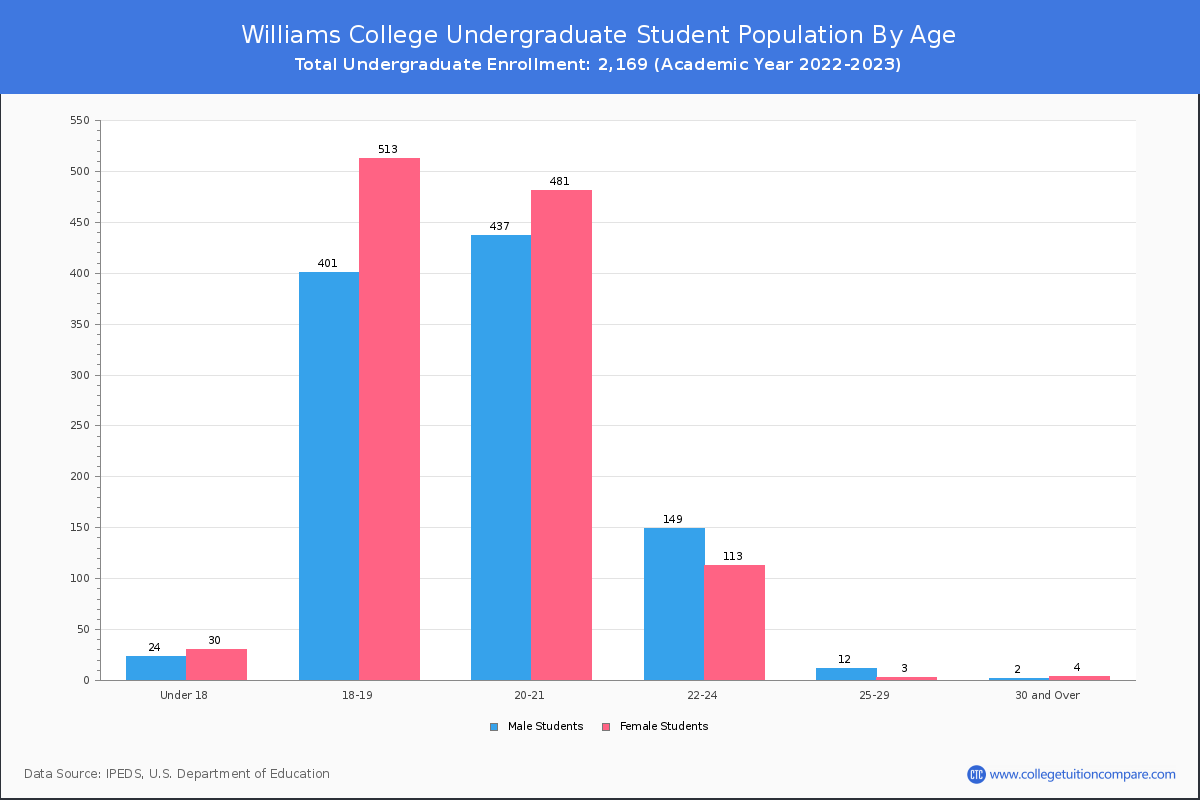
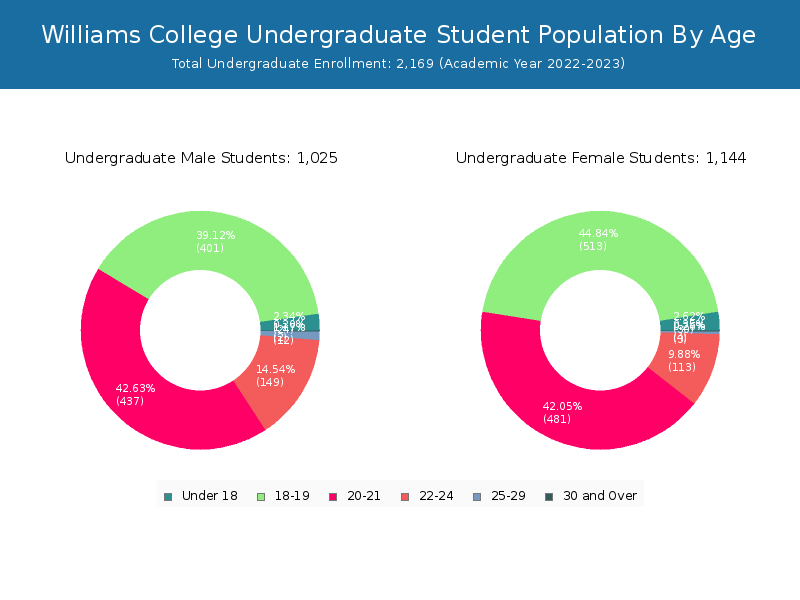
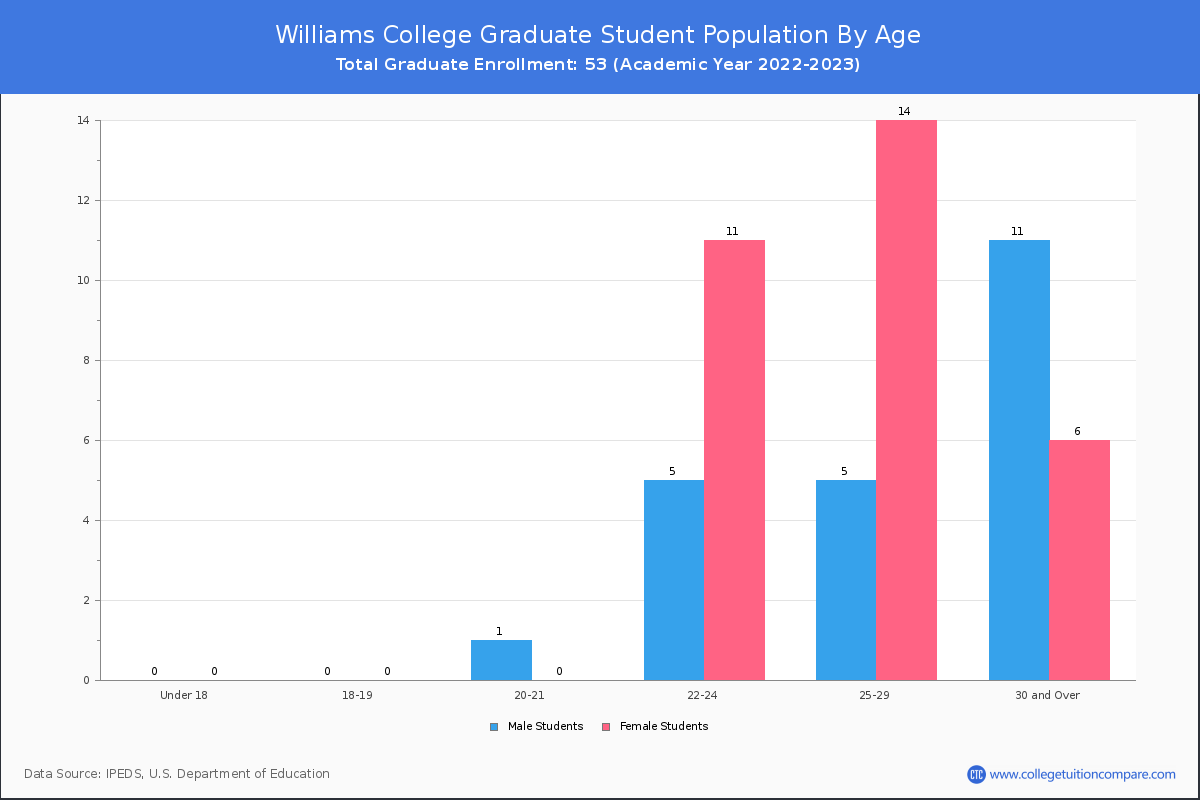
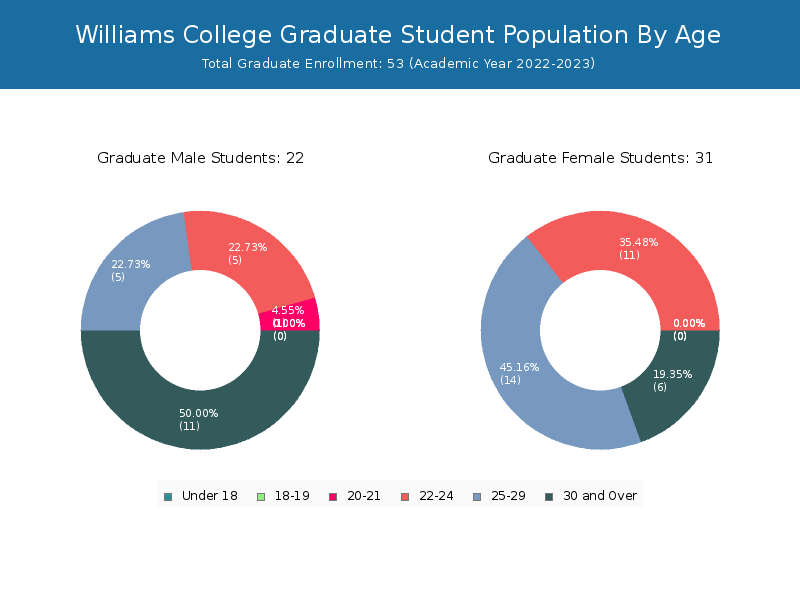
Student Age Distribution
There are 2,165 students under 25 years old, and 57 students over 25 years old out of 2,222 total students.
Williams has 2,148 undergraduate students aged under 25 and 21 students aged 25 and over.
It has 17 graduate students aged under 25 and 36 students aged 25 and over.
| Age | Total | Men | Women |
|---|---|---|---|
| Under 18 | 54 | 30 | 24 |
| 18-19 | 914 | 513 | 401 |
| 20-21 | 919 | 481 | 438 |
| 22-24 | 278 | 124 | 154 |
| 25-29 | 34 | 17 | 17 |
| 30-34 | 12 | 5 | 7 |
| 35-39 | 10 | 5 | 5 |
| 40-49 | 1 | 0 | 1 |
| Age | Total | Men | Women |
|---|---|---|---|
| Under 18 | 54 | 30 | 24 |
| 18-19 | 914 | 513 | 401 |
| 20-21 | 918 | 481 | 437 |
| 22-24 | 262 | 113 | 149 |
| 25-29 | 15 | 3 | 12 |
| 30-34 | 4 | 3 | 1 |
| 35-39 | 2 | 1 | 1 |
| Age | Total | Men | Women |
|---|
Transfer-in Students (Undergraduate)
Among 2,169 enrolled in undergraduate programs, 11 students have transferred-in from other institutions. The percentage of transfer-in students is 0.51%.
| Number of Students | |
|---|---|
| Regular Full-time | 2,135 |
| Transfer-in Full-time | 11 |