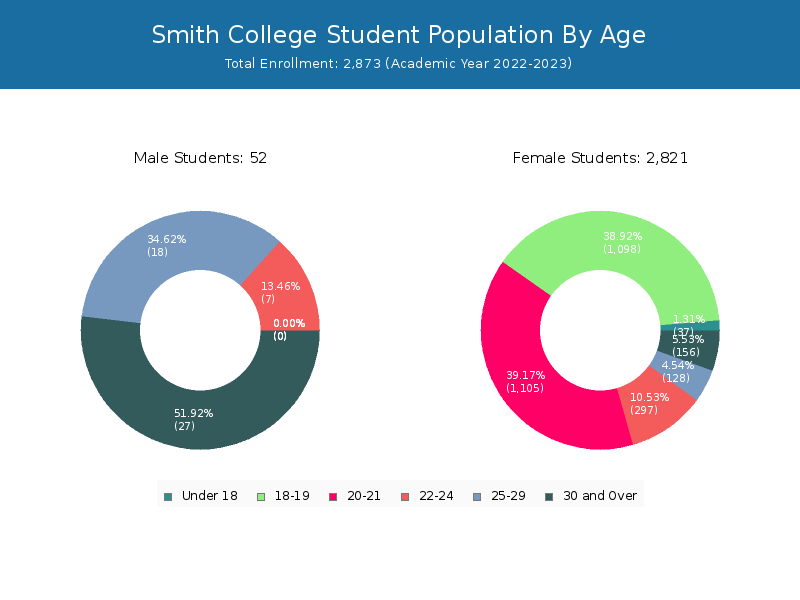
Student Population by Gender
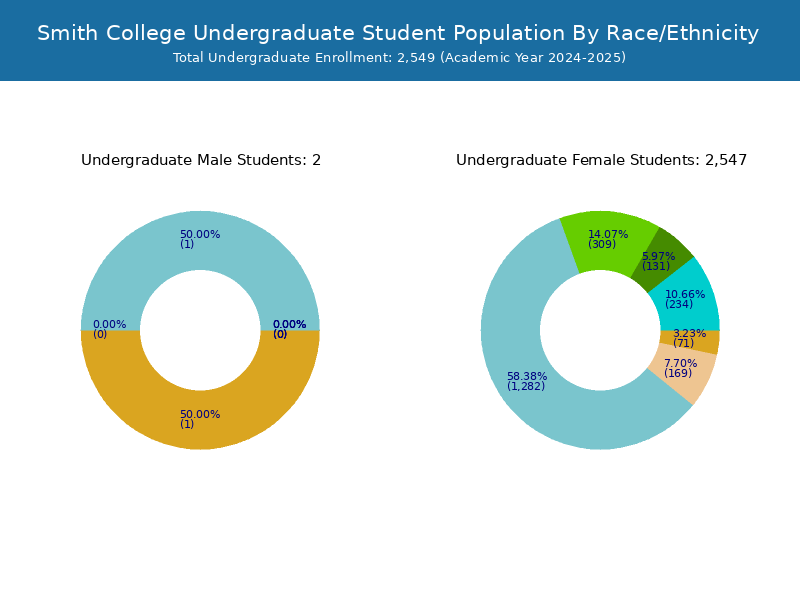
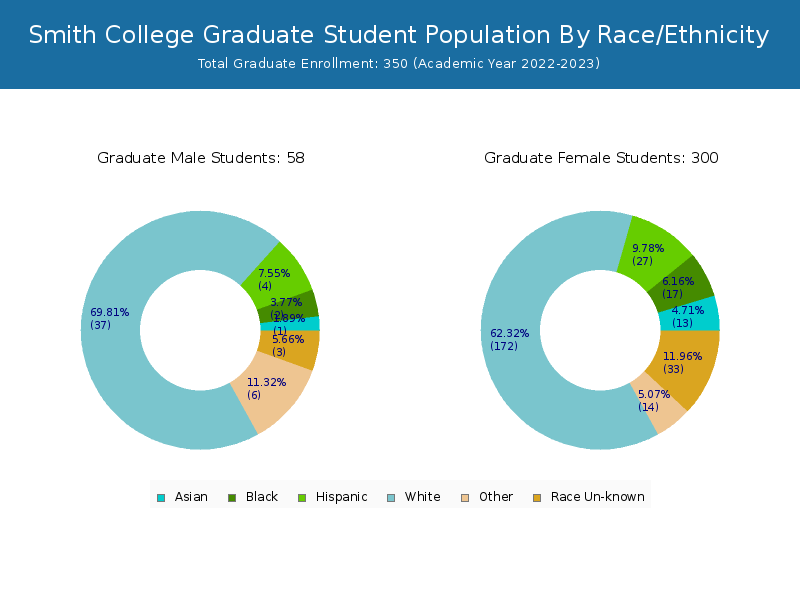
Smith College has a total of 2,873 enrolled students for the academic year 2022-2023. 2,523 students have enrolled in undergraduate programs and 350 students joined graduate programs.
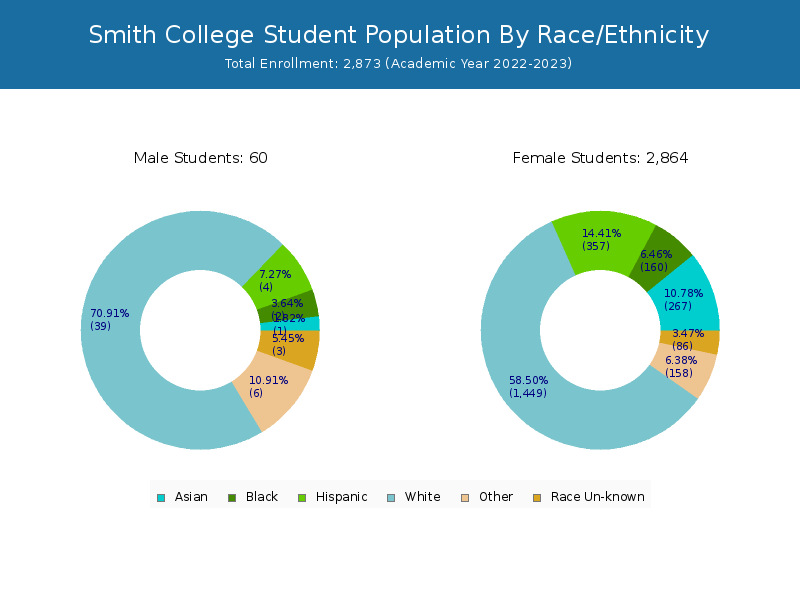
By gender, 52 male and 2,821 female students (the male-female ratio is 2:98) are attending the school. The gender distribution is based on the 2022-2023 data.
| Total | Undergraduate | Graduate | |
|---|---|---|---|
| Total | 2,873 | 2,523 | 350 |
| Men | 52 | 1 | 51 |
| Women | 2,821 | 2,522 | 299 |
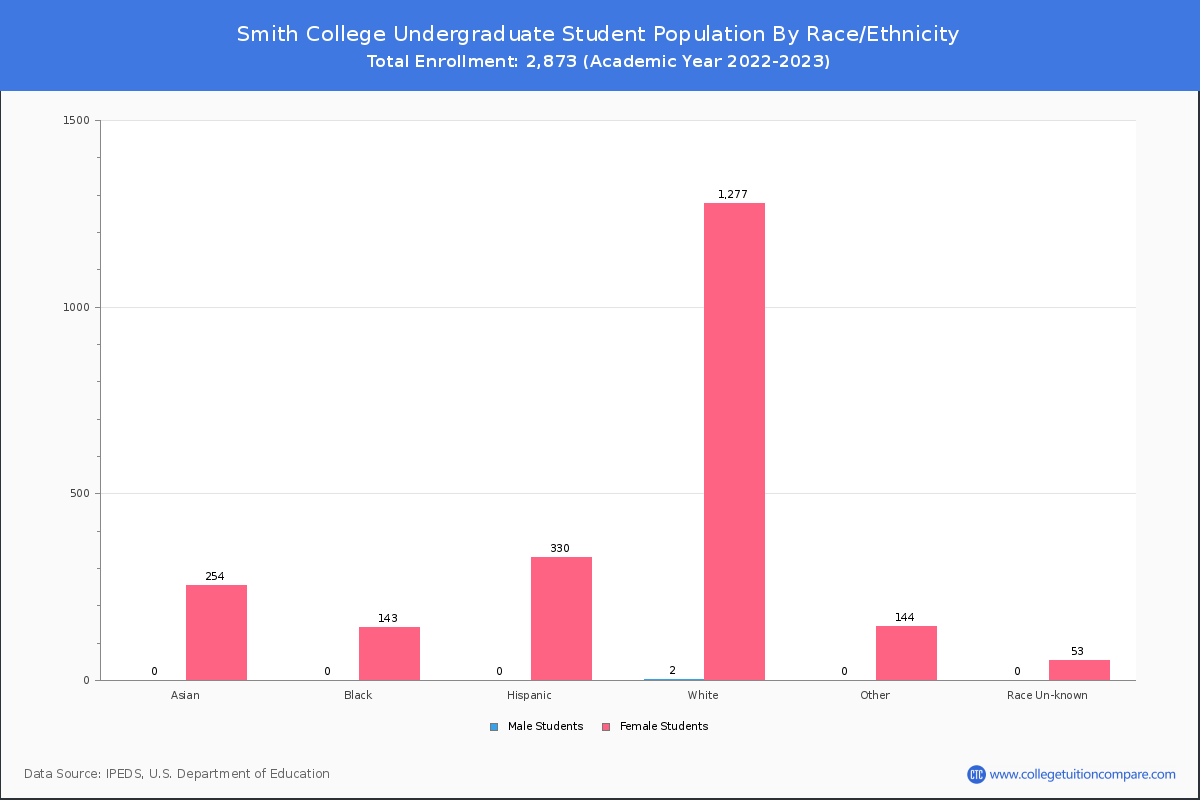
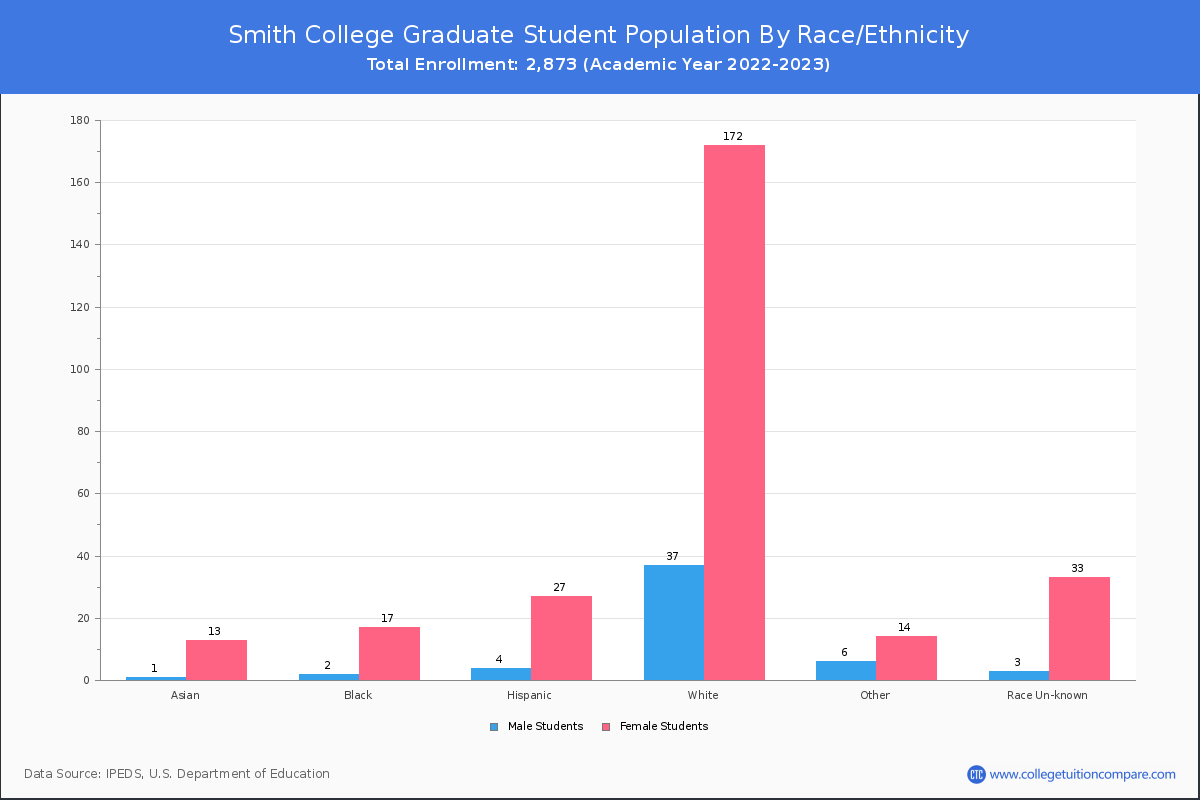
Student Distribution by Race/Ethnicity
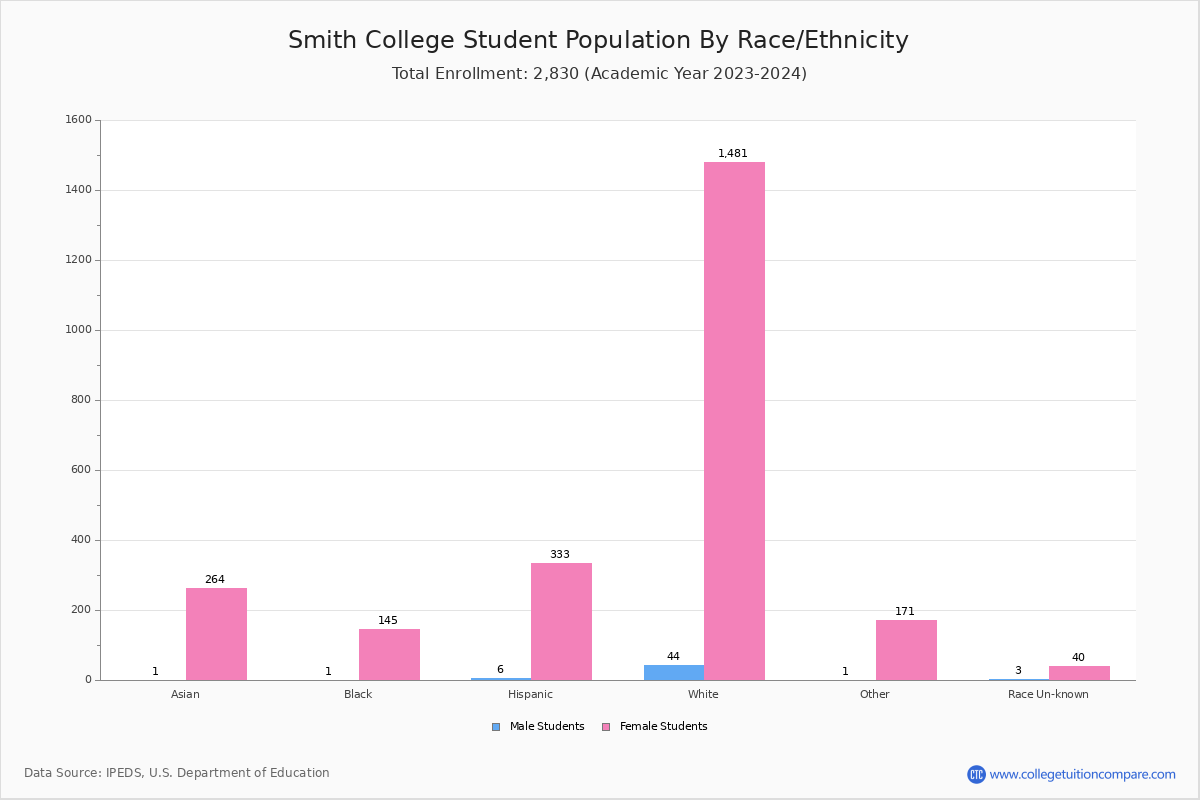
By race/ethnicity, 1,503 White, 158 Black, and 264 Asian students out of a total of 2,873 are attending at Smith College. Comprehensive enrollment statistic data by race/ethnicity is shown in the next chart (Academic year 2022-2023 data).
| Race | Total | Men | Women |
|---|---|---|---|
| American Indian or Native American | 2 | 0 | 2 |
| Asian | 264 | 0 | 264 |
| Black | 158 | 3 | 155 |
| Hispanic | 336 | 5 | 331 |
| Native Hawaiian or Other Pacific Islanders | 4 | 0 | 4 |
| White | 1,503 | 33 | 1,470 |
| Two or more races | 157 | 4 | 153 |
| Race Unknown | 65 | 4 | 61 |
| Race | Total | Men | Women |
|---|---|---|---|
| American Indian or Native American | 2 | 0 | 2 |
| Asian | 241 | 0 | 241 |
| Black | 136 | 0 | 136 |
| Hispanic | 308 | 0 | 308 |
| Native Hawaiian or Other Pacific Islanders | 4 | 0 | 4 |
| White | 1,285 | 1 | 1,284 |
| Two or more races | 143 | 0 | 143 |
| Race Unknown | 43 | 0 | 43 |
| Race | Total | Men | Women |
|---|---|---|---|
| American Indian or Native American | 0 | 0 | 0 |
| Asian | 1 | 0 | 1 |
| Black | 1 | 0 | 1 |
| Hispanic | 3 | 0 | 3 |
| Native Hawaiian or Other Pacific Islanders | 0 | 0 | 0 |
| White | 21 | 0 | 21 |
| Two or more races | 0 | 0 | 0 |
| Race Unknown | 0 | 0 | 0 |
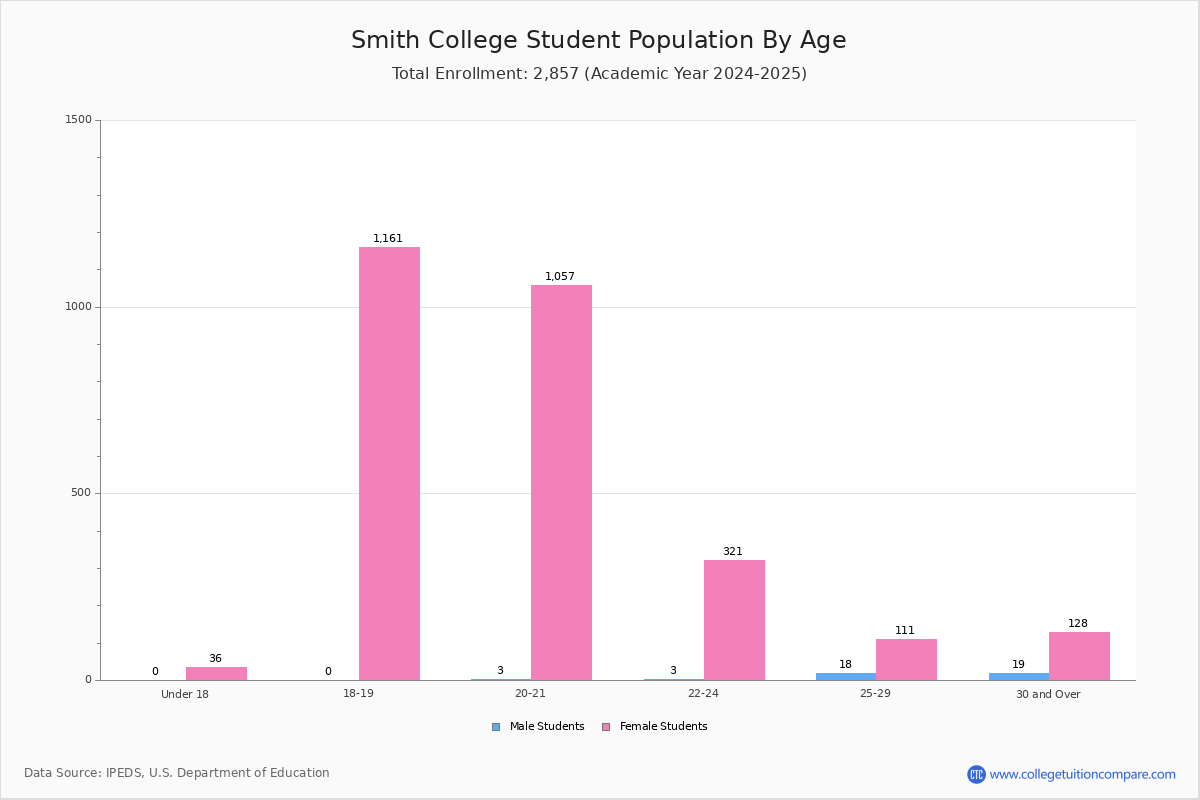
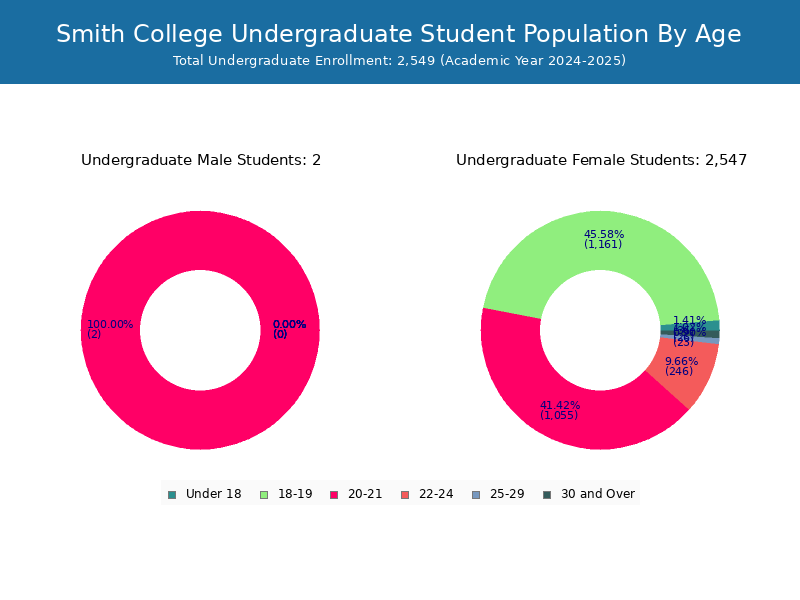
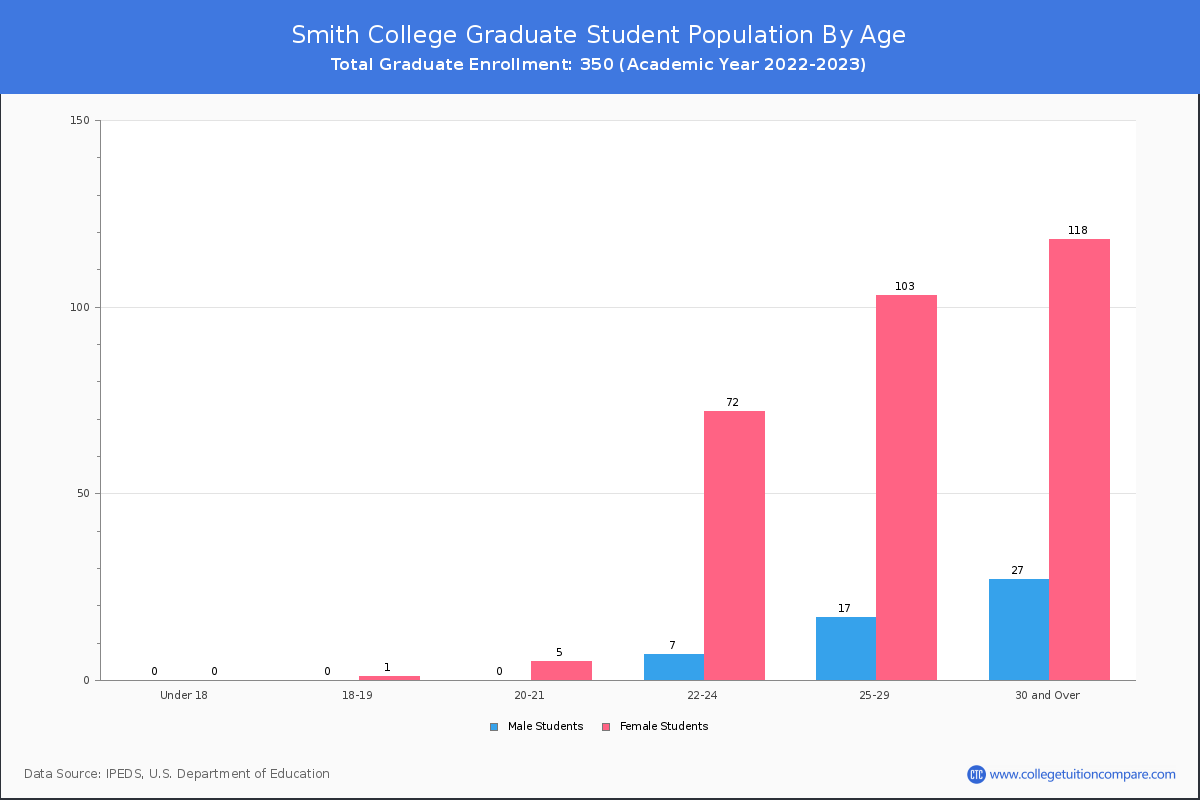
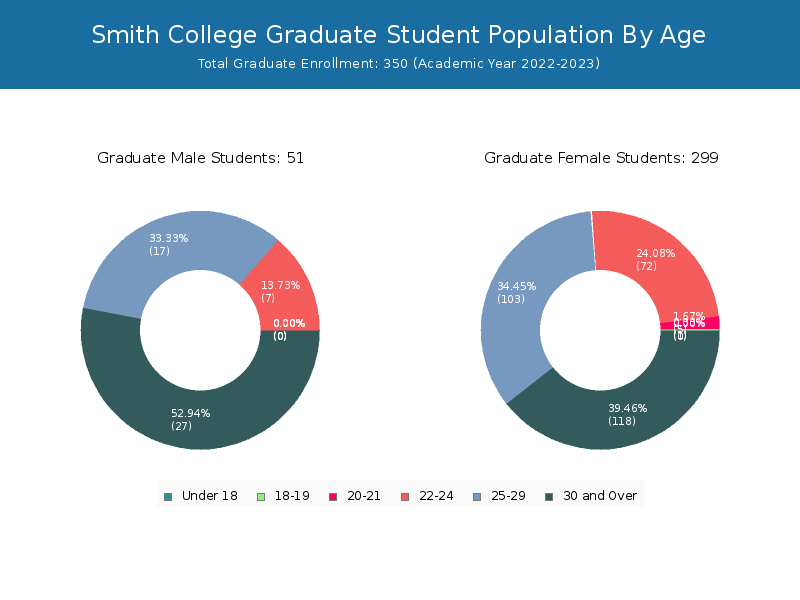
Student Age Distribution
By age, Smith has 37 students under 18 years old and 1 students over 65 years old. There are 2,544 students under 25 years old, and 329 students over 25 years old out of 2,873 total students.
Smith has 2,459 undergraduate students aged under 25 and 64 students aged 25 and over.
It has 85 graduate students aged under 25 and 265 students aged 25 and over.
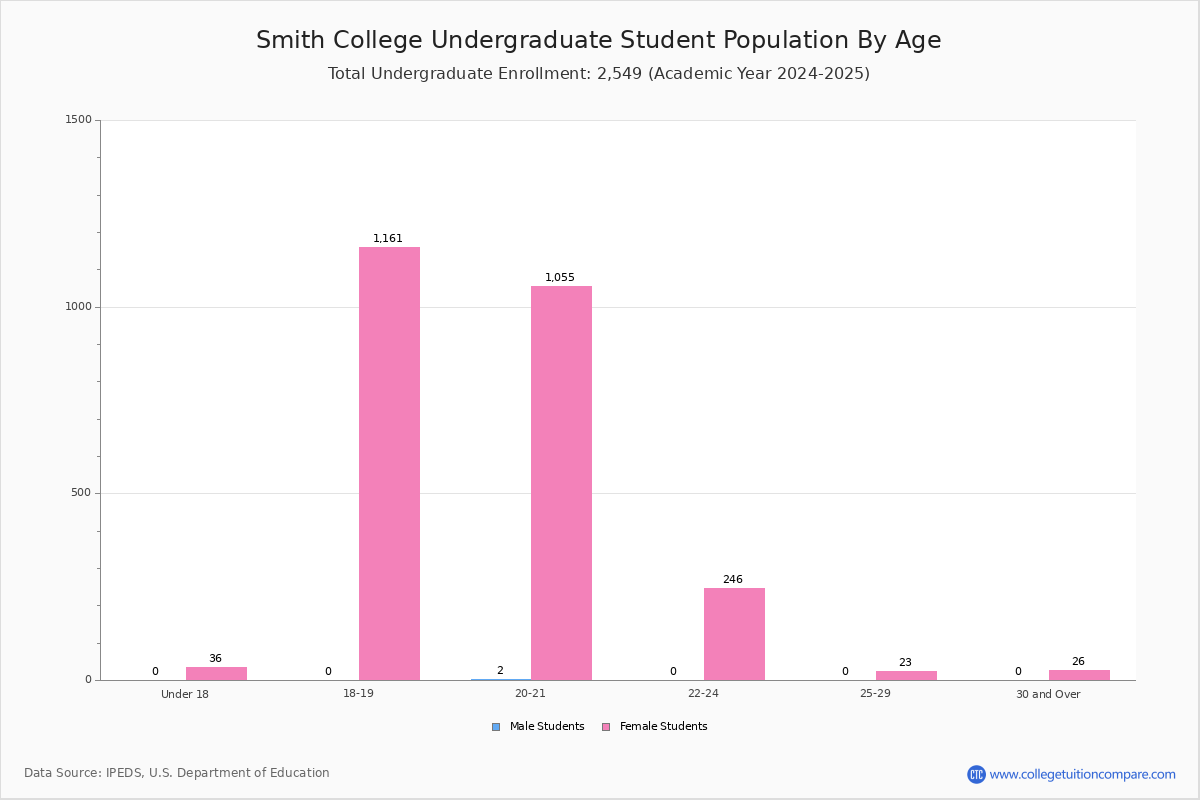
| Age | Total | Men | Women |
|---|---|---|---|
| Under 18 | 37 | 37 | 0 |
| 18-19 | 1,098 | 1,098 | 0 |
| 20-21 | 1,105 | 1,105 | 0 |
| 22-24 | 304 | 297 | 7 |
| 25-29 | 146 | 128 | 18 |
| 30-34 | 89 | 80 | 9 |
| 35-39 | 38 | 31 | 7 |
| 40-49 | 43 | 34 | 9 |
| 50-64 | 12 | 11 | 1 |
| Over 65 | 1 | 0 | 1 |
| Age | Total | Men | Women |
|---|---|---|---|
| Under 18 | 37 | 37 | 0 |
| 18-19 | 1,097 | 1,097 | 0 |
| 20-21 | 1,100 | 1,100 | 0 |
| 22-24 | 225 | 225 | 0 |
| 25-29 | 26 | 25 | 1 |
| 30-34 | 19 | 19 | 0 |
| 35-39 | 8 | 8 | 0 |
| 40-49 | 10 | 10 | 0 |
| 50-64 | 1 | 1 | 0 |
| Age | Total | Men | Women |
|---|
Transfer-in Students (Undergraduate)
Among 2,523 enrolled in undergraduate programs, 32 students have transferred-in from other institutions. The percentage of transfer-in students is 1.27%.31 students have transferred in as full-time status and 1 students transferred in as part-time status.
| Number of Students | |
|---|---|
| Regular Full-time | 2,487 |
| Transfer-in Full-time | 31 |
| Regular Part-time | 4 |
| Transfer-in Part-time | 1 |