Student Population by Gender
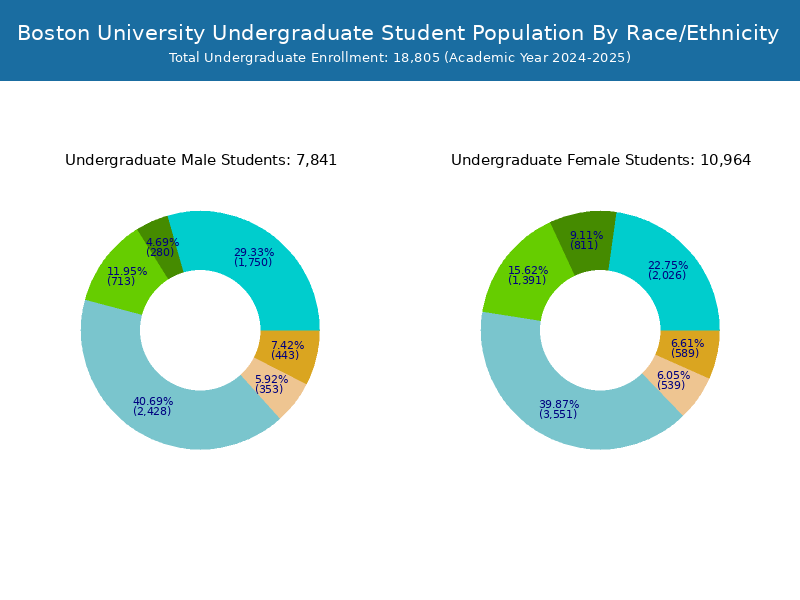
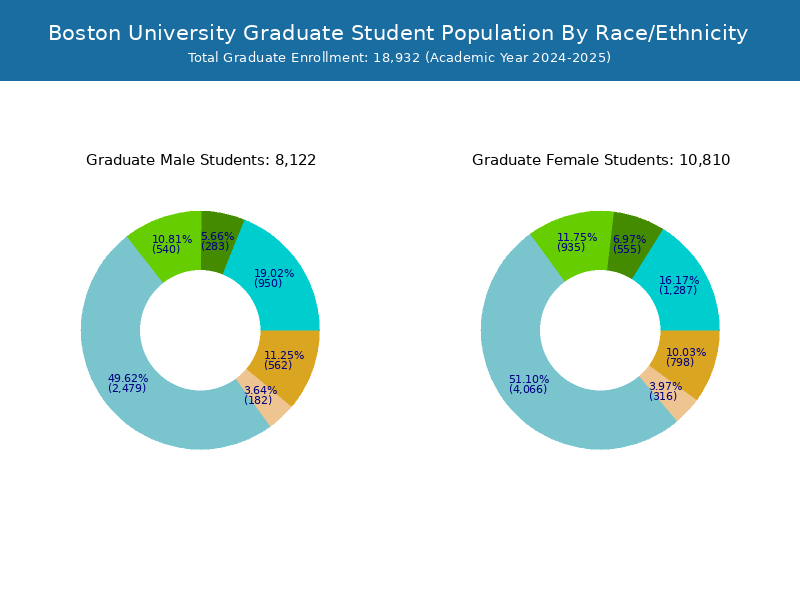
Boston University has a total of 36,714 enrolled students for the academic year 2022-2023. 18,459 students have enrolled in undergraduate programs and 18,255 students joined graduate programs.
By gender, 15,646 male and 21,068 female students (the male-female ratio is 43:57) are attending the school. The gender distribution is based on the 2022-2023 data.
| Total | Undergraduate | Graduate | |
|---|---|---|---|
| Total | 36,714 | 18,459 | 18,255 |
| Men | 15,646 | 7,742 | 7,904 |
| Women | 21,068 | 10,717 | 10,351 |
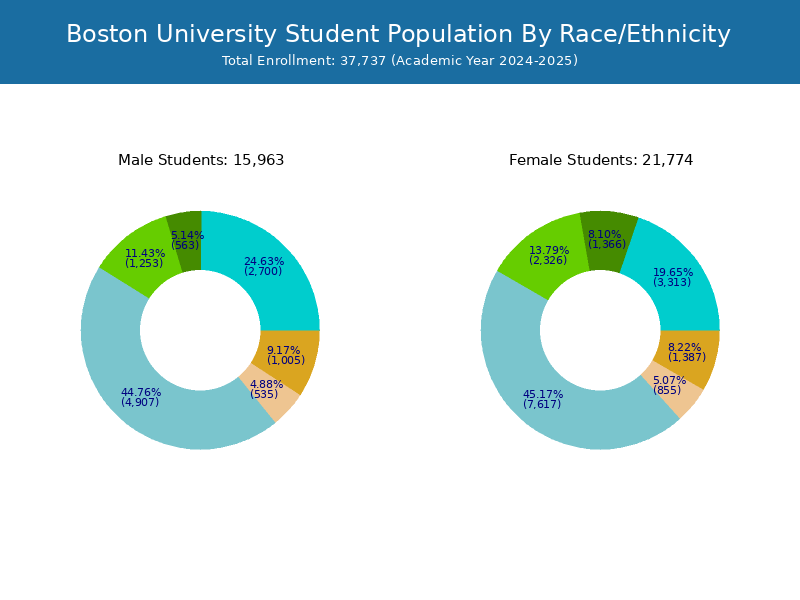
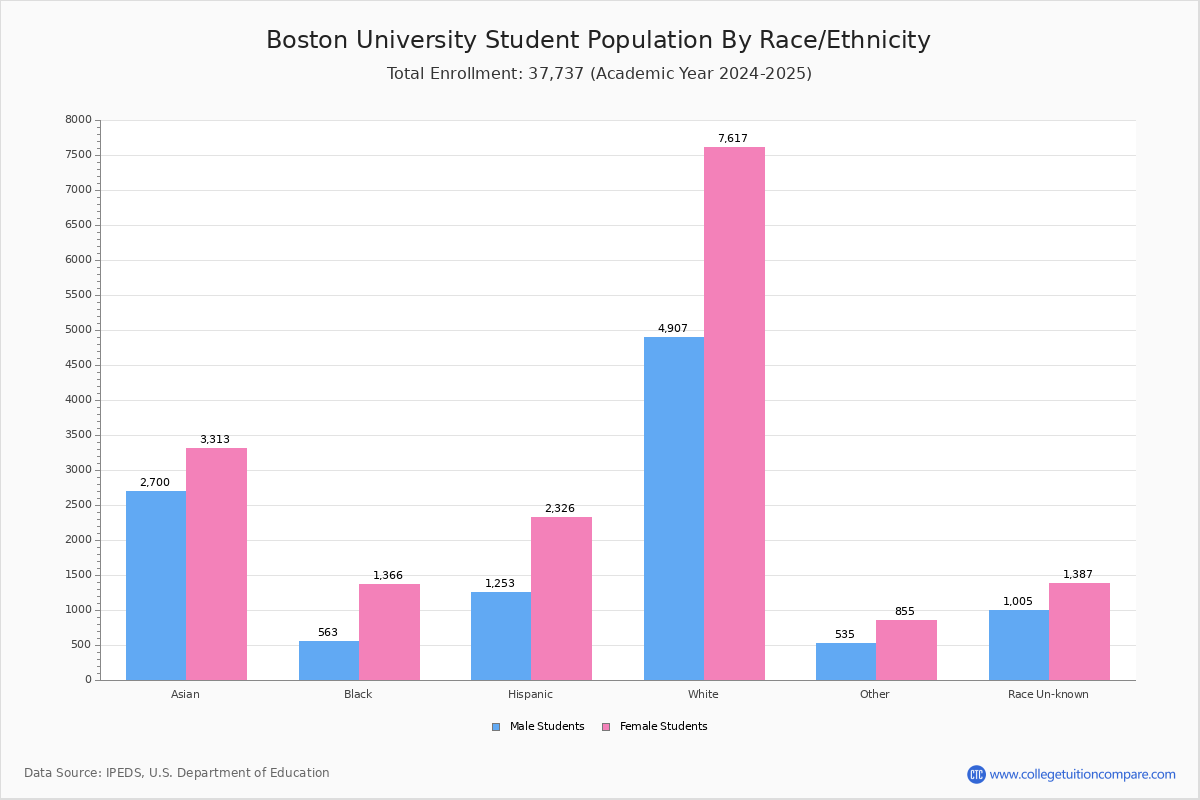
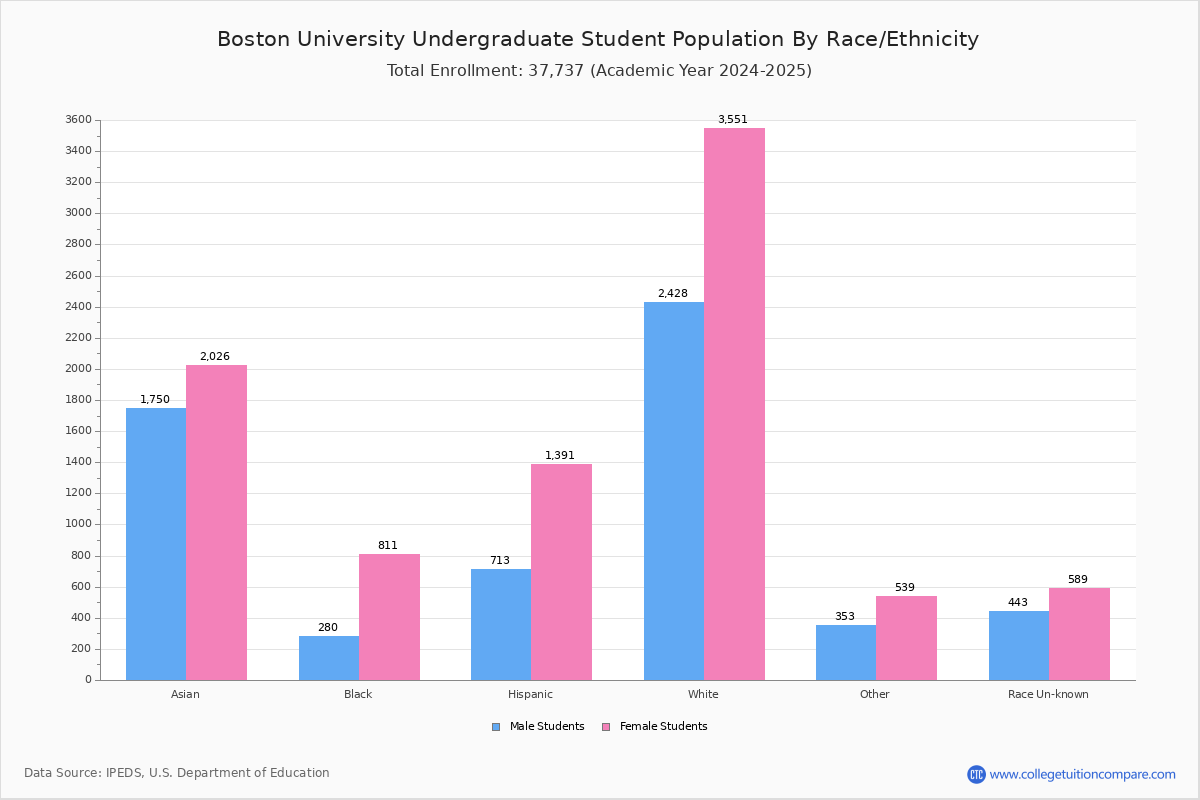
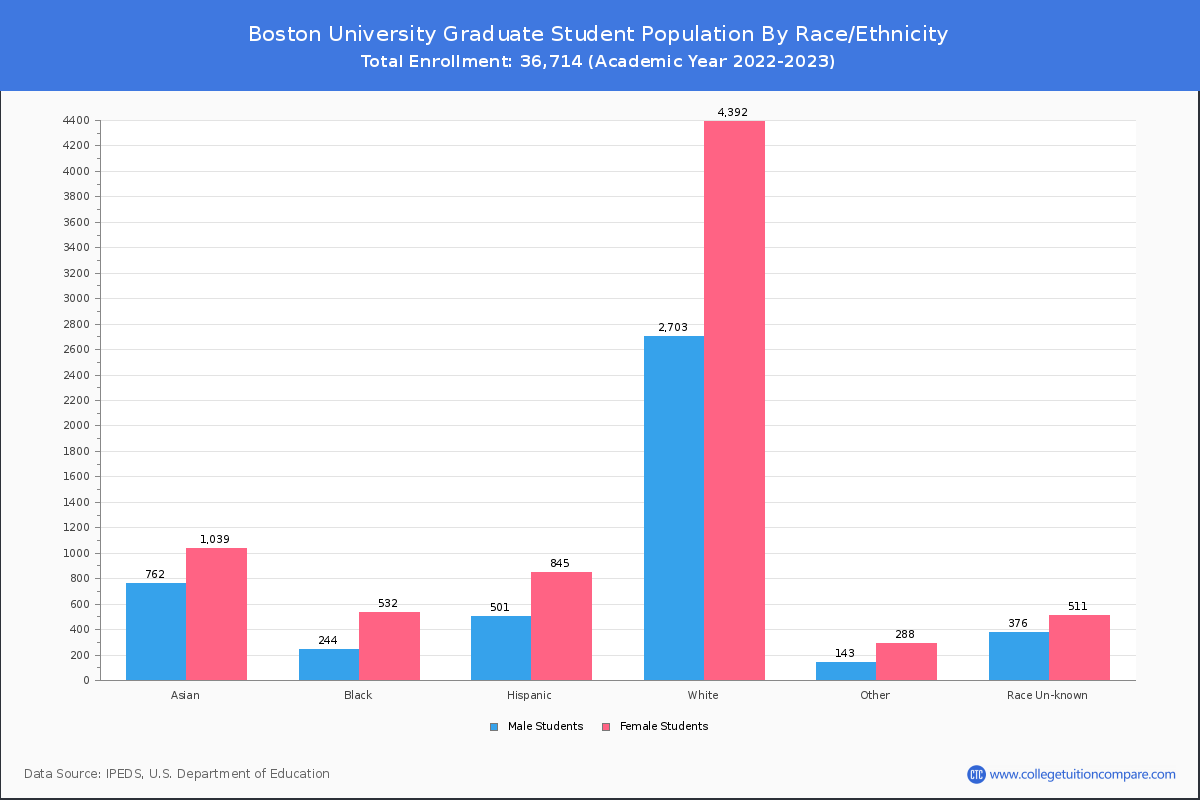
Student Distribution by Race/Ethnicity
By race/ethnicity, 12,654 White, 1,638 Black, and 5,418 Asian students out of a total of 36,714 are attending at Boston University. Comprehensive enrollment statistic data by race/ethnicity is shown in the next chart (Academic year 2022-2023 data).
| Race | Total | Men | Women |
|---|---|---|---|
| American Indian or Native American | 19 | 6 | 13 |
| Asian | 5,418 | 2,428 | 2,990 |
| Black | 1,638 | 477 | 1,161 |
| Hispanic | 3,298 | 1,195 | 2,103 |
| Native Hawaiian or Other Pacific Islanders | 27 | 7 | 20 |
| White | 12,654 | 4,901 | 7,753 |
| Two or more races | 1,260 | 478 | 782 |
| Race Unknown | 1,848 | 858 | 990 |
| Race | Total | Men | Women |
|---|---|---|---|
| American Indian or Native American | 6 | 2 | 4 |
| Asian | 3,541 | 1,644 | 1,897 |
| Black | 900 | 243 | 657 |
| Hispanic | 1,930 | 708 | 1,222 |
| Native Hawaiian or Other Pacific Islanders | 14 | 5 | 9 |
| White | 6,085 | 2,403 | 3,682 |
| Two or more races | 824 | 316 | 508 |
| Race Unknown | 984 | 499 | 485 |
| Race | Total | Men | Women |
|---|---|---|---|
| American Indian or Native American | 1 | 0 | 1 |
| Asian | 141 | 71 | 70 |
| Black | 25 | 9 | 16 |
| Hispanic | 66 | 24 | 42 |
| Native Hawaiian or Other Pacific Islanders | 0 | 0 | 0 |
| White | 275 | 90 | 185 |
| Two or more races | 28 | 7 | 21 |
| Race Unknown | 25 | 13 | 12 |
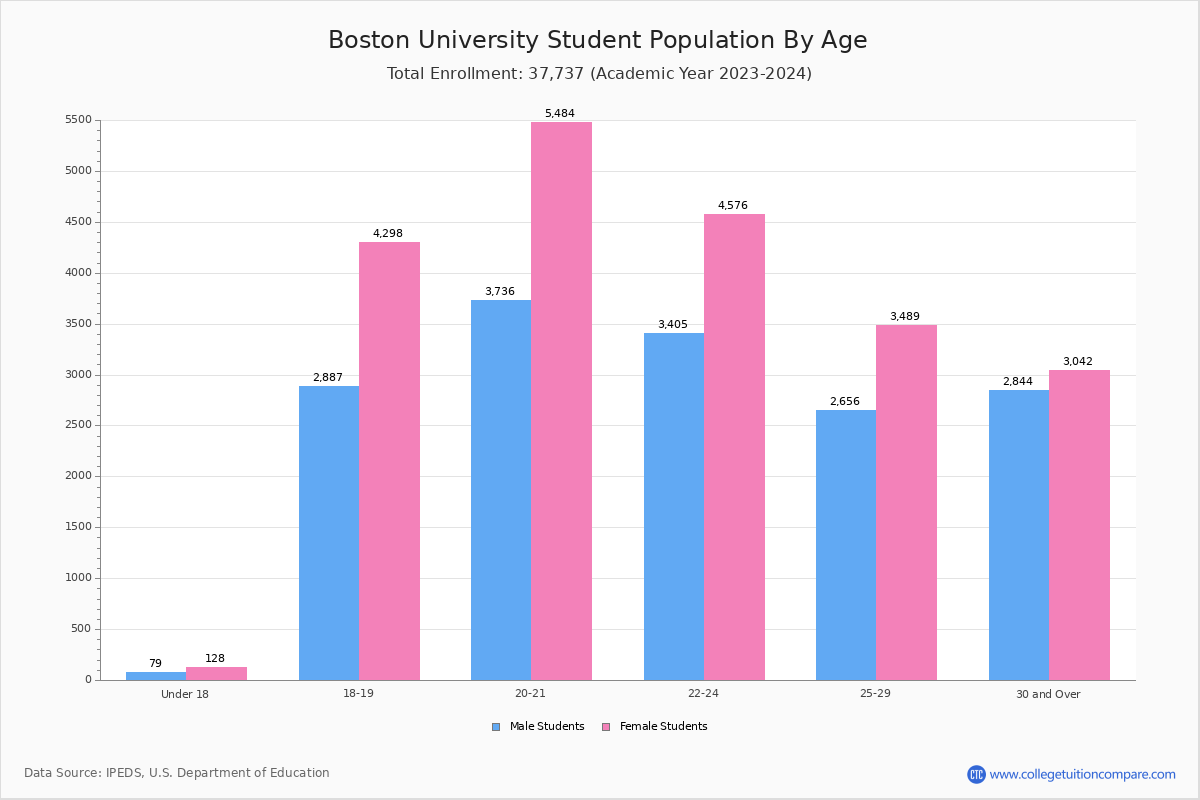
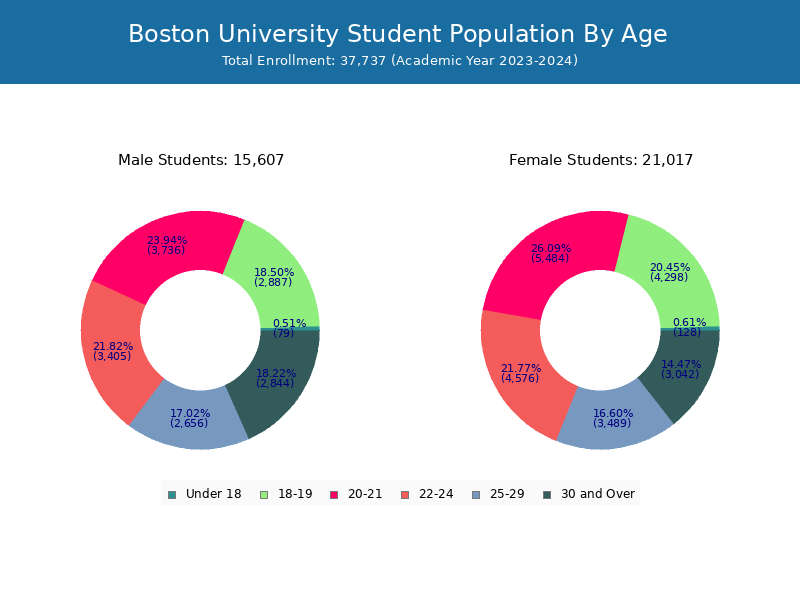
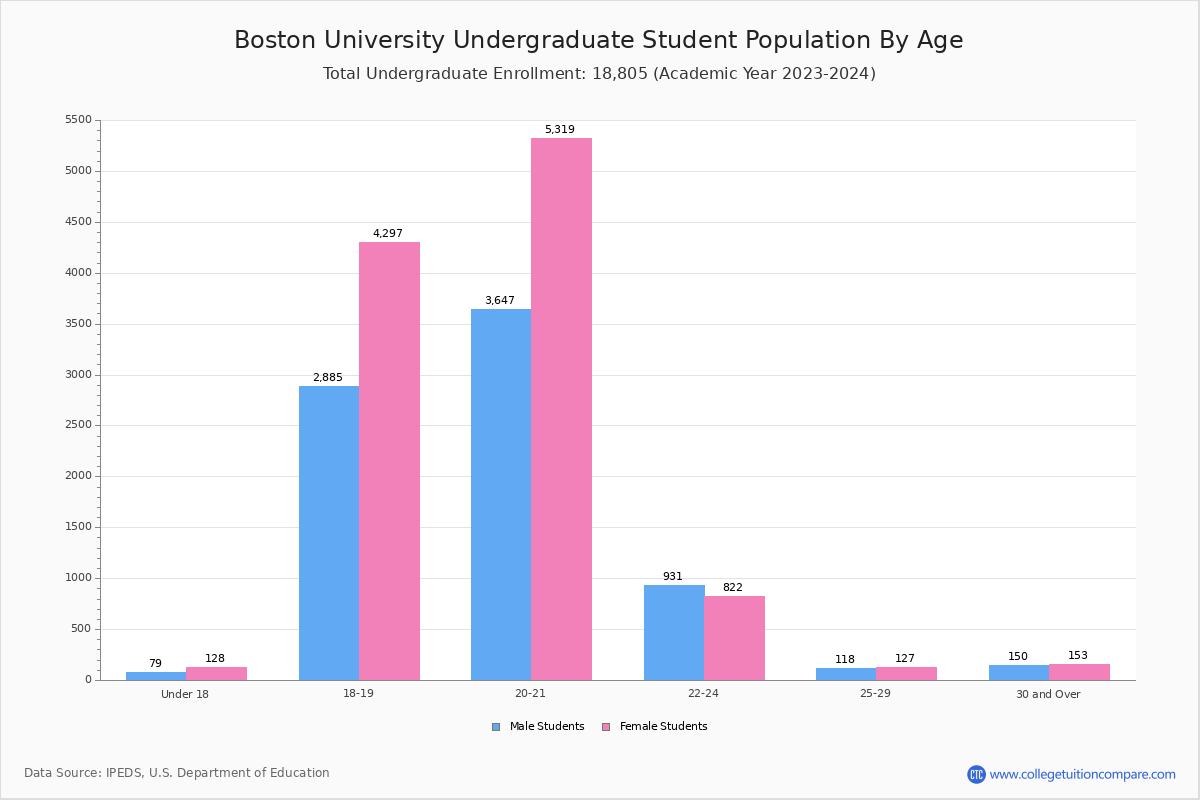
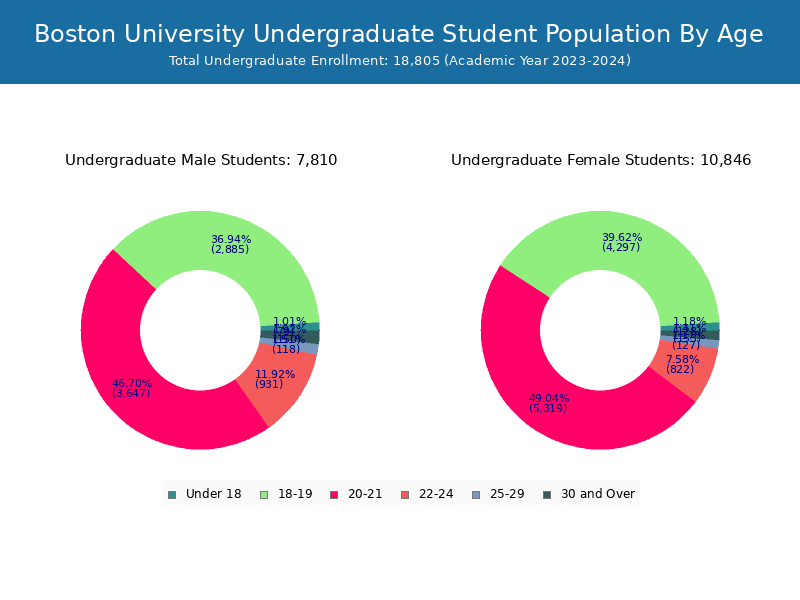
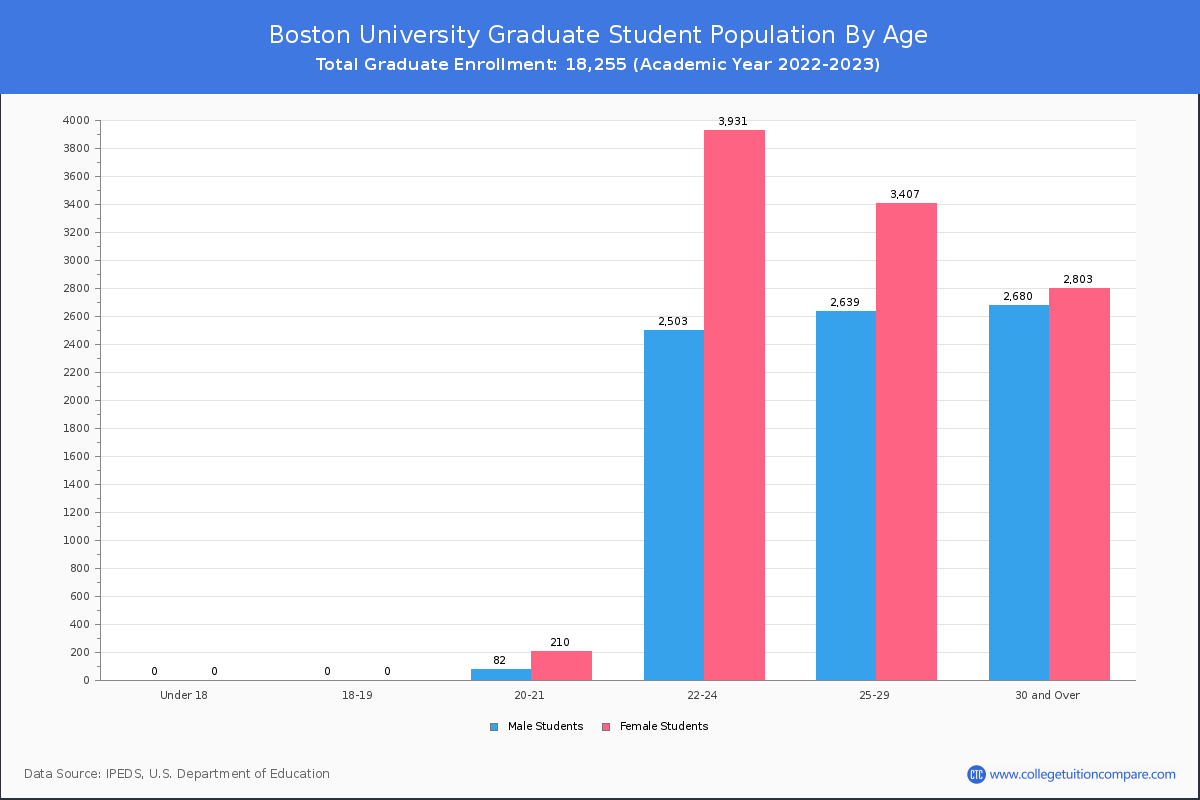
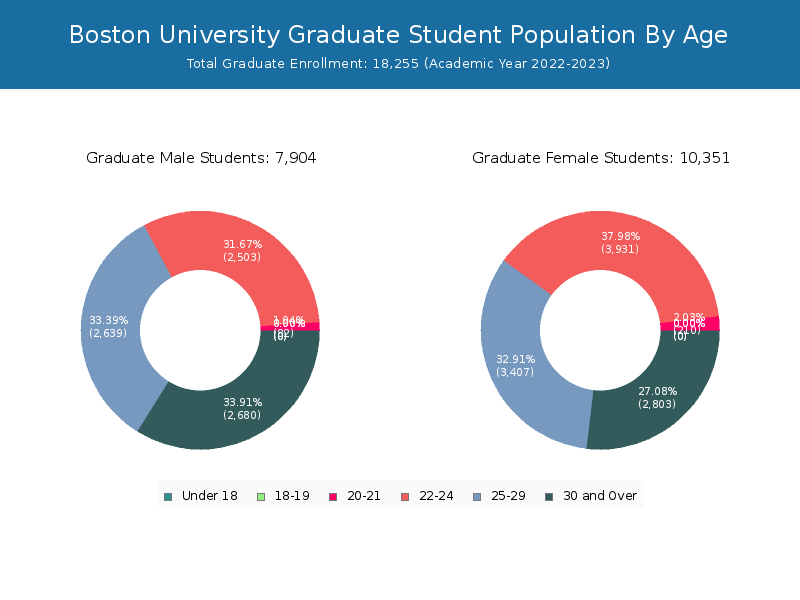
Student Age Distribution
By age, BU has 275 students under 18 years old and 97 students over 65 years old. There are 24,673 students under 25 years old, and 12,040 students over 25 years old out of 36,714 total students.
In undergraduate programs, 275 students are younger than 18 and 74 students are older than 65. BU has 17,947 undergraduate students aged under 25 and 511 students aged 25 and over.
It has 6,726 graduate students aged under 25 and 11,529 students aged 25 and over.
| Age | Total | Men | Women |
|---|---|---|---|
| Under 18 | 275 | 166 | 109 |
| 18-19 | 7,536 | 4,467 | 3,069 |
| 20-21 | 8,563 | 5,198 | 3,365 |
| 22-24 | 8,299 | 4,788 | 3,511 |
| 25-29 | 6,267 | 3,503 | 2,764 |
| 30-34 | 2,635 | 1,373 | 1,262 |
| 35-39 | 1,363 | 649 | 714 |
| 40-49 | 1,243 | 626 | 617 |
| 50-64 | 435 | 252 | 183 |
| Over 65 | 97 | 45 | 52 |
| Age | Total | Men | Women |
|---|---|---|---|
| Under 18 | 275 | 166 | 109 |
| 18-19 | 7,536 | 4,467 | 3,069 |
| 20-21 | 8,271 | 4,988 | 3,283 |
| 22-24 | 1,865 | 857 | 1,008 |
| 25-29 | 221 | 96 | 125 |
| 30-34 | 74 | 38 | 36 |
| 35-39 | 49 | 22 | 27 |
| 40-49 | 53 | 28 | 25 |
| 50-64 | 40 | 22 | 18 |
| Over 65 | 74 | 32 | 42 |
| Age | Total | Men | Women |
|---|
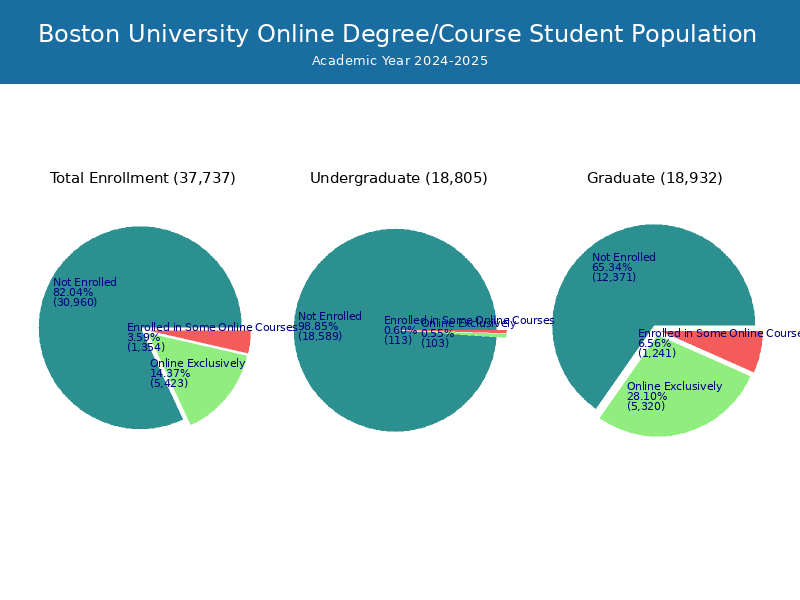
Online Student Enrollment
Distance learning, also called online education, is very attractive to students, especially who want to continue education and work in field. At Boston University, 4,044 students are enrolled exclusively in online courses and 1,213 students are enrolled in some online courses.
820 students lived in Massachusetts or jurisdiction in which the school is located are enrolled exclusively in online courses and 3,224 students live in other State or outside of the United States.
| All Students | Enrolled Exclusively Online Courses | Enrolled in Some Online Courses | |
|---|---|---|---|
| All Students | 36,714 | 4,044 | 1,213 |
| Undergraduate | 18,459 | 98 | 90 |
| Graduate | 18,255 | 3,946 | 1,123 |
| Massachusetts Residents | Other States in U.S. | Outside of U.S. | |
|---|---|---|---|
| All Students | 820 | 3,224 | 0 |
| Undergraduate | 28 | 70 | 0 |
| Graduate | 792 | 3,154 | 0 |
Transfer-in Students (Undergraduate)
Among 18,459 enrolled in undergraduate programs, 681 students have transferred-in from other institutions. The percentage of transfer-in students is 3.69%.680 students have transferred in as full-time status and 1 students transferred in as part-time status.
| Number of Students | |
|---|---|
| Regular Full-time | 17,054 |
| Transfer-in Full-time | 680 |
| Regular Part-time | 724 |
| Transfer-in Part-time | 1 |