Student Population by Gender
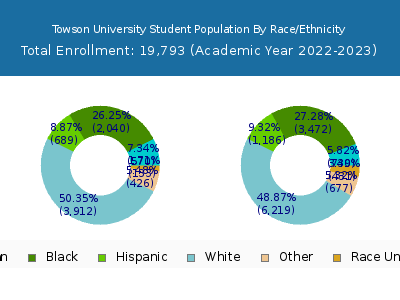
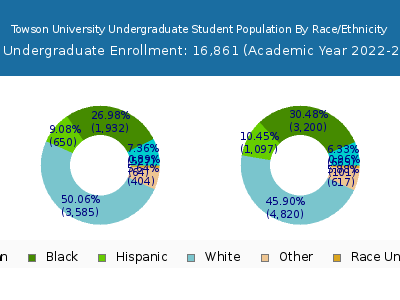
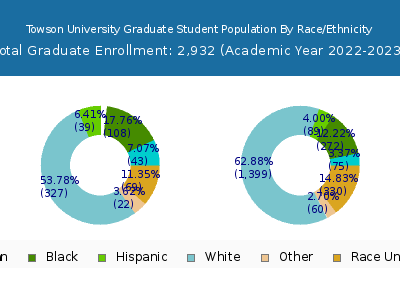
Towson University has a total of 19,793 enrolled students for the academic year 2022-2023. 16,861 students have enrolled in undergraduate programs and 2,932 students joined graduate programs.
By gender, 7,642 male and 12,151 female students (the male-female ratio is 39:61) are attending the school. The gender distribution is based on the 2022-2023 data.
| Total | Undergraduate | Graduate | |
|---|---|---|---|
| Total | 19,793 | 16,861 | 2,932 |
| Men | 7,642 | 6,978 | 664 |
| Women | 12,151 | 9,883 | 2,268 |
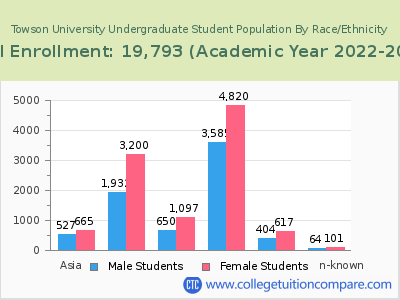
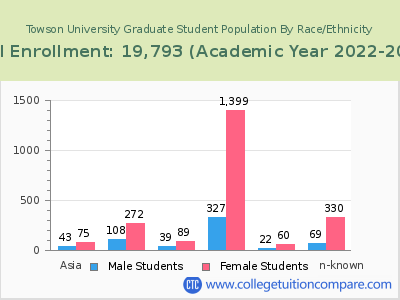
Student Distribution by Race/Ethnicity
| Race | Total | Men | Women |
|---|---|---|---|
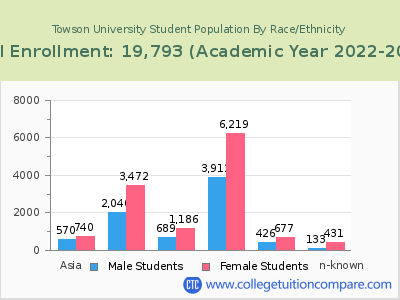
| American Indian or Native American | 18 | 11 | 7 |
| Asian | 1,277 | 573 | 704 |
| Black | 5,524 | 2,109 | 3,415 |
| Hispanic | 1,874 | 696 | 1,178 |
| Native Hawaiian or Other Pacific Islanders | 10 | 5 | 5 |
| White | 9,075 | 3,534 | 5,541 |
| Two or more races | 1,021 | 401 | 620 |
| Race Unknown | 601 | 143 | 458 |
| Race | Total | Men | Women |
|---|---|---|---|
| American Indian or Native American | 17 | 10 | 7 |
| Asian | 1,149 | 520 | 629 |
| Black | 5,129 | 1,998 | 3,131 |
| Hispanic | 1,726 | 656 | 1,070 |
| Native Hawaiian or Other Pacific Islanders | 9 | 4 | 5 |
| White | 7,450 | 3,230 | 4,220 |
| Two or more races | 928 | 379 | 549 |
| Race Unknown | 189 | 79 | 110 |
| Race | Total | Men | Women |
|---|---|---|---|
| American Indian or Native American | 3 | 3 | 0 |
| Asian | 125 | 59 | 66 |
| Black | 490 | 225 | 265 |
| Hispanic | 169 | 59 | 110 |
| Native Hawaiian or Other Pacific Islanders | 1 | 1 | 0 |
| White | 799 | 356 | 443 |
| Two or more races | 100 | 42 | 58 |
| Race Unknown | 24 | 8 | 16 |
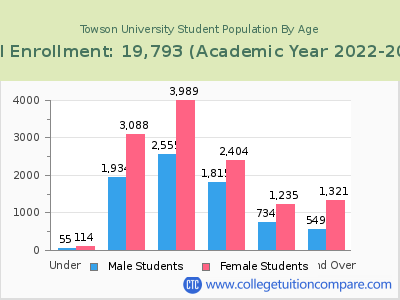
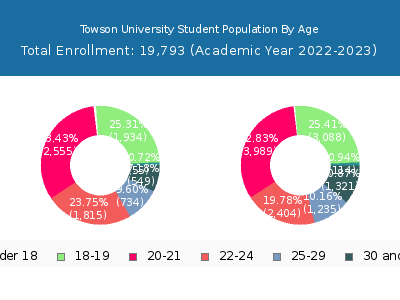
Student Age Distribution
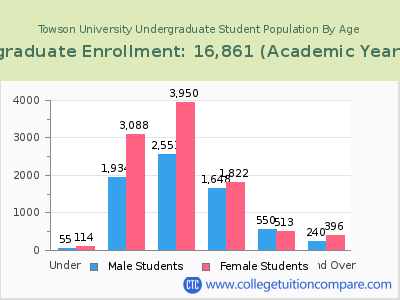
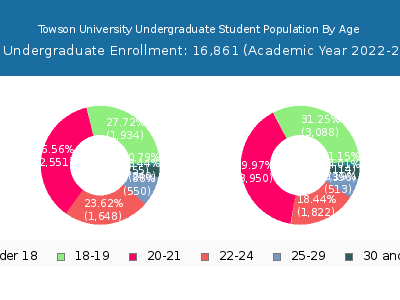
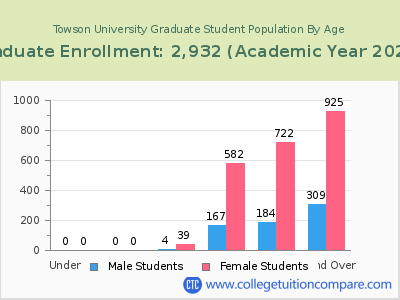
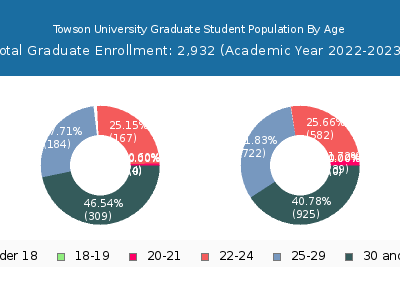
By age, Towson has 169 students under 18 years old and 29 students over 65 years old. There are 15,954 students under 25 years old, and 3,839 students over 25 years old out of 19,793 total students.
In undergraduate programs, 169 students are younger than 18 and 18 students are older than 65. Towson has 15,162 undergraduate students aged under 25 and 1,699 students aged 25 and over.
It has 792 graduate students aged under 25 and 2,140 students aged 25 and over.
| Age | Total | Men | Women |
|---|---|---|---|
| Under 18 | 169 | 114 | 55 |
| 18-19 | 5,022 | 3,088 | 1,934 |
| 20-21 | 6,544 | 3,989 | 2,555 |
| 22-24 | 4,219 | 2,404 | 1,815 |
| 25-29 | 1,969 | 1,235 | 734 |
| 30-34 | 734 | 483 | 251 |
| 35-39 | 413 | 285 | 128 |
| 40-49 | 497 | 382 | 115 |
| 50-64 | 197 | 151 | 46 |
| Over 65 | 29 | 20 | 9 |
| Age | Total | Men | Women |
|---|---|---|---|
| Under 18 | 169 | 114 | 55 |
| 18-19 | 5,022 | 3,088 | 1,934 |
| 20-21 | 6,501 | 3,950 | 2,551 |
| 22-24 | 3,470 | 1,822 | 1,648 |
| 25-29 | 1,063 | 513 | 550 |
| 30-34 | 308 | 181 | 127 |
| 35-39 | 147 | 97 | 50 |
| 40-49 | 120 | 83 | 37 |
| 50-64 | 43 | 23 | 20 |
| Over 65 | 18 | 12 | 6 |
| Age | Total | Men | Women |
|---|
Online Student Enrollment
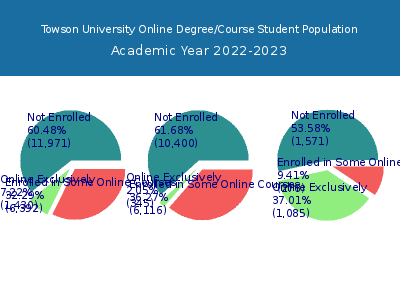
Distance learning, also called online education, is very attractive to students, especially who want to continue education and work in field. At Towson University, 1,430 students are enrolled exclusively in online courses and 6,392 students are enrolled in some online courses.
1,389 students lived in Maryland or jurisdiction in which the school is located are enrolled exclusively in online courses and 41 students live in other State or outside of the United States.
| All Students | Enrolled Exclusively Online Courses | Enrolled in Some Online Courses | |
|---|---|---|---|
| All Students | 19,793 | 1,430 | 6,392 |
| Undergraduate | 16,861 | 345 | 6,116 |
| Graduate | 2,932 | 1,085 | 276 |
| Maryland Residents | Other States in U.S. | Outside of U.S. | |
|---|---|---|---|
| All Students | 1,389 | 41 | 0 |
| Undergraduate | 341 | 4 | 0 |
| Graduate | 1,048 | 37 | 0 |
Transfer-in Students (Undergraduate)
Among 16,861 enrolled in undergraduate programs, 1,747 students have transferred-in from other institutions. The percentage of transfer-in students is 10.36%.1,524 students have transferred in as full-time status and 223 students transferred in as part-time status.
| Number of Students | |
|---|---|
| Regular Full-time | 13,281 |
| Transfer-in Full-time | 1,524 |
| Regular Part-time | 1,833 |
| Transfer-in Part-time | 223 |
