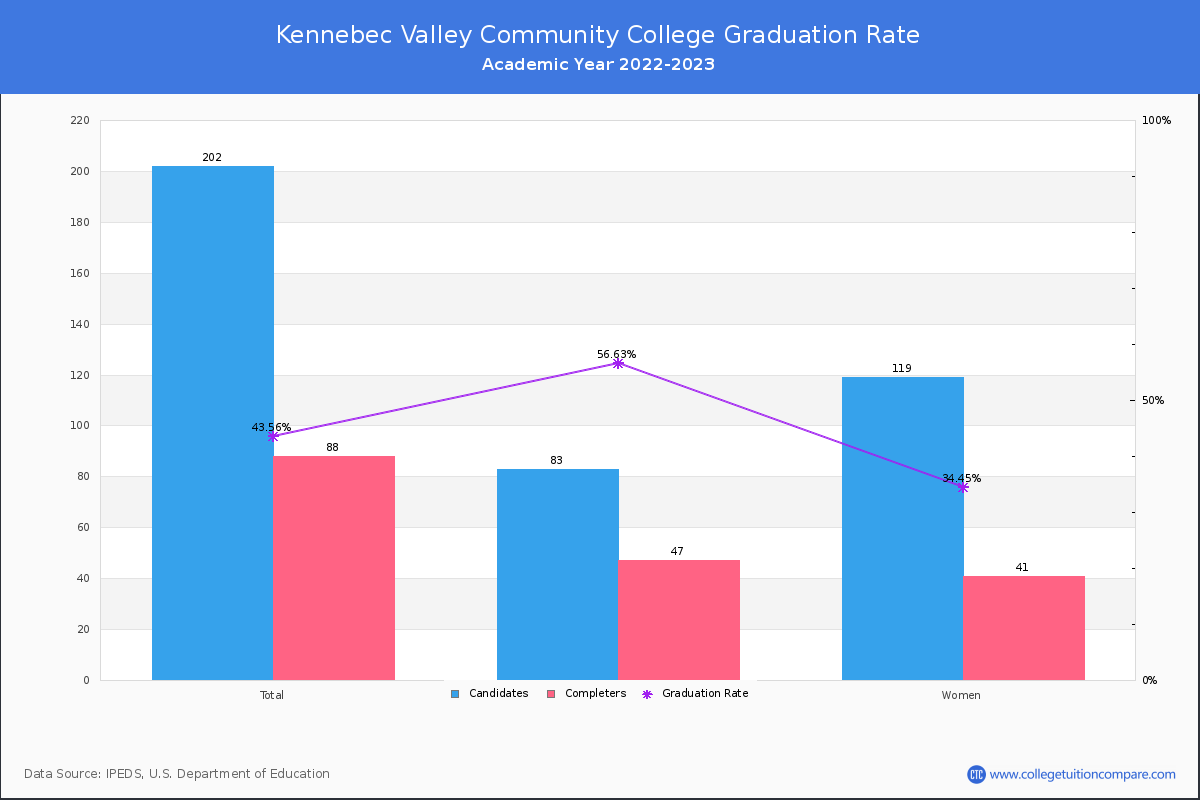
Graduation Rates in Reasonable Completion Time
For the academic year 2022-2023, 88 students out of 202 candidates have completed their courses within 150% normal time (i.e. in 3 years for 2-year Associate degree) at Kennebec Valley Community College.
By gender, 47 male and 41 female students graduated the school last year completing their jobs in the period. Its graduation rate is higher than the average rate when comparing similar colleges' rate of 34.56% (public special-use Associate's college).
| Candidates | Completers | Graduation Rates | |
|---|---|---|---|
| Total | 202 | 88 | 43.56% |
| Men | 83 | 47 | 56.63% |
| Women | 119 | 41 | 34.45% |
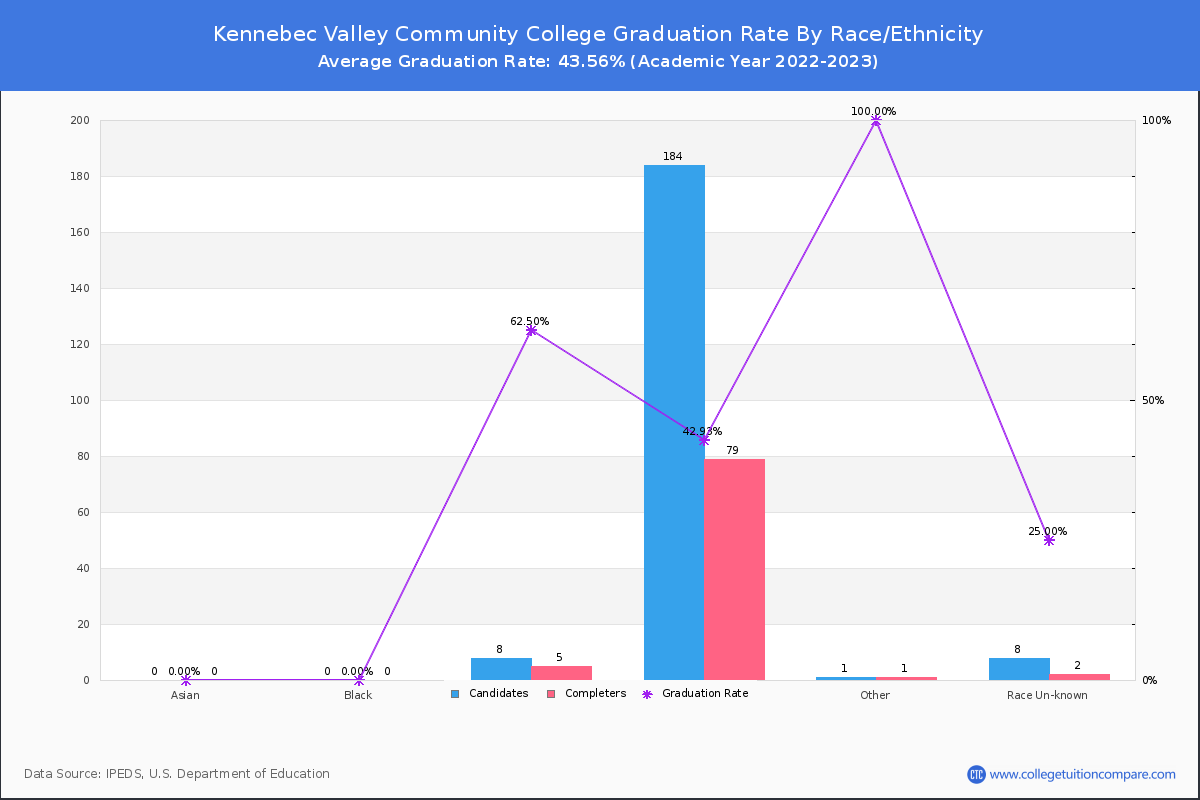
Graduation Rate By Race/Ethnicity
The following table shows graduation rate by race and at Kennebec Valley Community College.
- American Indian or Alaska Native: 100.00%
- Hispanic: 62.50%
- White: 42.93%
- Unknown: 25.00%
| Total | Male | Female | |
|---|---|---|---|
| American Indian or Alaska Native | 100.00%(1/1) | - | 100.00%(1/1) |
| Hispanic | 62.50%(5/8) | - | 62.50%(5/8) |
| White | 42.93%(79/184) | 57.14%(44/77) | 32.71%(35/107) |
| Unknown | 25.00%(2/8) | 40.00%(2/5) | - |
Transfer-out and Retention Rates
At Kennebec Valley CC, the transfer-out rate is 8.91%. Its transfer-out rate is lower than the average rate when comparing similar colleges' rate of 12.73%.
Kennebec Valley CC's retention rate is 52% for full-time students and 51 % for part-time students last year. Its retention rate is relatively lower than the average rate when comparing similar colleges' rate of 59.91%.
Non-Resident Alien Graduation Rate
A non-resident alien student is not a US citizen/green card holder and studies with a student visa, such as an F visa, in the United States. At Kennebec Valley Community College, 1 of 1 non-resident alien students completed their studies and the graduation rate was 100.00%.