Student Population by Gender
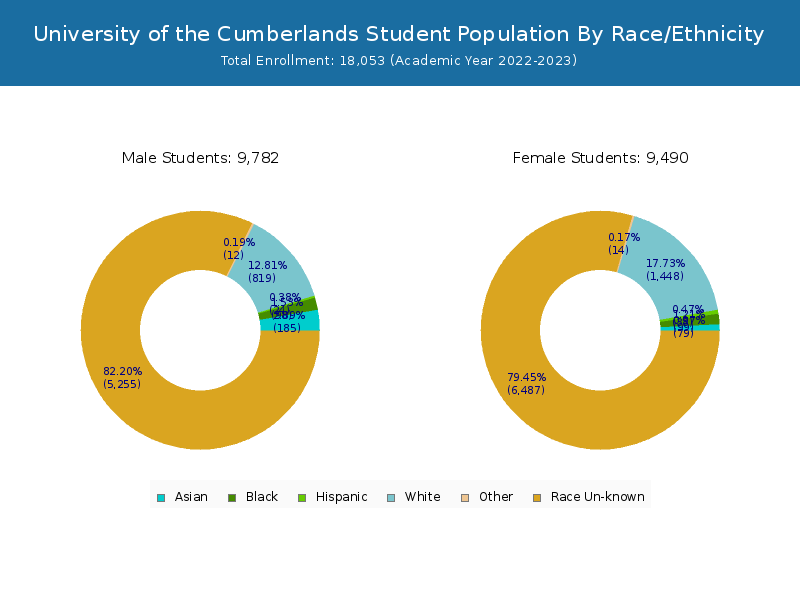
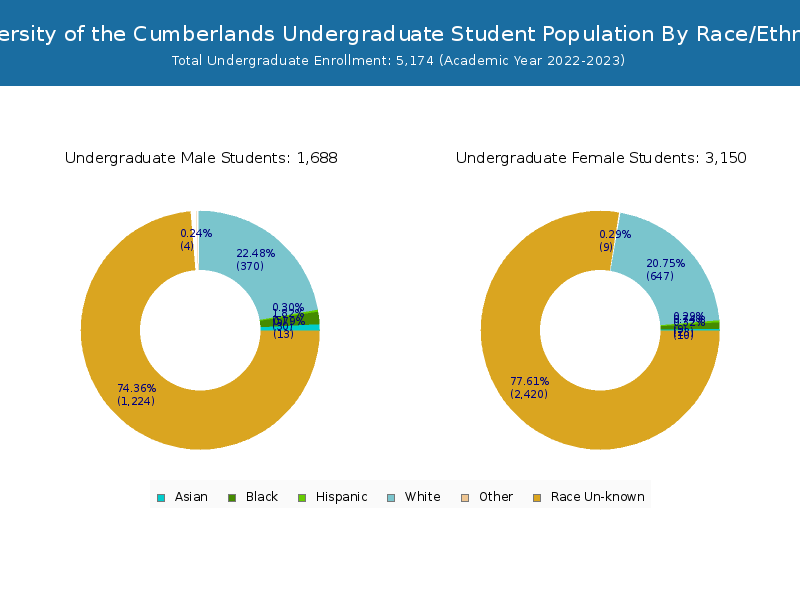
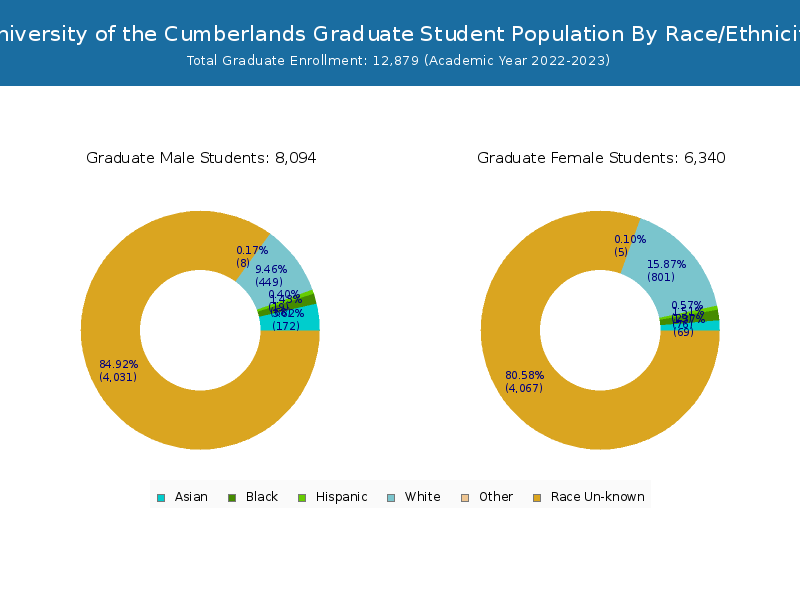
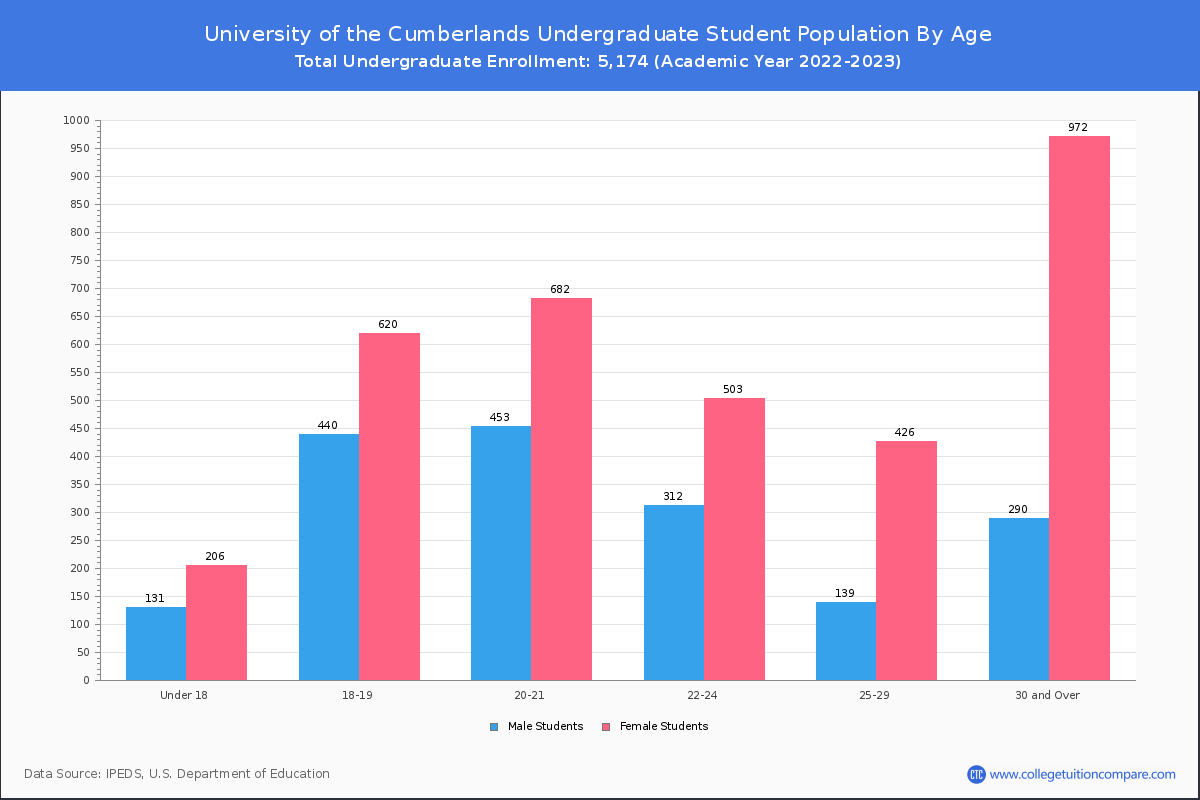
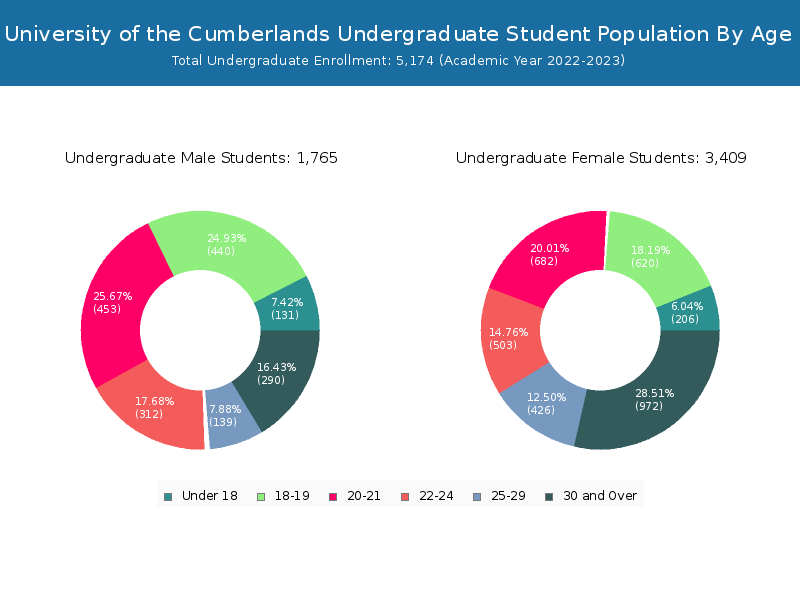
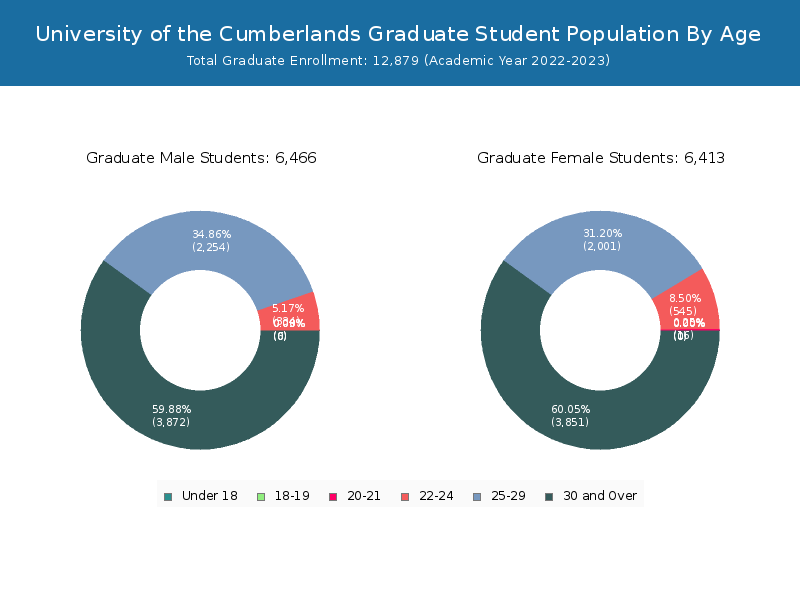
University of the Cumberlands has a total of 18,053 enrolled students for the academic year 2022-2023. 5,174 students have enrolled in undergraduate programs and 12,879 students joined graduate programs.
By gender, 8,231 male and 9,822 female students (the male-female ratio is 46:54) are attending the school. The gender distribution is based on the 2022-2023 data.
| Total | Undergraduate | Graduate | |
|---|---|---|---|
| Total | 18,053 | 5,174 | 12,879 |
| Men | 8,231 | 1,765 | 6,466 |
| Women | 9,822 | 3,409 | 6,413 |
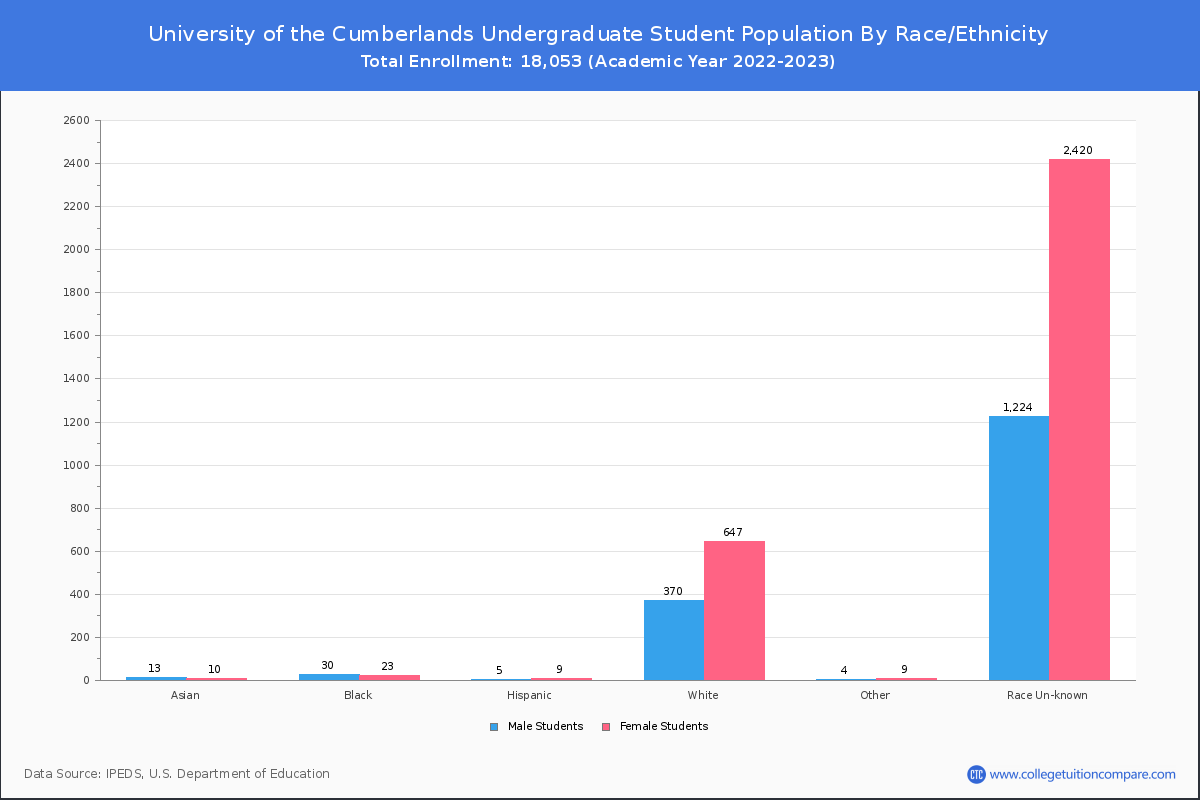
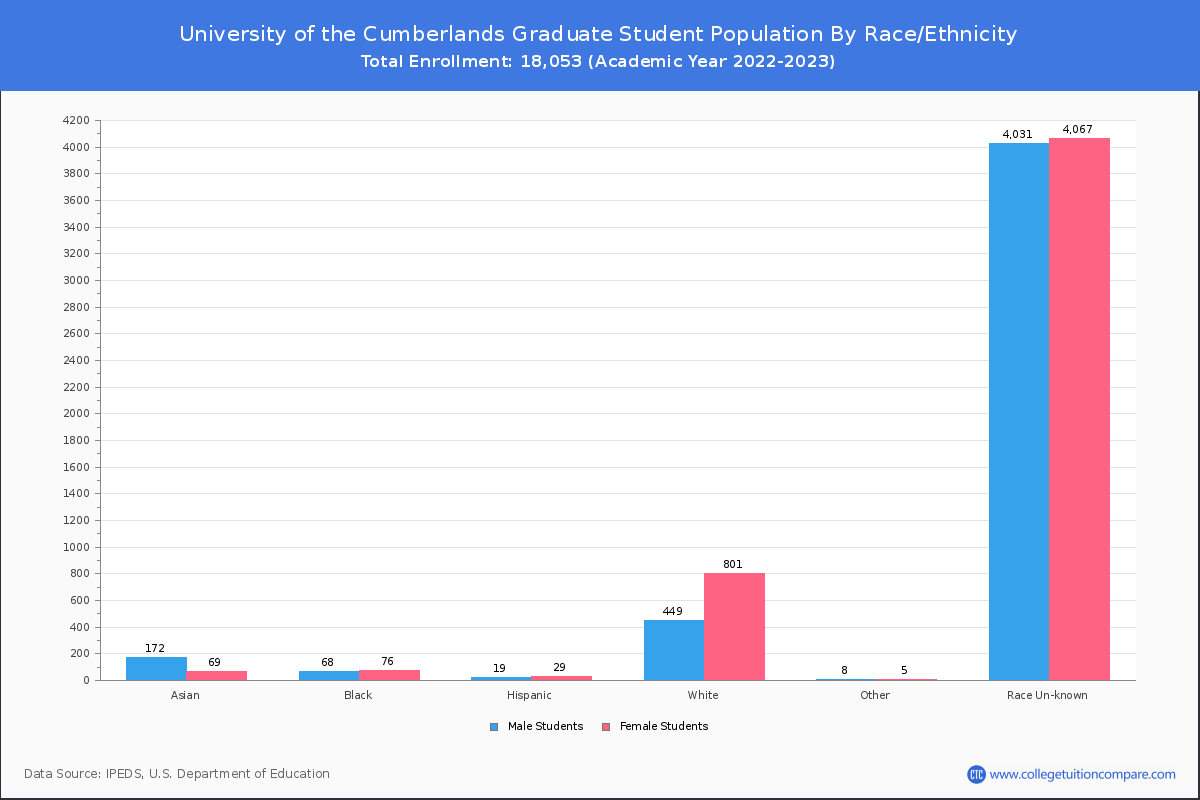
Student Distribution by Race/Ethnicity
By race/ethnicity, 4,078 White, 384 Black, and 941 Asian students out of a total of 18,053 are attending at University of the Cumberlands. Comprehensive enrollment statistic data by race/ethnicity is shown in the next chart (Academic year 2022-2023 data).
| Race | Total | Men | Women |
|---|---|---|---|
| American Indian or Native American | 30 | 10 | 20 |
| Asian | 941 | 587 | 354 |
| Black | 384 | 201 | 183 |
| Hispanic | 71 | 32 | 39 |
| Native Hawaiian or Other Pacific Islanders | 14 | 4 | 10 |
| White | 4,078 | 1,365 | 2,713 |
| Two or more races | 4 | 1 | 3 |
| Race Unknown | 8,305 | 3,182 | 5,123 |
| Race | Total | Men | Women |
|---|---|---|---|
| American Indian or Native American | 11 | 2 | 9 |
| Asian | 34 | 22 | 12 |
| Black | 132 | 85 | 47 |
| Hispanic | 29 | 16 | 13 |
| Native Hawaiian or Other Pacific Islanders | 10 | 3 | 7 |
| White | 2,096 | 740 | 1,356 |
| Two or more races | 3 | 1 | 2 |
| Race Unknown | 2,801 | 869 | 1,932 |
| Race | Total | Men | Women |
|---|---|---|---|
| American Indian or Native American | 1 | 0 | 1 |
| Asian | 9 | 7 | 2 |
| Black | 38 | 18 | 20 |
| Hispanic | 0 | 0 | 0 |
| Native Hawaiian or Other Pacific Islanders | 1 | 1 | 0 |
| White | 555 | 129 | 426 |
| Two or more races | 0 | 0 | 0 |
| Race Unknown | 61 | 12 | 49 |
Student Age Distribution
By age, U of the Cumberlands has 337 students under 18 years old and 49 students over 65 years old. There are 4,248 students under 25 years old, and 13,805 students over 25 years old out of 18,053 total students.
In undergraduate programs, 337 students are younger than 18 and 9 students are older than 65. U of the Cumberlands has 3,347 undergraduate students aged under 25 and 1,827 students aged 25 and over.
It has 901 graduate students aged under 25 and 11,978 students aged 25 and over.
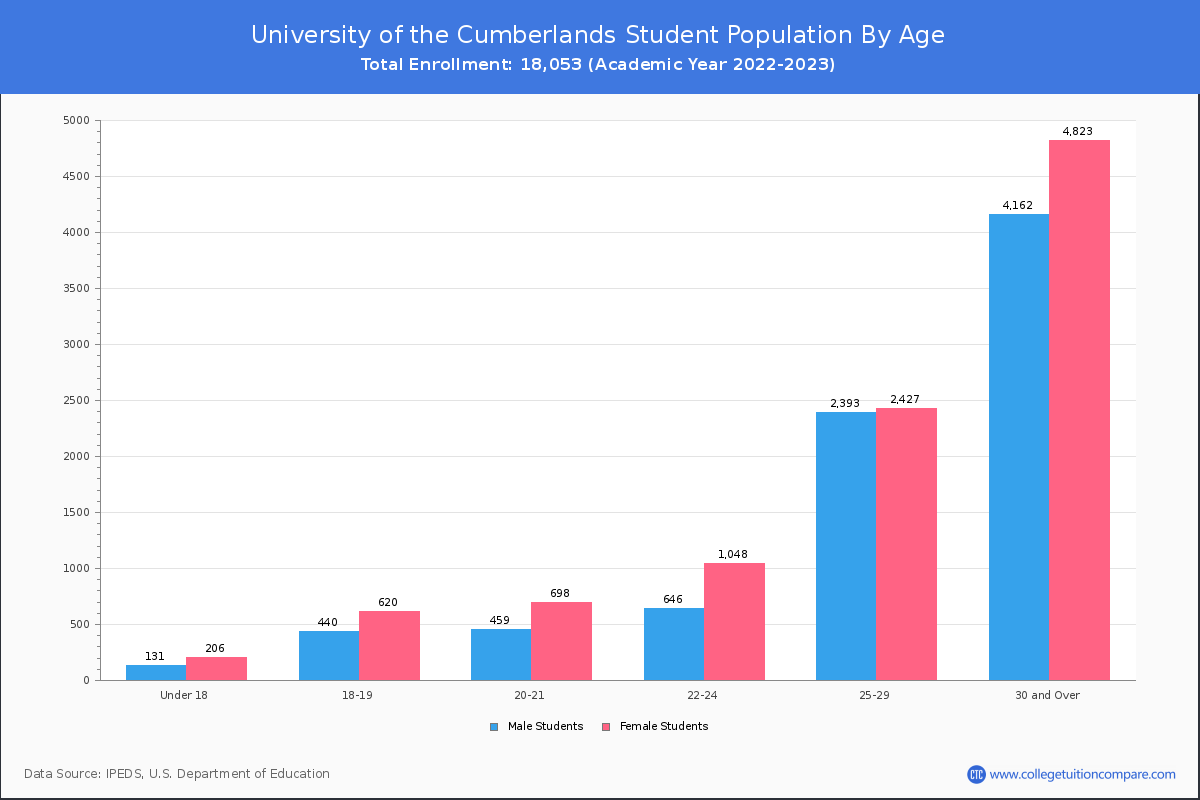
| Age | Total | Men | Women |
|---|---|---|---|
| Under 18 | 337 | 206 | 131 |
| 18-19 | 1,060 | 620 | 440 |
| 20-21 | 1,157 | 698 | 459 |
| 22-24 | 1,694 | 1,048 | 646 |
| 25-29 | 4,820 | 2,427 | 2,393 |
| 30-34 | 4,173 | 1,926 | 2,247 |
| 35-39 | 1,821 | 1,065 | 756 |
| 40-49 | 2,094 | 1,322 | 772 |
| 50-64 | 848 | 490 | 358 |
| Over 65 | 49 | 20 | 29 |
| Age | Total | Men | Women |
|---|---|---|---|
| Under 18 | 337 | 206 | 131 |
| 18-19 | 1,060 | 620 | 440 |
| 20-21 | 1,135 | 682 | 453 |
| 22-24 | 815 | 503 | 312 |
| 25-29 | 565 | 426 | 139 |
| 30-34 | 478 | 388 | 90 |
| 35-39 | 317 | 236 | 81 |
| 40-49 | 350 | 268 | 82 |
| 50-64 | 108 | 74 | 34 |
| Over 65 | 9 | 6 | 3 |
| Age | Total | Men | Women |
|---|
Online Student Enrollment
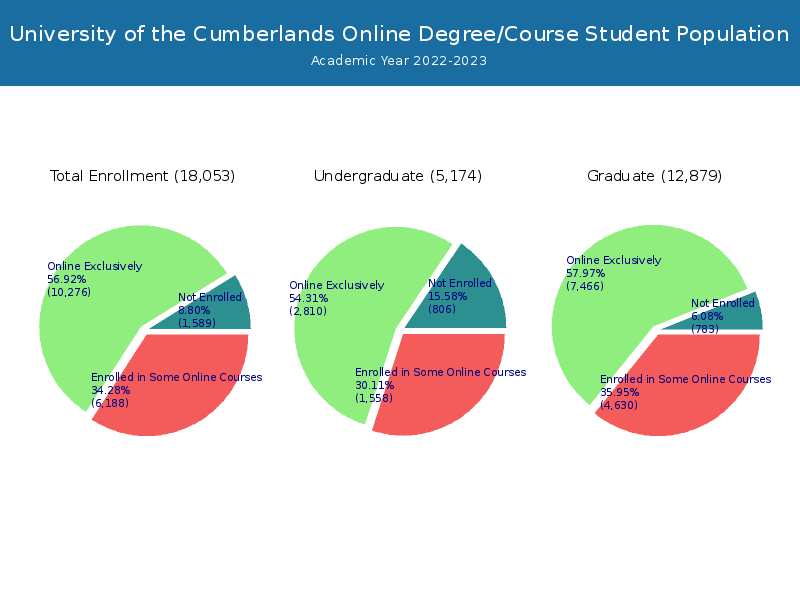
Distance learning, also called online education, is very attractive to students, especially who want to continue education and work in field. At University of the Cumberlands, 10,276 students are enrolled exclusively in online courses and 6,188 students are enrolled in some online courses.
6,388 students lived in Kentucky or jurisdiction in which the school is located are enrolled exclusively in online courses and 3,888 students live in other State or outside of the United States.
| All Students | Enrolled Exclusively Online Courses | Enrolled in Some Online Courses | |
|---|---|---|---|
| All Students | 18,053 | 10,276 | 6,188 |
| Undergraduate | 5,174 | 2,810 | 1,558 |
| Graduate | 12,879 | 7,466 | 4,630 |
| Kentucky Residents | Other States in U.S. | Outside of U.S. | |
|---|---|---|---|
| All Students | 6,388 | 3,837 | 51 |
| Undergraduate | 2,343 | 459 | 8 |
| Graduate | 4,045 | 3,378 | 43 |
Transfer-in Students (Undergraduate)
Among 5,174 enrolled in undergraduate programs, 665 students have transferred-in from other institutions. The percentage of transfer-in students is 12.85%.480 students have transferred in as full-time status and 185 students transferred in as part-time status.
| Number of Students | |
|---|---|
| Regular Full-time | 3,414 |
| Transfer-in Full-time | 480 |
| Regular Part-time | 1,095 |
| Transfer-in Part-time | 185 |