Student Population by Gender
Wichita State University has a total of 16,216 enrolled students for the academic year 2022-2023. 12,049 students have enrolled in undergraduate programs and 4,167 students joined graduate programs.
By gender, 7,220 male and 8,996 female students (the male-female ratio is 45:55) are attending the school. The gender distribution is based on the 2022-2023 data.
| Total | Undergraduate | Graduate | |
|---|---|---|---|
| Total | 16,216 | 12,049 | 4,167 |
| Men | 7,220 | 5,257 | 1,963 |
| Women | 8,996 | 6,792 | 2,204 |
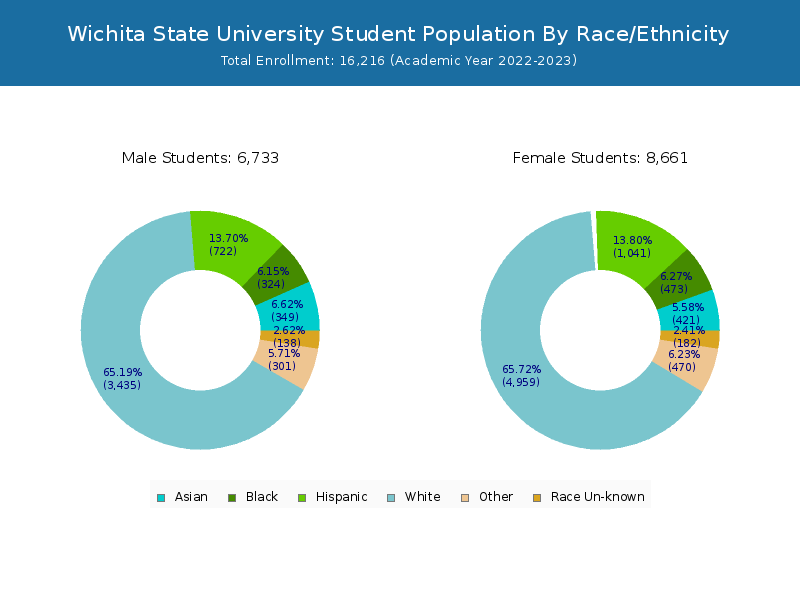
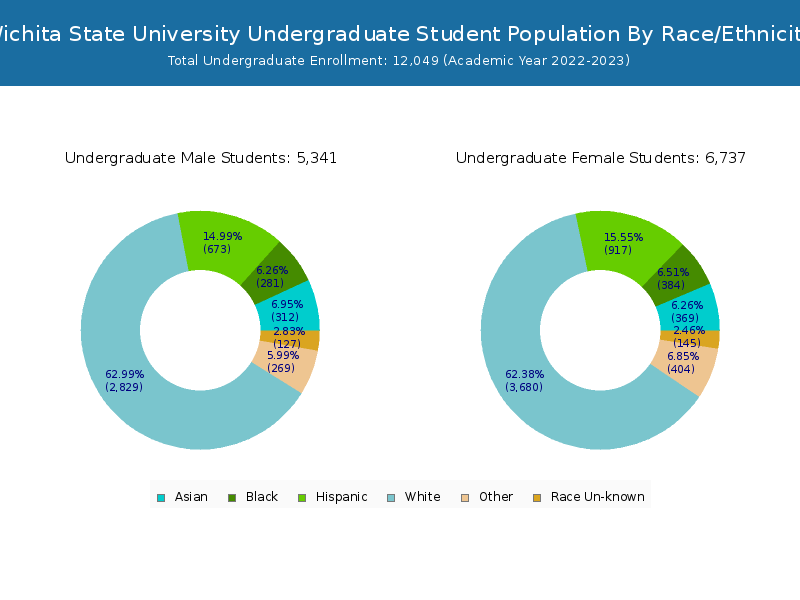
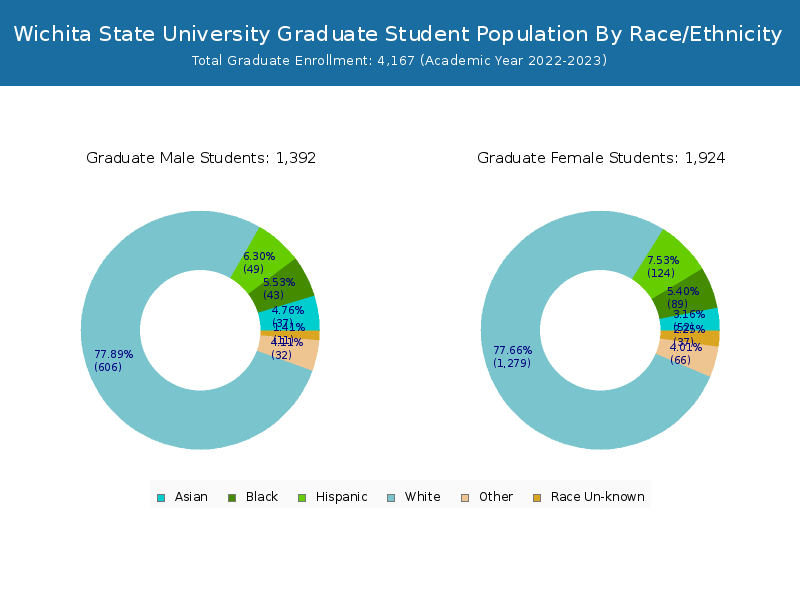
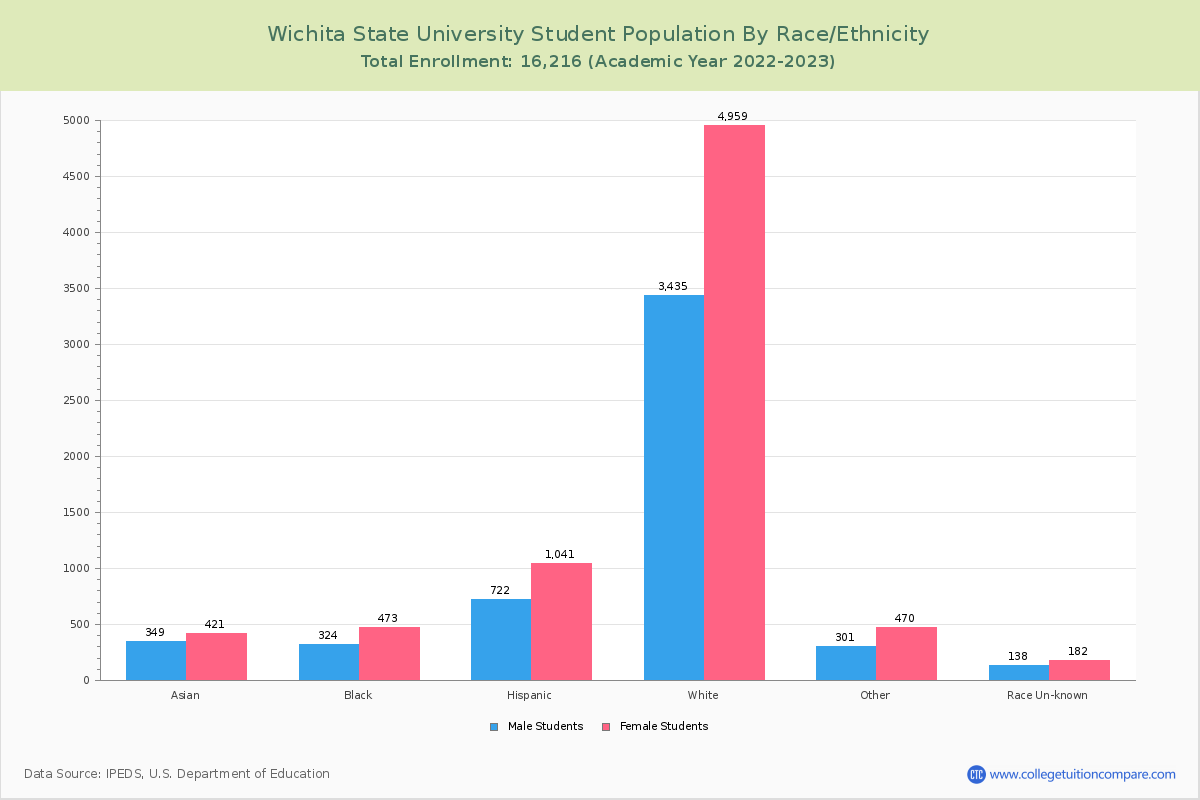
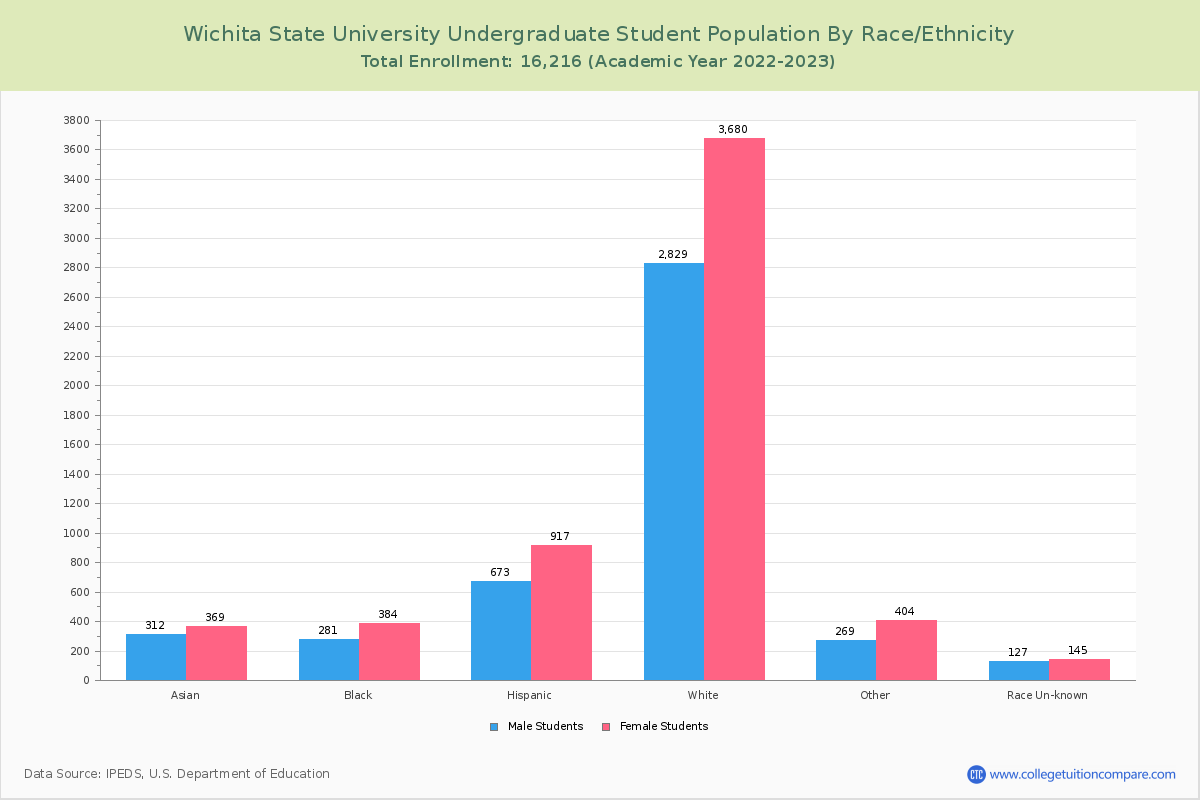
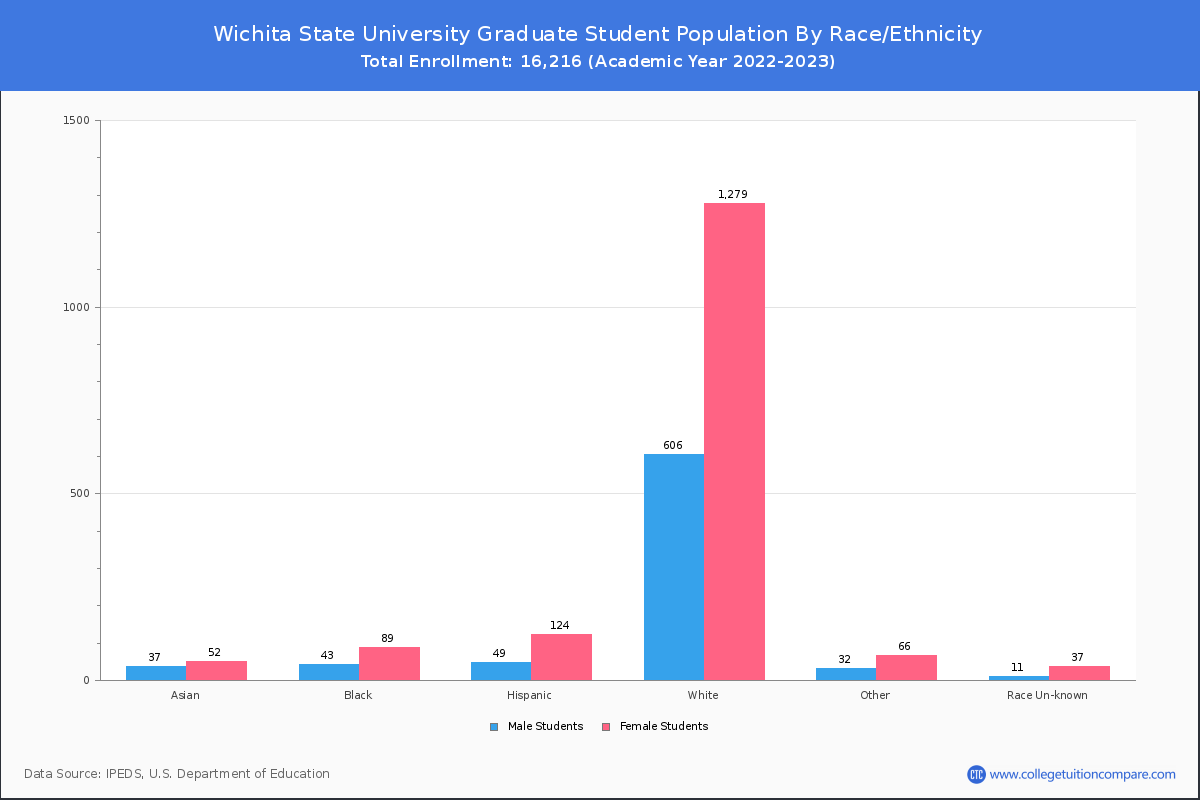
Student Distribution by Race/Ethnicity
By race/ethnicity, 8,139 White, 843 Black, and 956 Asian students out of a total of 16,216 are attending at Wichita State University. Comprehensive enrollment statistic data by race/ethnicity is shown in the next chart (Academic year 2022-2023 data).
| Race | Total | Men | Women |
|---|---|---|---|
| American Indian or Native American | 92 | 30 | 62 |
| Asian | 956 | 450 | 506 |
| Black | 843 | 327 | 516 |
| Hispanic | 2,027 | 826 | 1,201 |
| Native Hawaiian or Other Pacific Islanders | 17 | 7 | 10 |
| White | 8,139 | 3,290 | 4,849 |
| Two or more races | 682 | 260 | 422 |
| Race Unknown | 341 | 141 | 200 |
| Race | Total | Men | Women |
|---|---|---|---|
| American Indian or Native American | 77 | 25 | 52 |
| Asian | 850 | 401 | 449 |
| Black | 698 | 280 | 418 |
| Hispanic | 1,823 | 774 | 1,049 |
| Native Hawaiian or Other Pacific Islanders | 15 | 7 | 8 |
| White | 6,313 | 2,709 | 3,604 |
| Two or more races | 592 | 226 | 366 |
| Race Unknown | 287 | 123 | 164 |
| Race | Total | Men | Women |
|---|---|---|---|
| American Indian or Native American | 5 | 2 | 3 |
| Asian | 43 | 21 | 22 |
| Black | 65 | 25 | 40 |
| Hispanic | 219 | 90 | 129 |
| Native Hawaiian or Other Pacific Islanders | 1 | 0 | 1 |
| White | 751 | 252 | 499 |
| Two or more races | 67 | 25 | 42 |
| Race Unknown | 26 | 9 | 17 |
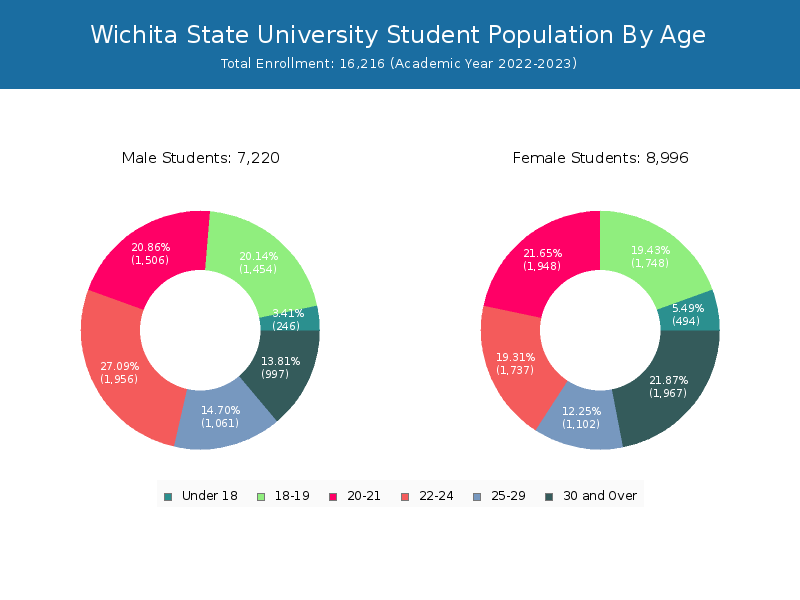
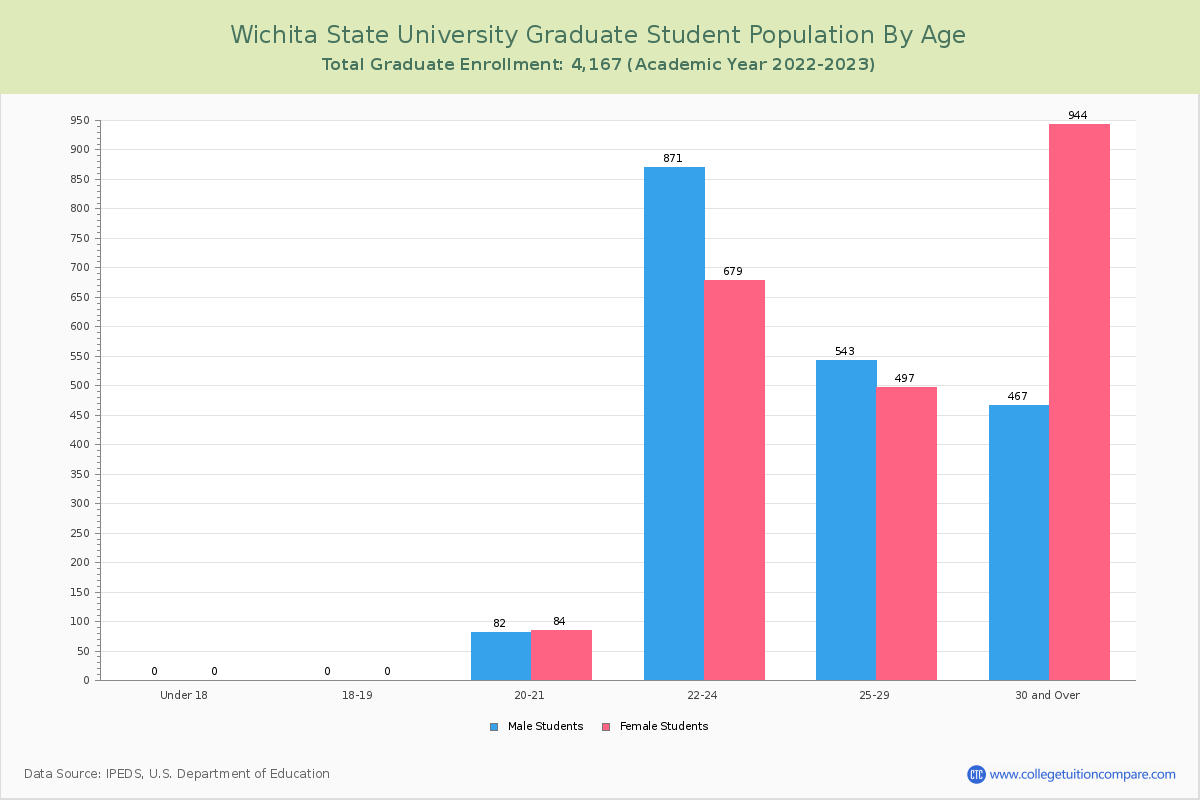
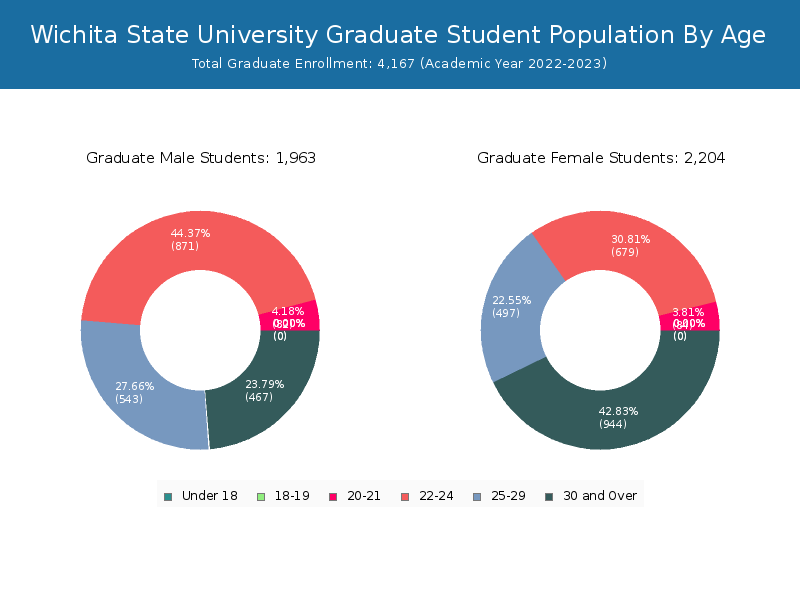
Student Age Distribution
By age, WSU has 740 students under 18 years old and 40 students over 65 years old. There are 11,089 students under 25 years old, and 5,127 students over 25 years old out of 16,216 total students.
In undergraduate programs, 740 students are younger than 18 and 19 students are older than 65. WSU has 9,373 undergraduate students aged under 25 and 2,676 students aged 25 and over.
It has 1,716 graduate students aged under 25 and 2,451 students aged 25 and over.
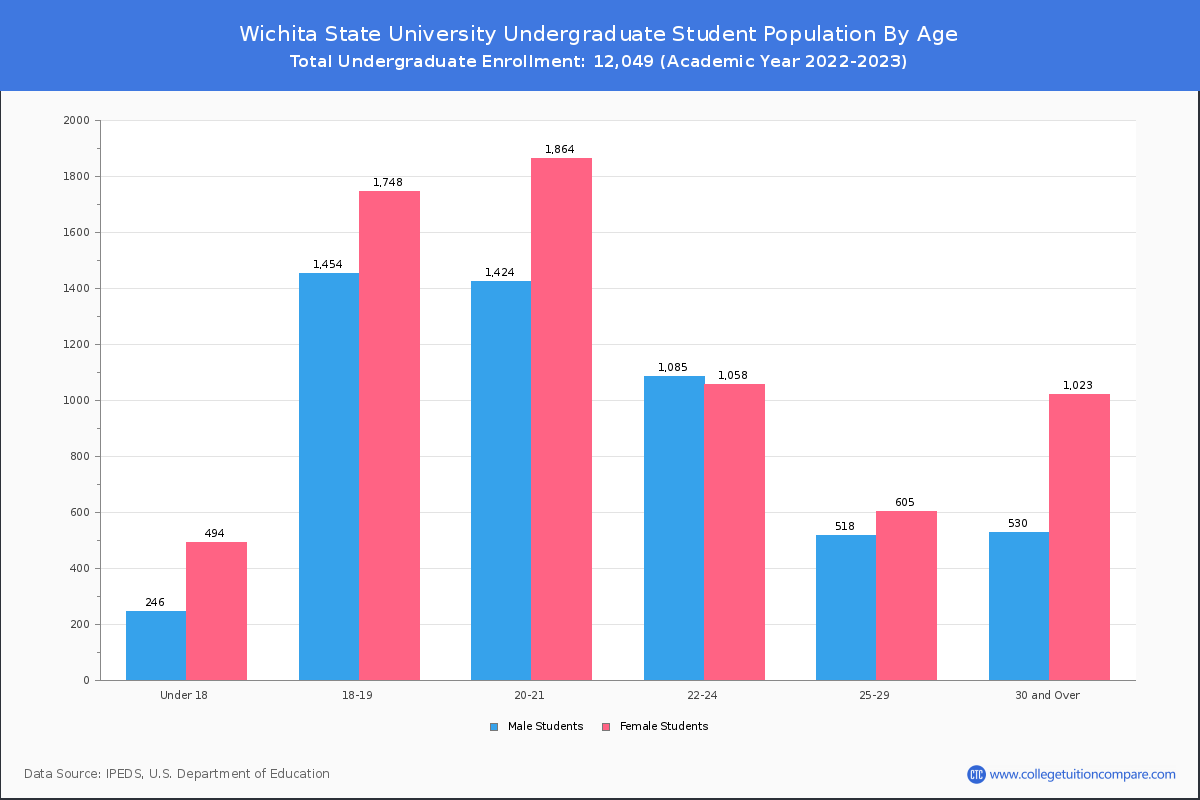
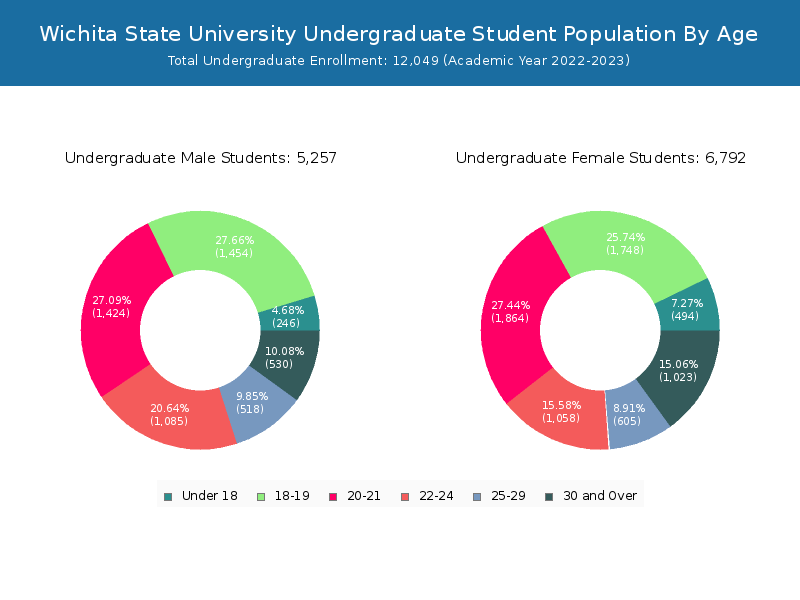
| Age | Total | Men | Women |
|---|---|---|---|
| Under 18 | 740 | 494 | 246 |
| 18-19 | 3,202 | 1,748 | 1,454 |
| 20-21 | 3,454 | 1,948 | 1,506 |
| 22-24 | 3,693 | 1,737 | 1,956 |
| 25-29 | 2,163 | 1,102 | 1,061 |
| 30-34 | 1,100 | 693 | 407 |
| 35-39 | 700 | 454 | 246 |
| 40-49 | 792 | 557 | 235 |
| 50-64 | 332 | 240 | 92 |
| Over 65 | 40 | 23 | 17 |
| Age | Total | Men | Women |
|---|---|---|---|
| Under 18 | 740 | 494 | 246 |
| 18-19 | 3,202 | 1,748 | 1,454 |
| 20-21 | 3,288 | 1,864 | 1,424 |
| 22-24 | 2,143 | 1,058 | 1,085 |
| 25-29 | 1,123 | 605 | 518 |
| 30-34 | 624 | 407 | 217 |
| 35-39 | 411 | 273 | 138 |
| 40-49 | 381 | 253 | 128 |
| 50-64 | 118 | 83 | 35 |
| Over 65 | 19 | 7 | 12 |
| Age | Total | Men | Women |
|---|
Online Student Enrollment
Distance learning, also called online education, is very attractive to students, especially who want to continue education and work in field. At Wichita State University, 3,537 students are enrolled exclusively in online courses and 5,756 students are enrolled in some online courses.
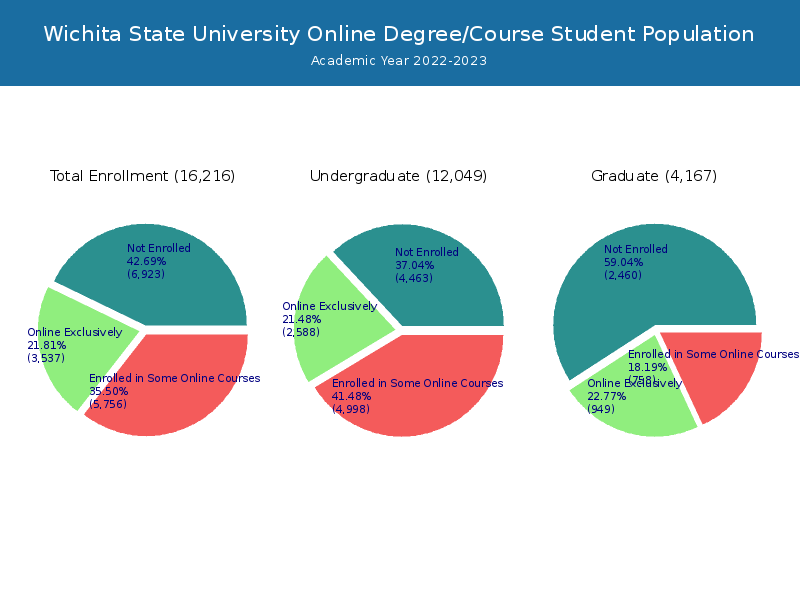
| All Students | Enrolled Exclusively Online Courses | Enrolled in Some Online Courses | |
|---|---|---|---|
| All Students | 16,216 | 3,537 | 5,756 |
| Undergraduate | 12,049 | 2,588 | 4,998 |
| Graduate | 4,167 | 949 | 758 |
| Kansas Residents | Other States in U.S. | Outside of U.S. | |
|---|---|---|---|
| All Students | 0 | 3,537 | 0 |
| Undergraduate | 0 | 2,588 | 0 |
| Graduate | 0 | 949 | 0 |
Transfer-in Students (Undergraduate)
Among 12,049 enrolled in undergraduate programs, 1,224 students have transferred-in from other institutions. The percentage of transfer-in students is 10.16%.919 students have transferred in as full-time status and 305 students transferred in as part-time status.
| Number of Students | |
|---|---|
| Regular Full-time | 7,419 |
| Transfer-in Full-time | 919 |
| Regular Part-time | 3,406 |
| Transfer-in Part-time | 305 |