Student Population by Gender
Central College has a total of 1,169 enrolled students for the academic year 2022-2023. All 1,169 students are enrolled into undergraduate programs.
By gender, 607 male and 562 female students (the male-female ratio is 52:48) are attending the school. The gender distribution is based on the 2022-2023 data.
| Undergraduate | |
|---|---|
| Total | 1,169 |
| Men | 607 |
| Women | 562 |
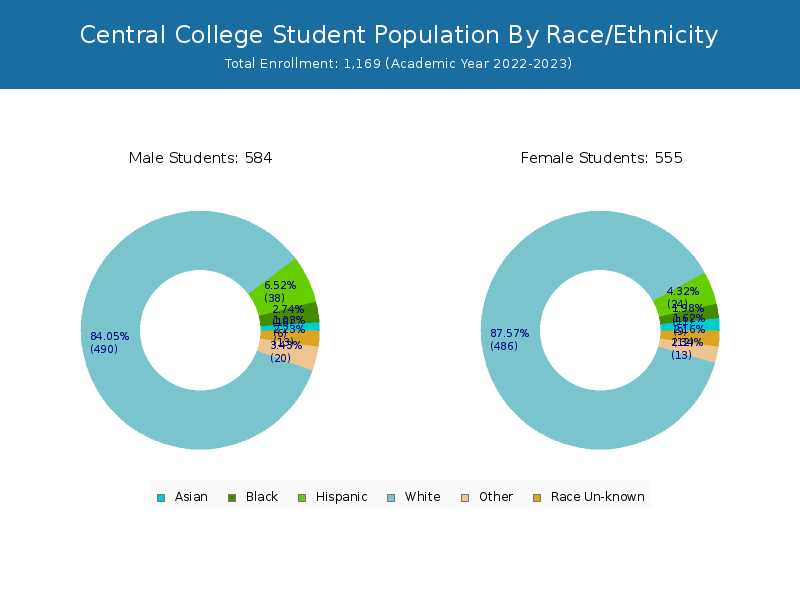
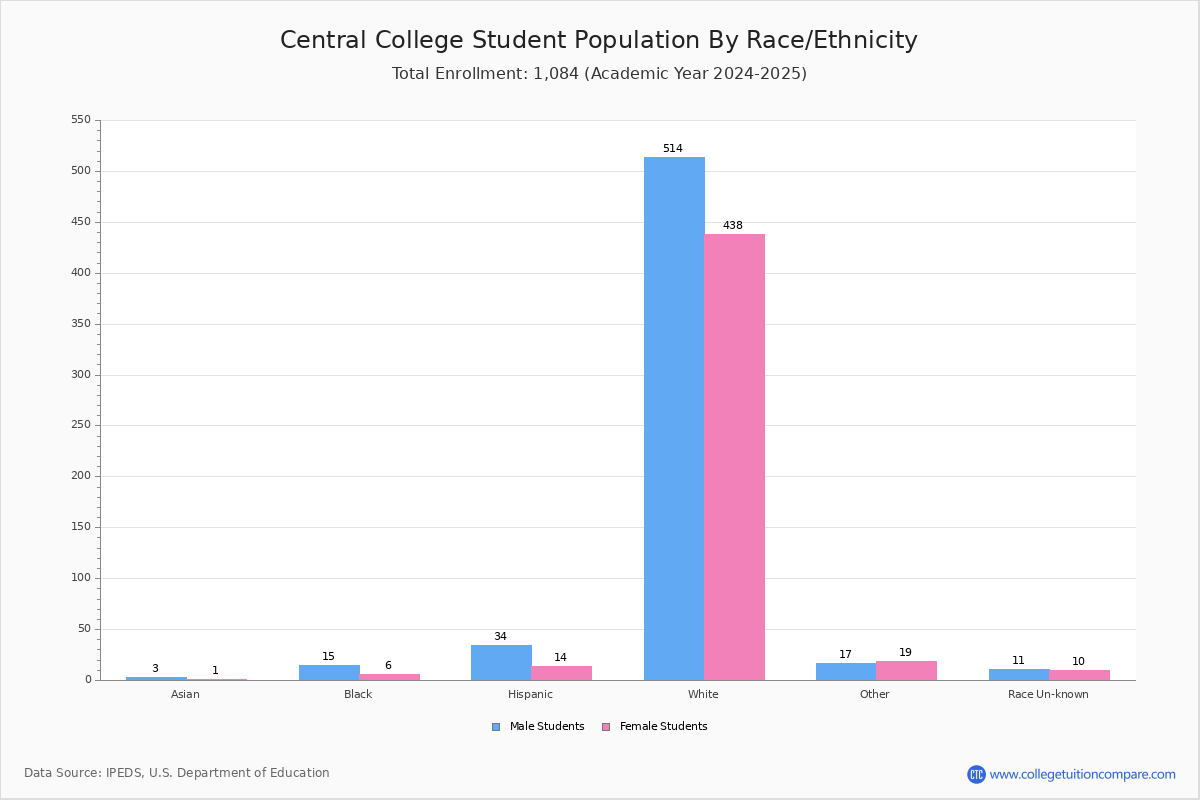
Student Distribution by Race/Ethnicity
By race/ethnicity, 1,000 White, 32 Black, and 11 Asian students out of a total of 1,169 are attending at Central College. Comprehensive enrollment statistic data by race/ethnicity is shown in the next chart (Academic year 2022-2023 data).
| Race | Total | Men | Women |
|---|---|---|---|
| American Indian or Native American | 2 | 2 | 0 |
| Asian | 11 | 4 | 7 |
| Black | 32 | 23 | 9 |
| Hispanic | 57 | 36 | 21 |
| Native Hawaiian or Other Pacific Islanders | 2 | 1 | 1 |
| White | 1,000 | 505 | 495 |
| Two or more races | 37 | 20 | 17 |
| Race Unknown | 27 | 15 | 12 |
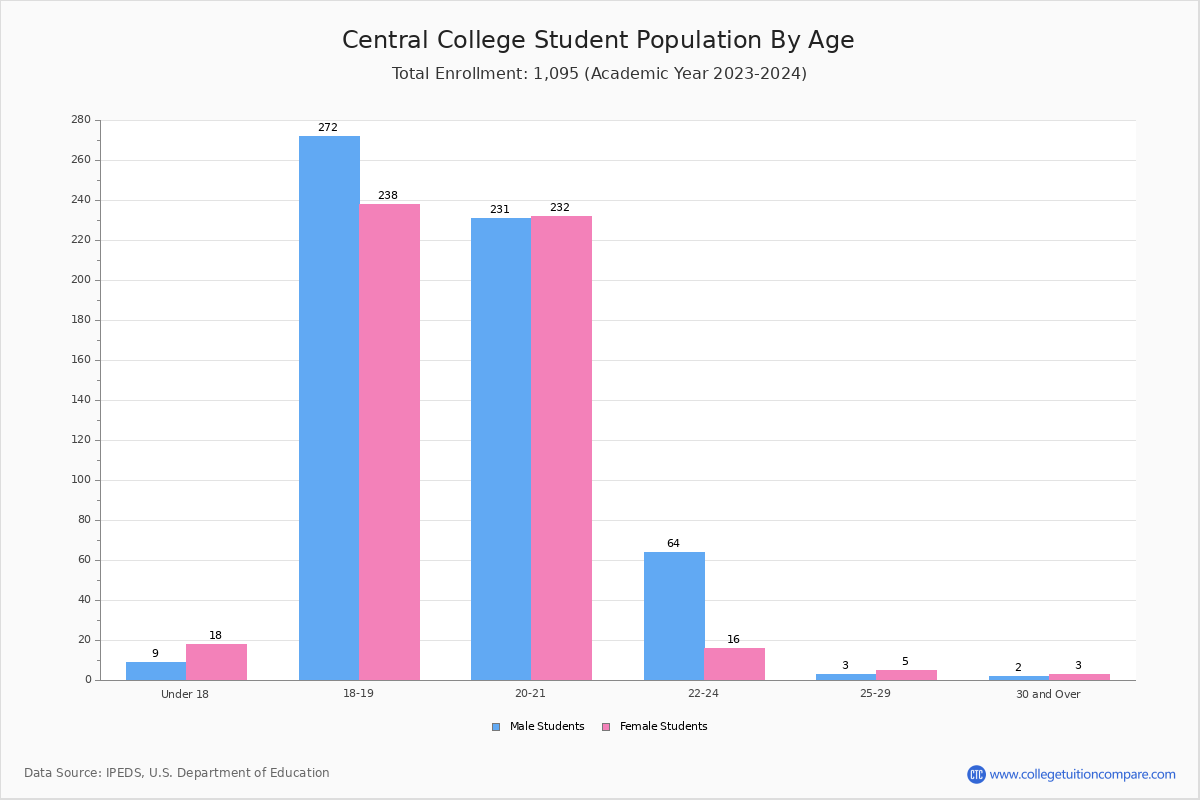
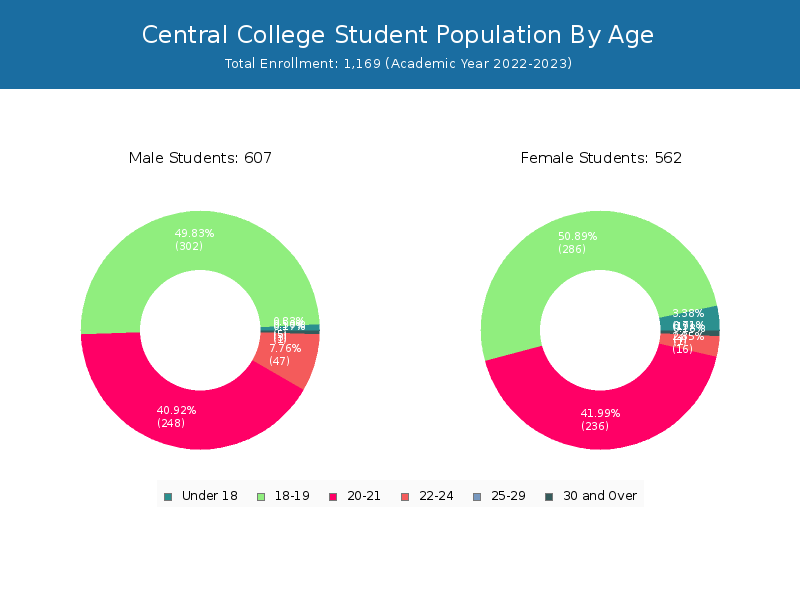
Student Age Distribution
There are 1,159 students under 25 years old, and 9 students over 25 years old out of 1,169 total students.
| Age | Total | Men | Women |
|---|---|---|---|
| Under 18 | 24 | 19 | 5 |
| 18-19 | 588 | 286 | 302 |
| 20-21 | 484 | 236 | 248 |
| 22-24 | 63 | 16 | 47 |
| 25-29 | 2 | 1 | 1 |
| 30-34 | 1 | 1 | 0 |
| 35-39 | 2 | 2 | 0 |
| 40-49 | 1 | 1 | 0 |
| 50-64 | 3 | 0 | 3 |
Transfer-in Students (Undergraduate)
Among 1,169 enrolled in undergraduate programs, 37 students have transferred-in from other institutions. The percentage of transfer-in students is 3.17%.
| Number of Students | |
|---|---|
| Regular Full-time | 1,081 |
| Transfer-in Full-time | 37 |