Student Population by Gender
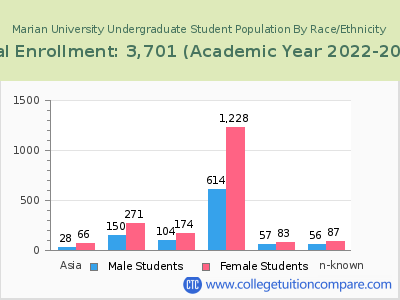
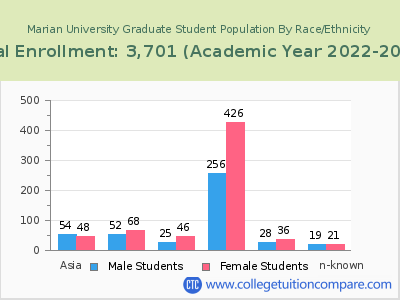
Marian University has a total of 3,701 enrolled students for the academic year 2022-2023. 2,633 students have enrolled in undergraduate programs and 1,068 students joined graduate programs.
By gender, 1,370 male and 2,331 female students (the male-female ratio is 37:63) are attending the school. The gender distribution is based on the 2022-2023 data.
| Total | Undergraduate | Graduate | |
|---|---|---|---|
| Total | 3,701 | 2,633 | 1,068 |
| Men | 1,370 | 956 | 414 |
| Women | 2,331 | 1,677 | 654 |
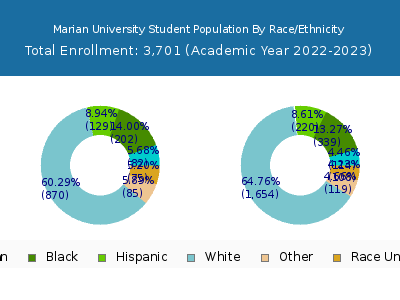
Student Distribution by Race/Ethnicity
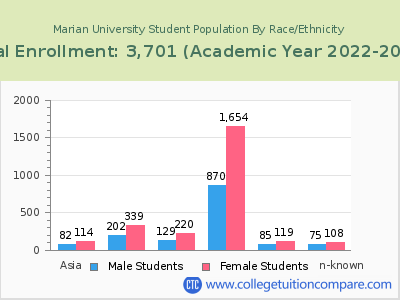
| Race | Total | Men | Women |
|---|---|---|---|
| American Indian or Native American | 2 | 2 | 0 |
| Asian | 182 | 74 | 108 |
| Black | 509 | 178 | 331 |
| Hispanic | 377 | 125 | 252 |
| Native Hawaiian or Other Pacific Islanders | 5 | 1 | 4 |
| White | 2,234 | 815 | 1,419 |
| Two or more races | 182 | 79 | 103 |
| Race Unknown | 127 | 47 | 80 |
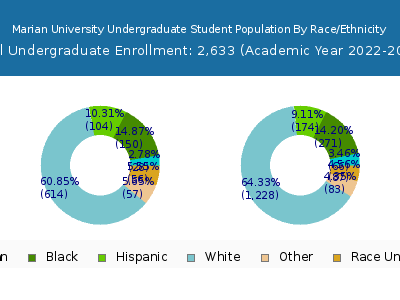
| Race | Total | Men | Women |
|---|---|---|---|
| American Indian or Native American | 1 | 1 | 0 |
| Asian | 77 | 21 | 56 |
| Black | 393 | 133 | 260 |
| Hispanic | 305 | 100 | 205 |
| Native Hawaiian or Other Pacific Islanders | 2 | 1 | 1 |
| White | 1,570 | 577 | 993 |
| Two or more races | 131 | 55 | 76 |
| Race Unknown | 87 | 24 | 63 |
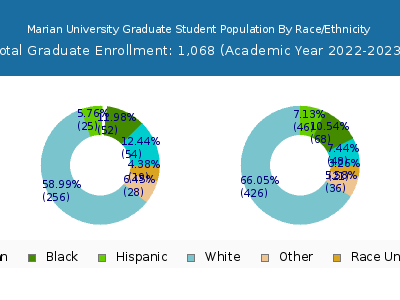
| Race | Total | Men | Women |
|---|---|---|---|
| American Indian or Native American | 0 | 0 | 0 |
| Asian | 9 | 3 | 6 |
| Black | 36 | 11 | 25 |
| Hispanic | 19 | 10 | 9 |
| Native Hawaiian or Other Pacific Islanders | 0 | 0 | 0 |
| White | 120 | 34 | 86 |
| Two or more races | 13 | 6 | 7 |
| Race Unknown | 12 | 4 | 8 |
Online Student Enrollment
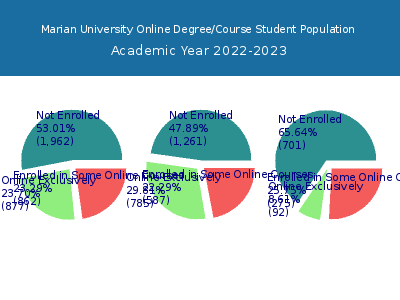
Distance learning, also called online education, is very attractive to students, especially who want to continue education and work in field. At Marian University, 877 students are enrolled exclusively in online courses and 862 students are enrolled in some online courses.
377 students lived in Indiana or jurisdiction in which the school is located are enrolled exclusively in online courses and 500 students live in other State or outside of the United States.
| All Students | Enrolled Exclusively Online Courses | Enrolled in Some Online Courses | |
|---|---|---|---|
| All Students | 3,701 | 877 | 862 |
| Undergraduate | 2,633 | 785 | 587 |
| Graduate | 1,068 | 92 | 275 |
| Indiana Residents | Other States in U.S. | Outside of U.S. | |
|---|---|---|---|
| All Students | 377 | 500 | 0 |
| Undergraduate | 299 | 486 | 0 |
| Graduate | 78 | 14 | 0 |
Transfer-in Students (Undergraduate)
Among 2,633 enrolled in undergraduate programs, 216 students have transferred-in from other institutions. The percentage of transfer-in students is 8.20%.157 students have transferred in as full-time status and 59 students transferred in as part-time status.
| Number of Students | |
|---|---|
| Regular Full-time | 1,933 |
| Transfer-in Full-time | 157 |
| Regular Part-time | 484 |
| Transfer-in Part-time | 59 |
