Student Population by Gender
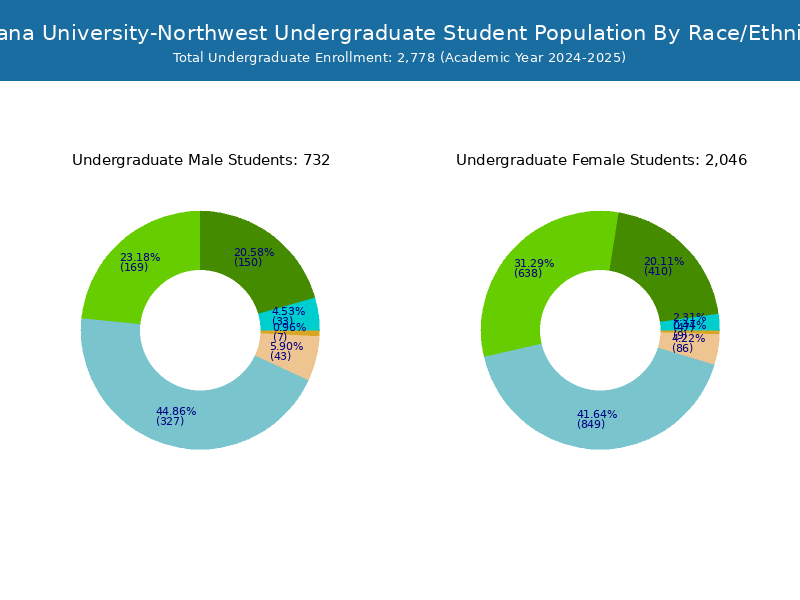
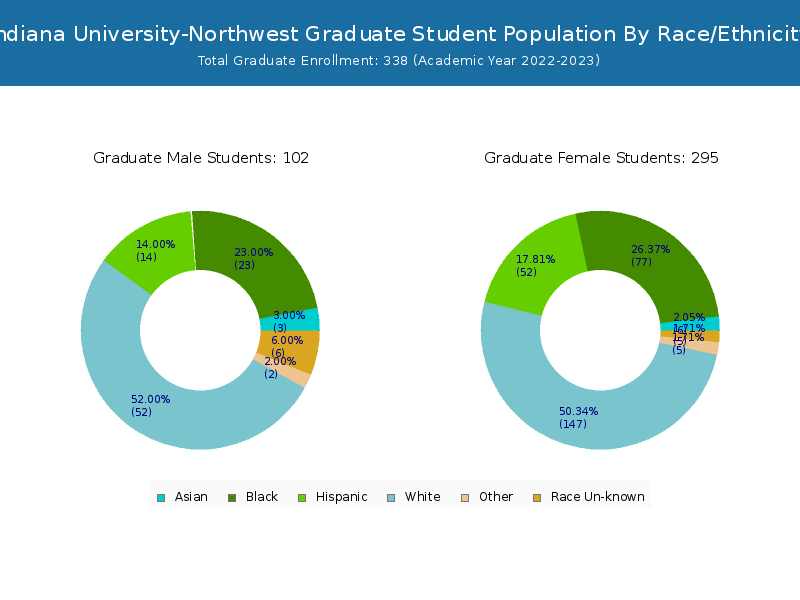
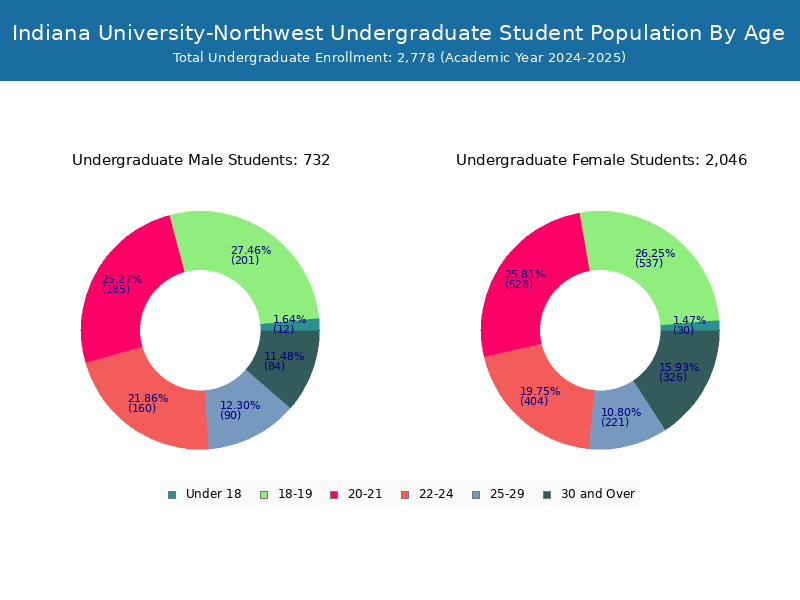
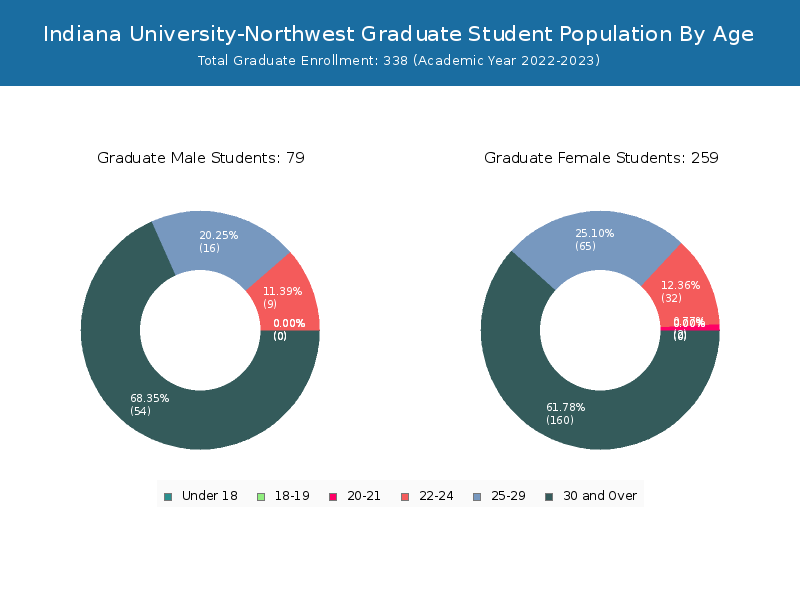
Indiana University-Northwest has a total of 3,198 enrolled students for the academic year 2022-2023. 2,860 students have enrolled in undergraduate programs and 338 students joined graduate programs.
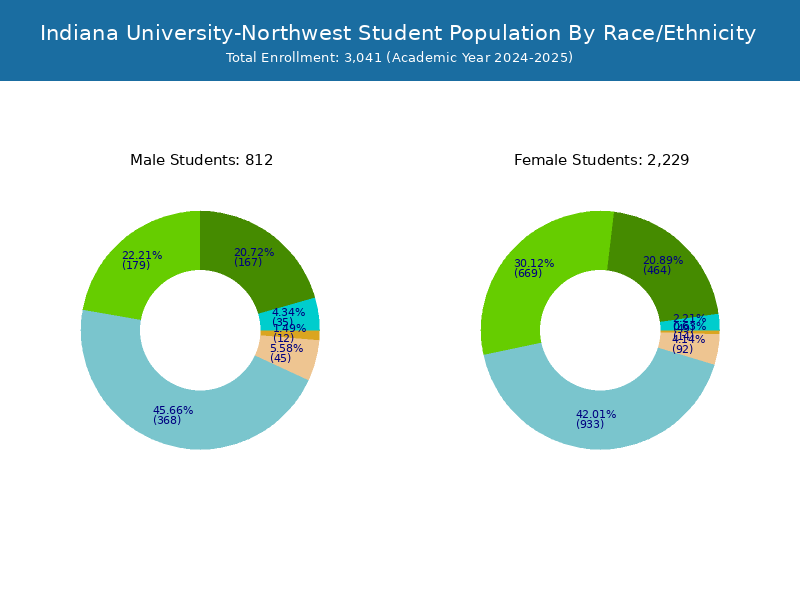
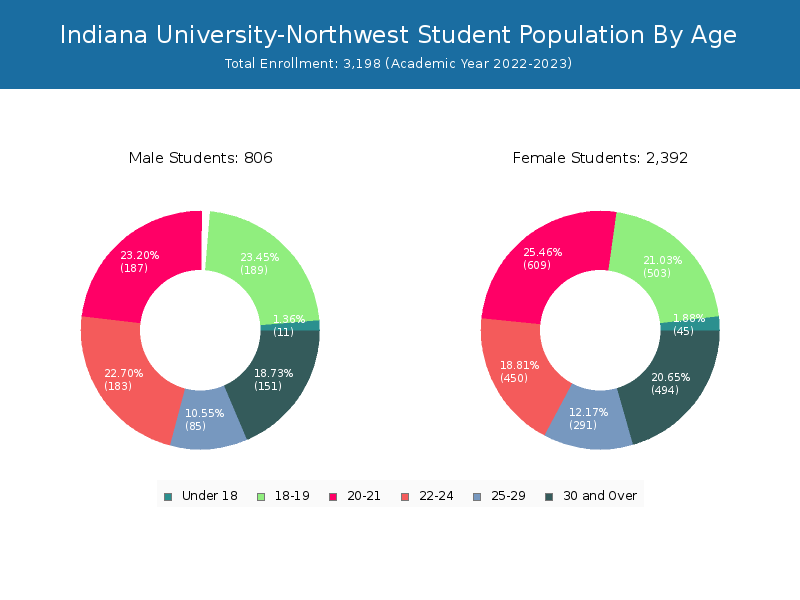
By gender, 806 male and 2,392 female students (the male-female ratio is 25:75) are attending the school. The gender distribution is based on the 2022-2023 data.
| Total | Undergraduate | Graduate | |
|---|---|---|---|
| Total | 3,198 | 2,860 | 338 |
| Men | 806 | 727 | 79 |
| Women | 2,392 | 2,133 | 259 |
Student Distribution by Race/Ethnicity
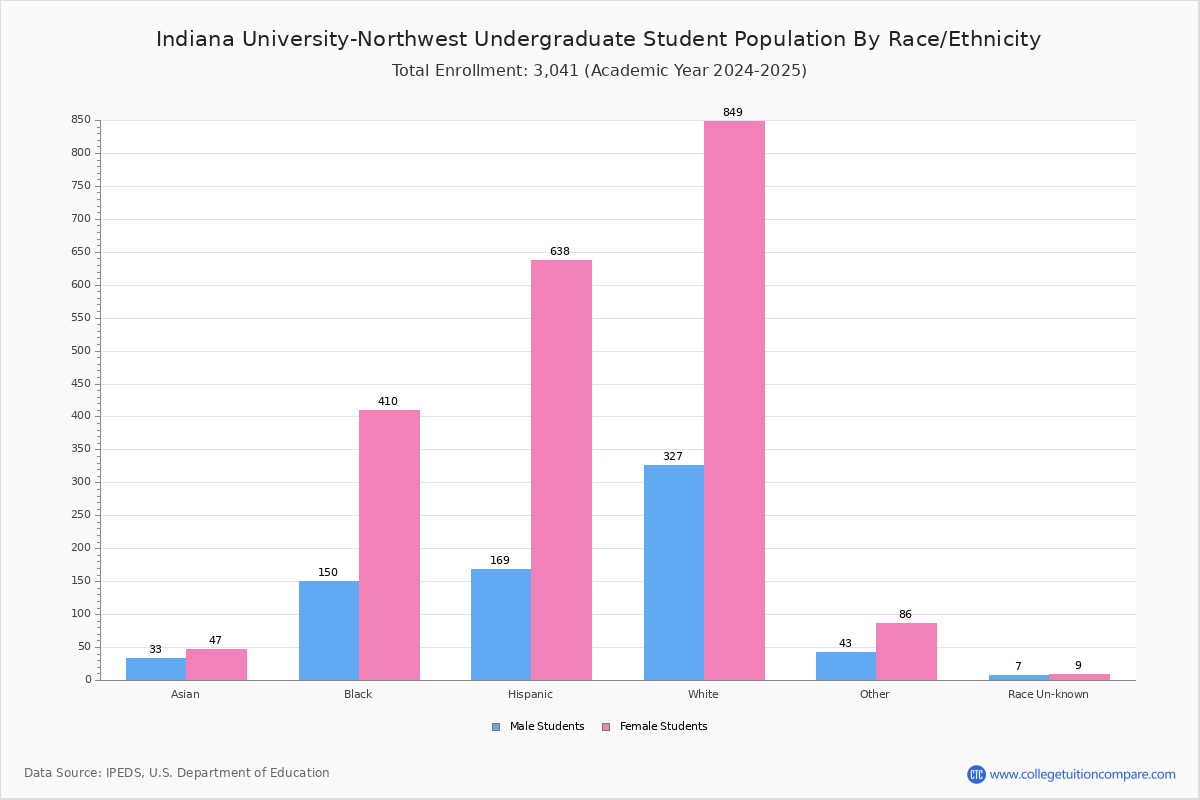
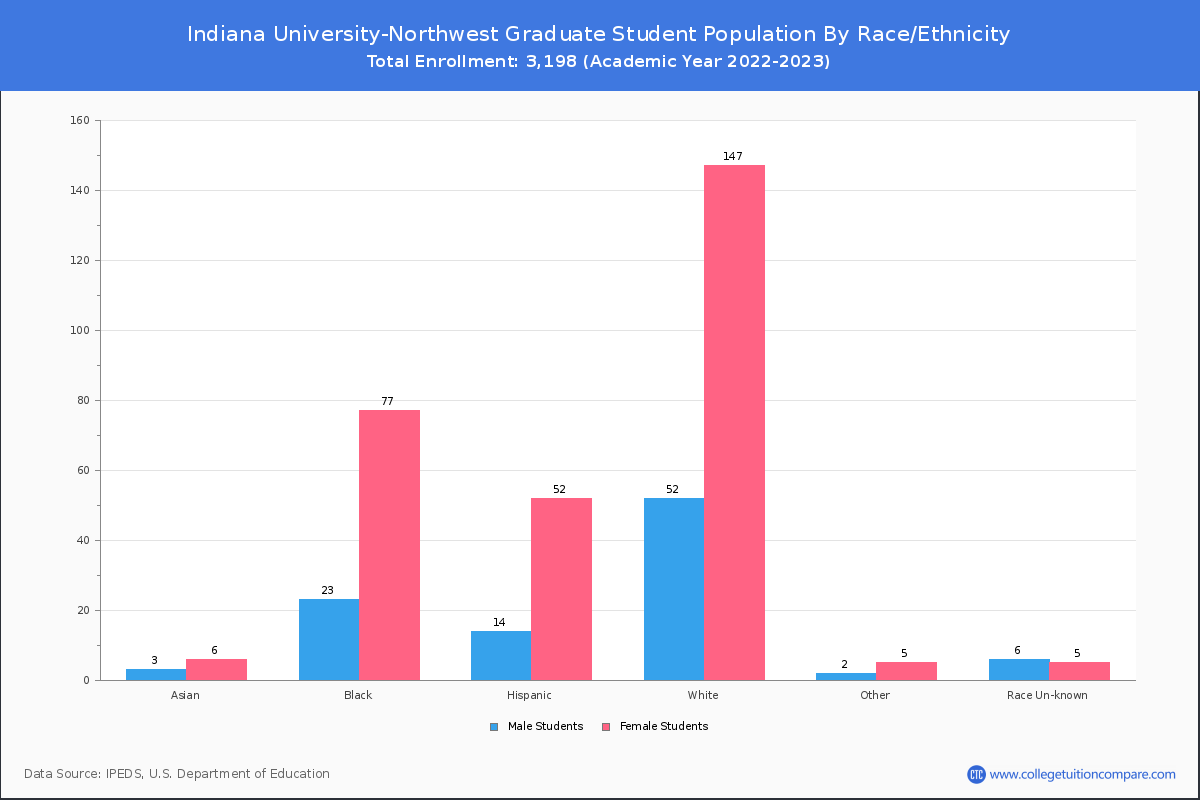
By race/ethnicity, 1,483 White, 584 Black, and 95 Asian students out of a total of 3,198 are attending at Indiana University-Northwest. Comprehensive enrollment statistic data by race/ethnicity is shown in the next chart (Academic year 2022-2023 data).
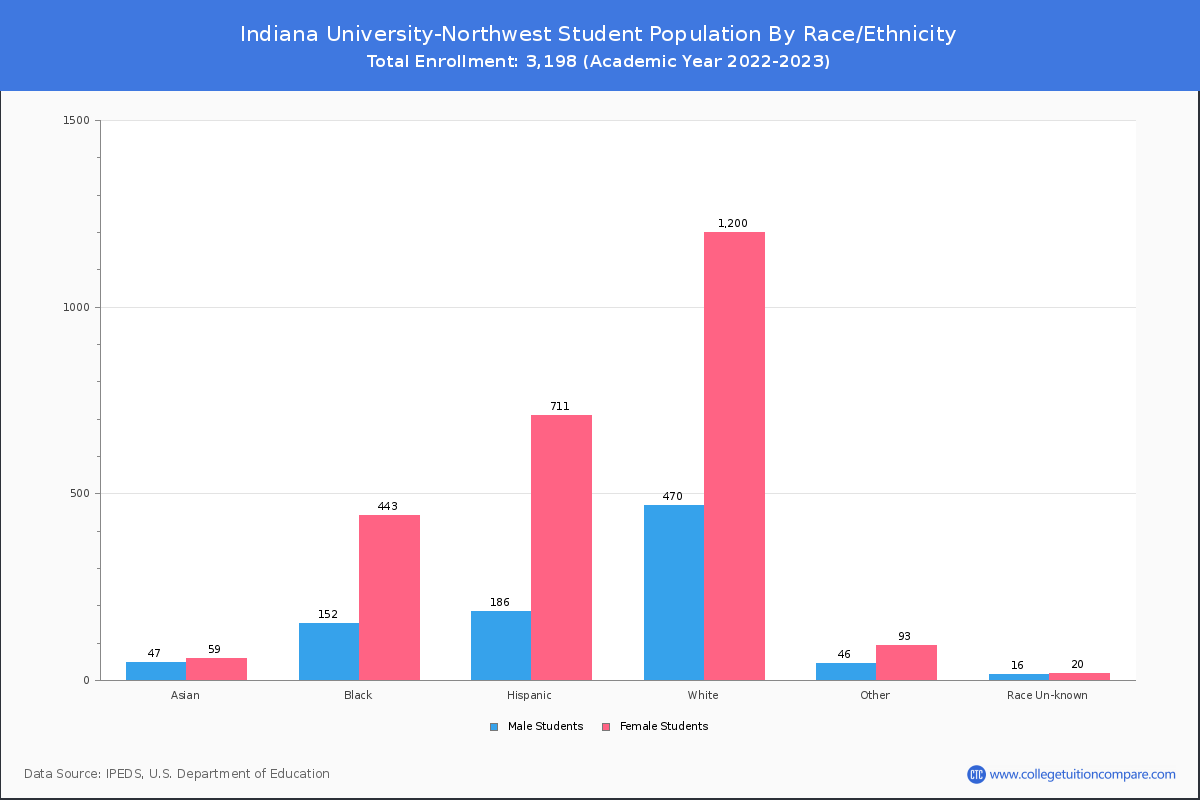
| Race | Total | Men | Women |
|---|---|---|---|
| American Indian or Native American | 1 | 0 | 1 |
| Asian | 95 | 44 | 51 |
| Black | 584 | 135 | 449 |
| Hispanic | 866 | 161 | 705 |
| Native Hawaiian or Other Pacific Islanders | 1 | 0 | 1 |
| White | 1,483 | 408 | 1,075 |
| Two or more races | 114 | 39 | 75 |
| Race Unknown | 38 | 13 | 25 |
| Race | Total | Men | Women |
|---|---|---|---|
| American Indian or Native American | 1 | 0 | 1 |
| Asian | 91 | 42 | 49 |
| Black | 521 | 127 | 394 |
| Hispanic | 806 | 152 | 654 |
| Native Hawaiian or Other Pacific Islanders | 1 | 0 | 1 |
| White | 1,298 | 359 | 939 |
| Two or more races | 108 | 38 | 70 |
| Race Unknown | 25 | 6 | 19 |
| Race | Total | Men | Women |
|---|---|---|---|
| American Indian or Native American | 0 | 0 | 0 |
| Asian | 4 | 1 | 3 |
| Black | 53 | 13 | 40 |
| Hispanic | 49 | 7 | 42 |
| Native Hawaiian or Other Pacific Islanders | 1 | 0 | 1 |
| White | 79 | 22 | 57 |
| Two or more races | 6 | 1 | 5 |
| Race Unknown | 3 | 1 | 2 |
Student Age Distribution
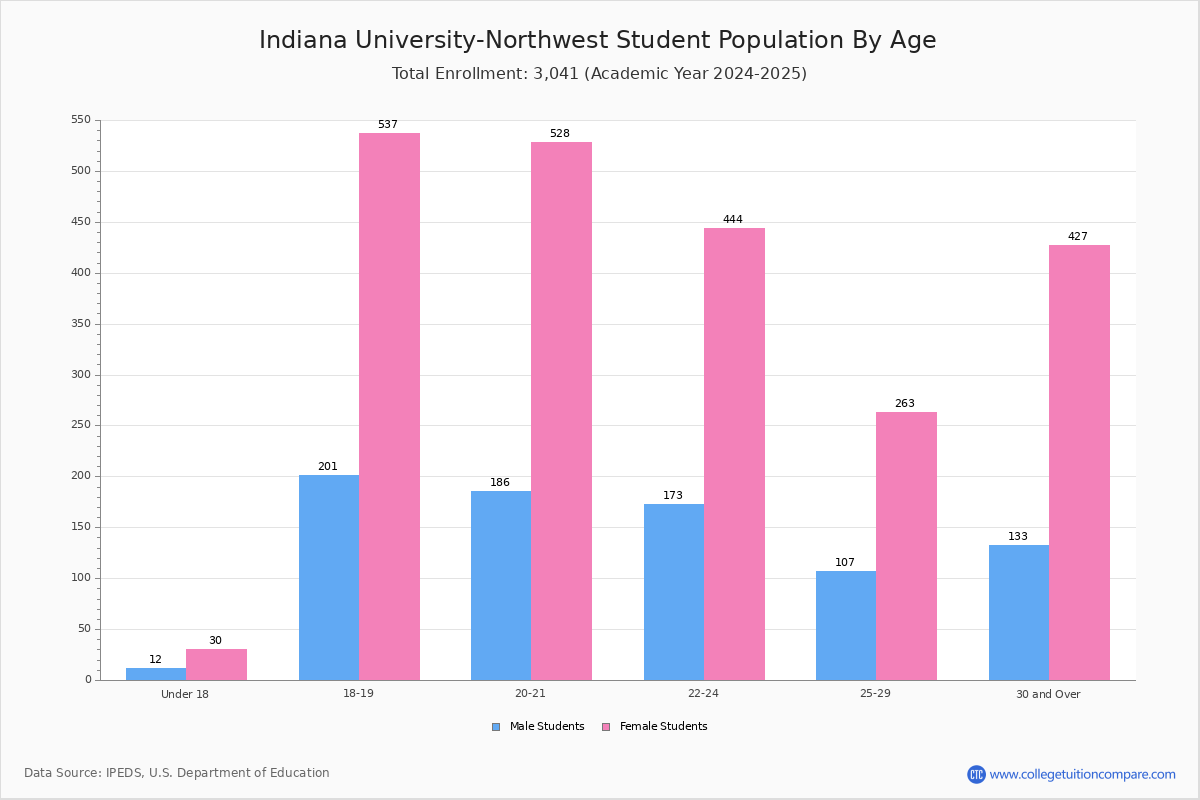
By age, IUN has 56 students under 18 years old and 11 students over 65 years old. There are 2,177 students under 25 years old, and 1,021 students over 25 years old out of 3,198 total students.
In undergraduate programs, 56 students are younger than 18 and 8 students are older than 65. IUN has 2,134 undergraduate students aged under 25 and 726 students aged 25 and over.
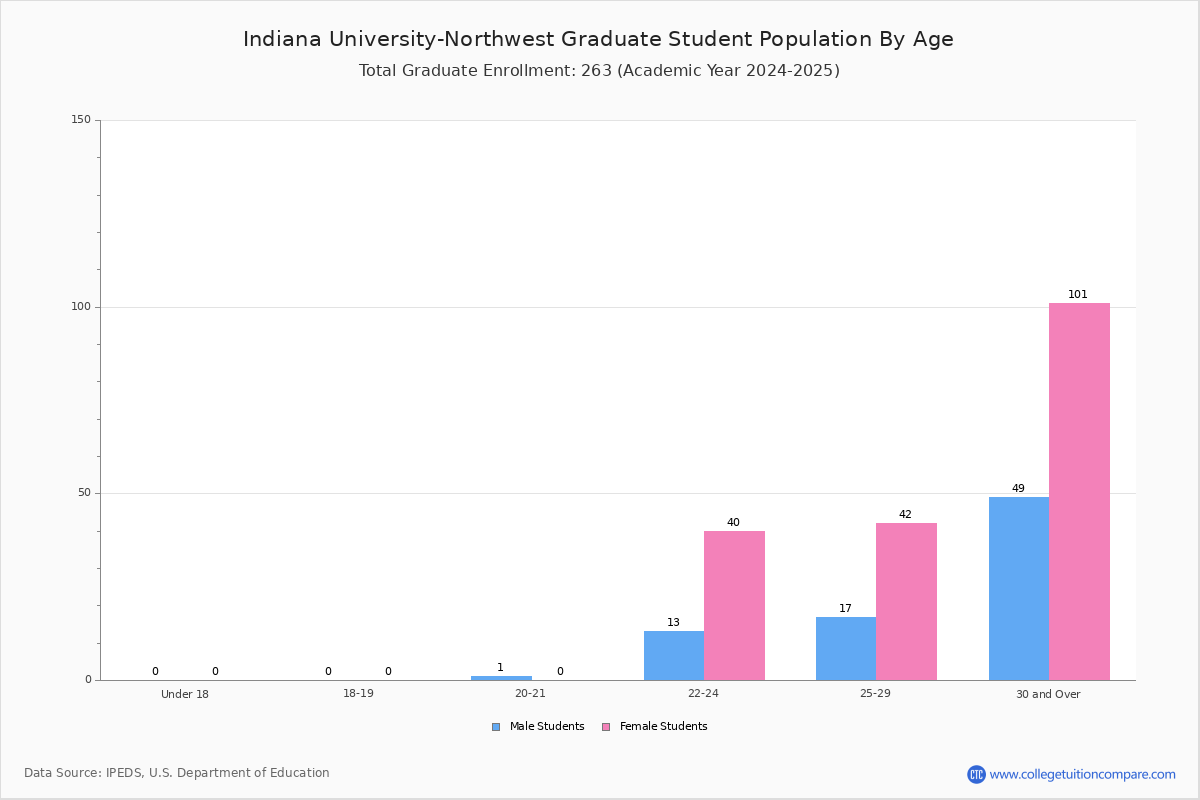
It has 43 graduate students aged under 25 and 295 students aged 25 and over.
| Age | Total | Men | Women |
|---|---|---|---|
| Under 18 | 56 | 45 | 11 |
| 18-19 | 692 | 503 | 189 |
| 20-21 | 796 | 609 | 187 |
| 22-24 | 633 | 450 | 183 |
| 25-29 | 376 | 291 | 85 |
| 30-34 | 206 | 158 | 48 |
| 35-39 | 149 | 112 | 37 |
| 40-49 | 186 | 147 | 39 |
| 50-64 | 93 | 69 | 24 |
| Over 65 | 11 | 8 | 3 |
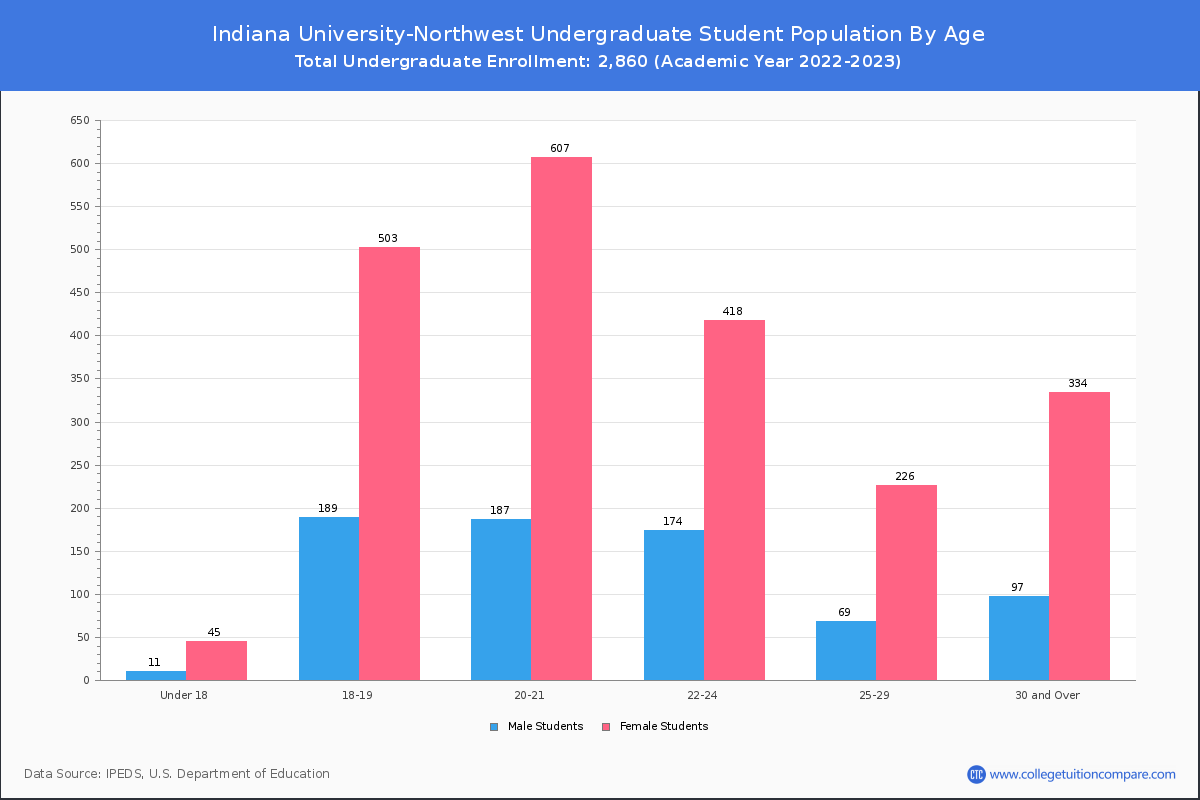
| Age | Total | Men | Women |
|---|---|---|---|
| Under 18 | 56 | 45 | 11 |
| 18-19 | 692 | 503 | 189 |
| 20-21 | 794 | 607 | 187 |
| 22-24 | 592 | 418 | 174 |
| 25-29 | 295 | 226 | 69 |
| 30-34 | 152 | 116 | 36 |
| 35-39 | 95 | 73 | 22 |
| 40-49 | 124 | 101 | 23 |
| 50-64 | 52 | 39 | 13 |
| Over 65 | 8 | 5 | 3 |
| Age | Total | Men | Women |
|---|
Online Student Enrollment
Distance learning, also called online education, is very attractive to students, especially who want to continue education and work in field. At Indiana University-Northwest, 735 students are enrolled exclusively in online courses and 1,590 students are enrolled in some online courses.
673 students lived in Indiana or jurisdiction in which the school is located are enrolled exclusively in online courses and 62 students live in other State or outside of the United States.
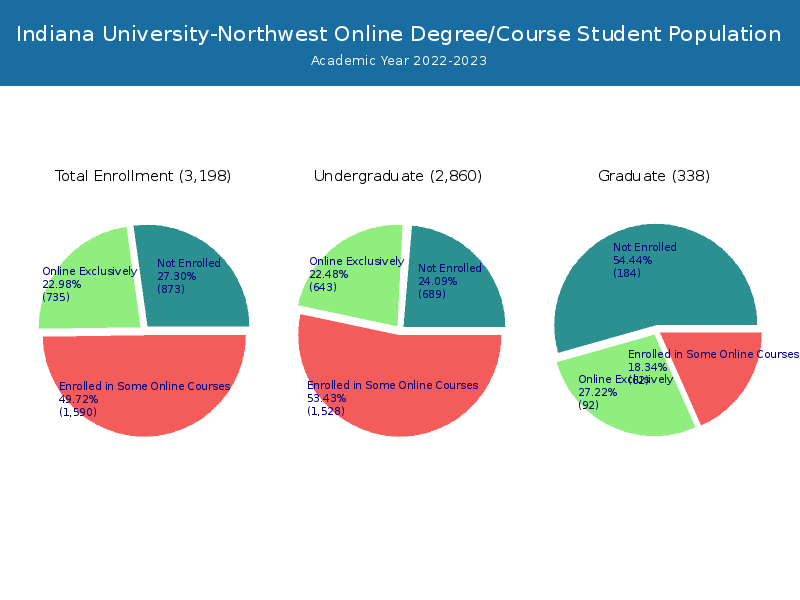
| All Students | Enrolled Exclusively Online Courses | Enrolled in Some Online Courses | |
|---|---|---|---|
| All Students | 3,198 | 735 | 1,590 |
| Undergraduate | 2,860 | 643 | 1,528 |
| Graduate | 338 | 92 | 62 |
| Indiana Residents | Other States in U.S. | Outside of U.S. | |
|---|---|---|---|
| All Students | 673 | 61 | 1 |
| Undergraduate | 595 | 47 | 1 |
| Graduate | 78 | 14 | 0 |
Transfer-in Students (Undergraduate)
Among 2,860 enrolled in undergraduate programs, 195 students have transferred-in from other institutions. The percentage of transfer-in students is 6.82%.126 students have transferred in as full-time status and 69 students transferred in as part-time status.
| Number of Students | |
|---|---|
| Regular Full-time | 1,849 |
| Transfer-in Full-time | 126 |
| Regular Part-time | 816 |
| Transfer-in Part-time | 69 |