Student Population by Gender
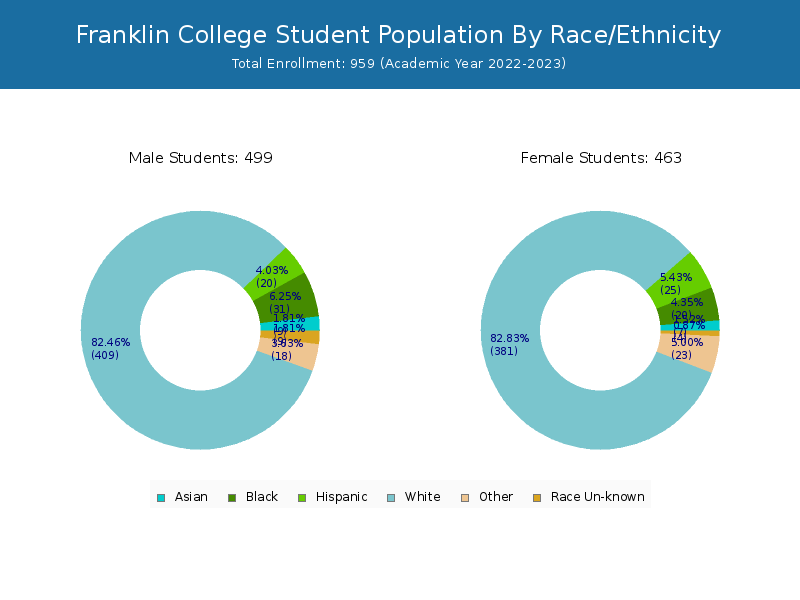
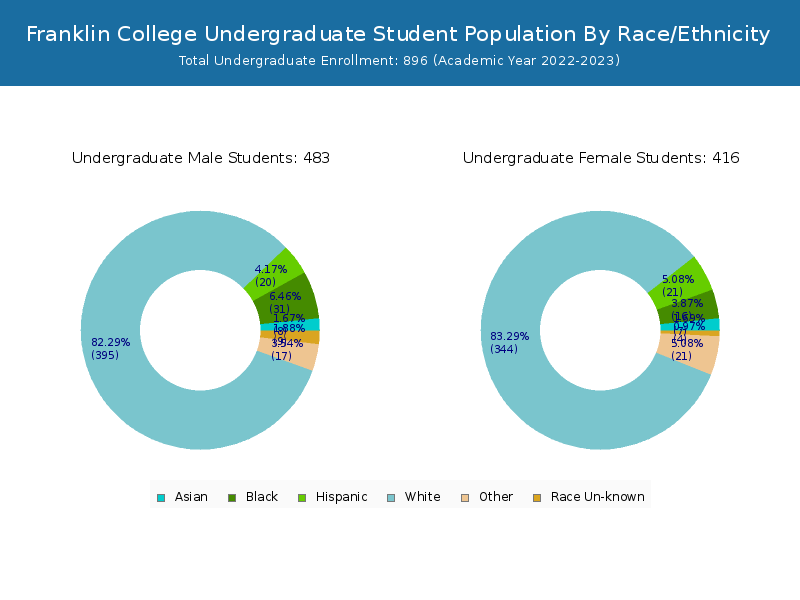
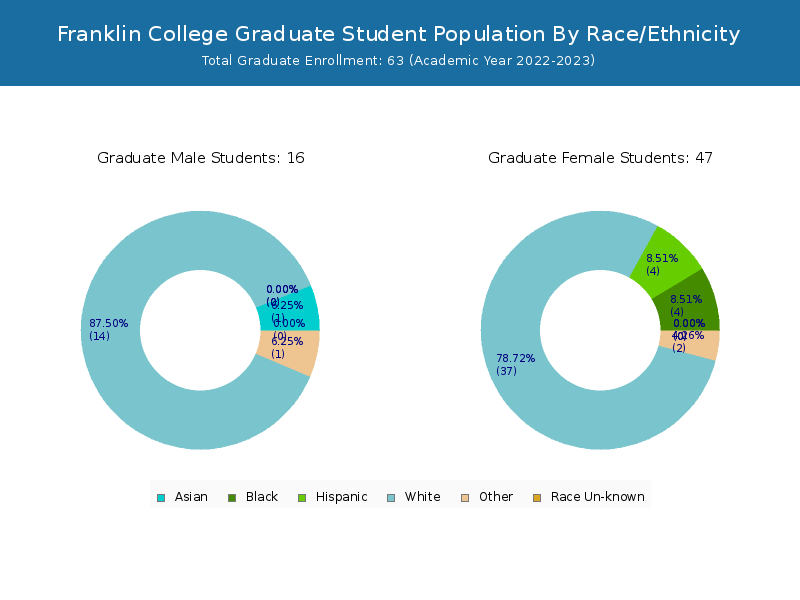
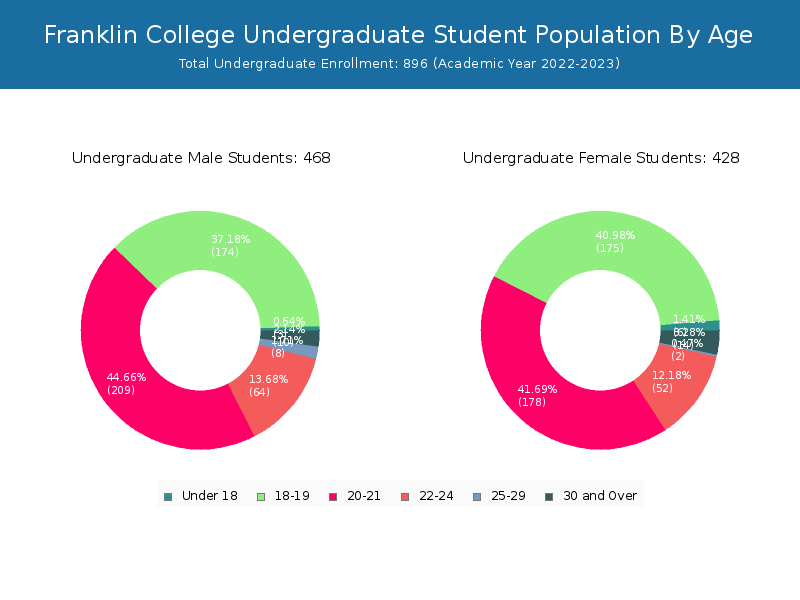
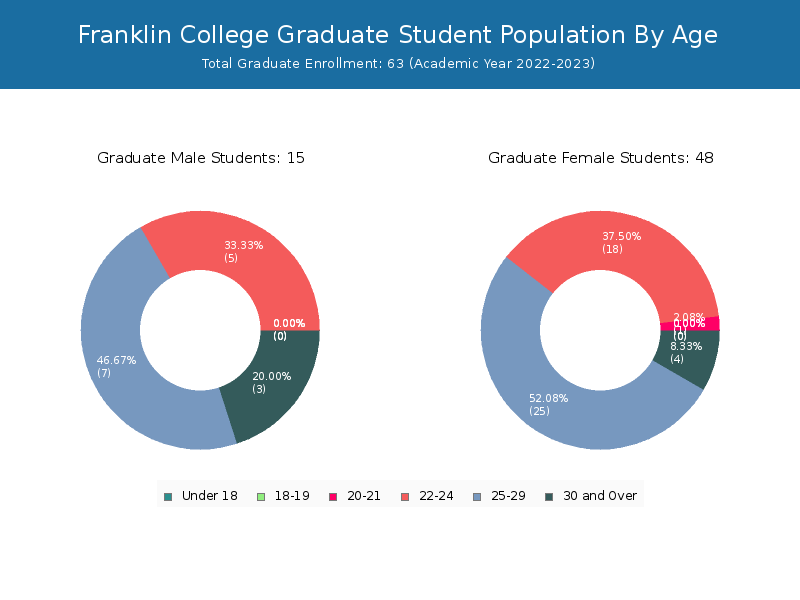
Franklin College has a total of 959 enrolled students for the academic year 2022-2023. 896 students have enrolled in undergraduate programs and 63 students joined graduate programs.
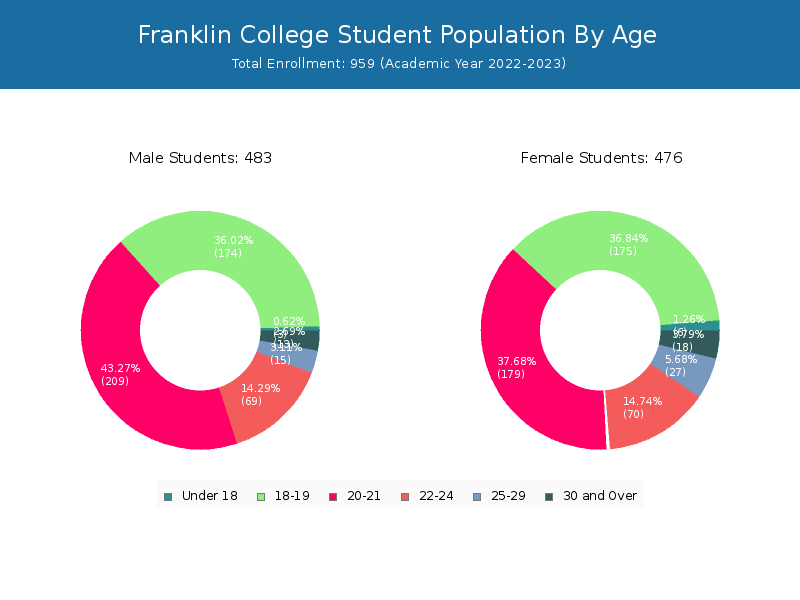
By gender, 483 male and 476 female students (the male-female ratio is 50:50) are attending the school. The gender distribution is based on the 2022-2023 data.
| Total | Undergraduate | Graduate | |
|---|---|---|---|
| Total | 959 | 896 | 63 |
| Men | 483 | 468 | 15 |
| Women | 476 | 428 | 48 |
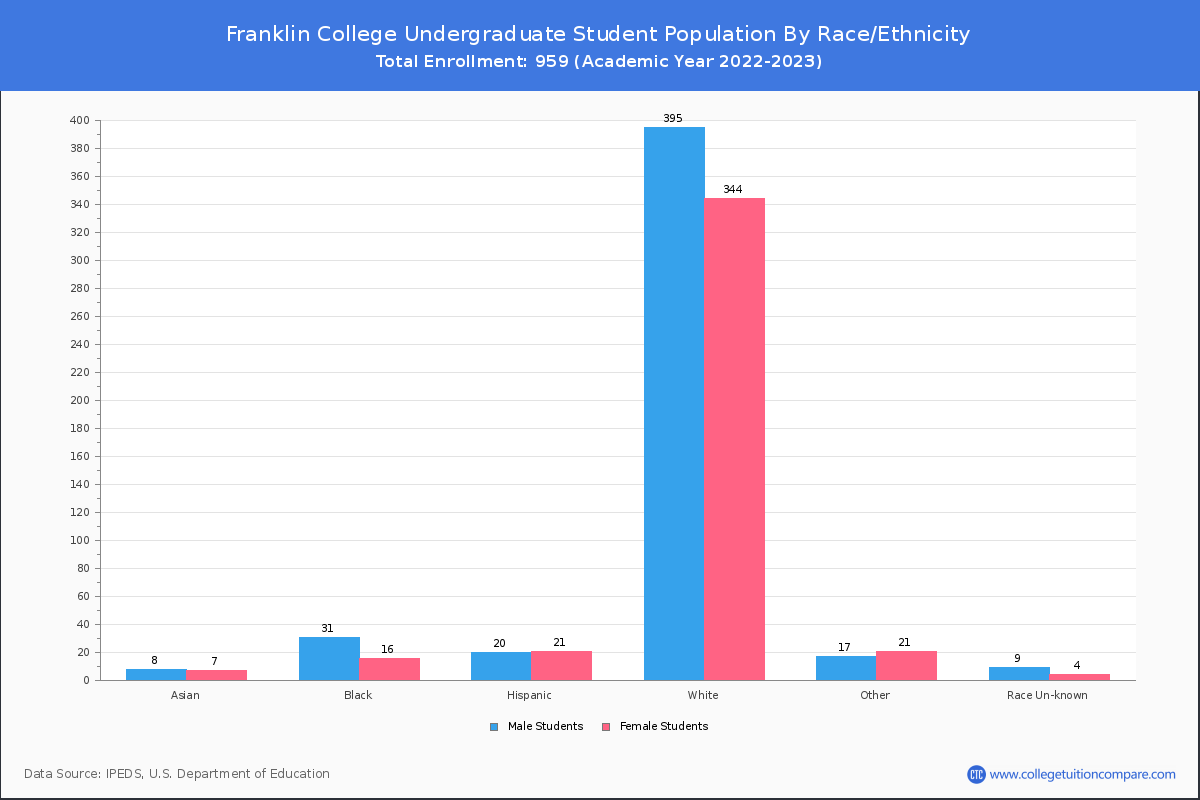
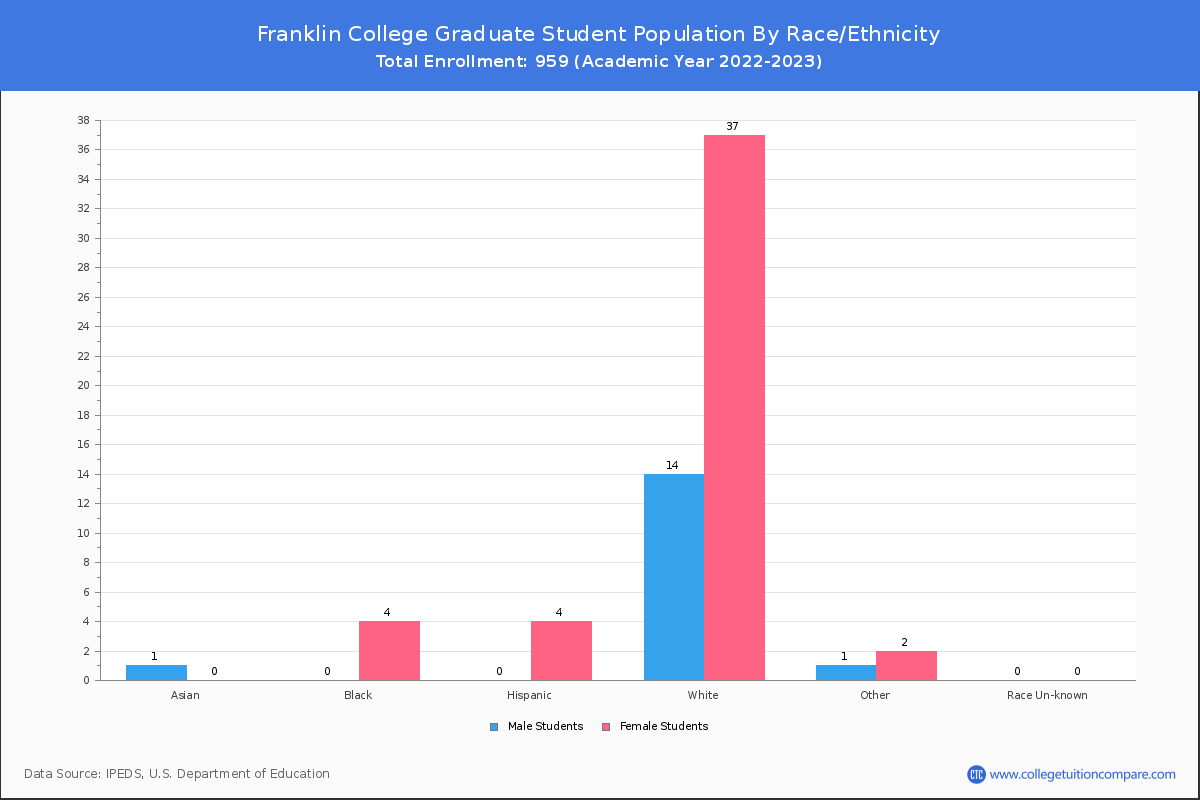
Student Distribution by Race/Ethnicity
By race/ethnicity, 774 White, 54 Black, and 17 Asian students out of a total of 959 are attending at Franklin College. Comprehensive enrollment statistic data by race/ethnicity is shown in the next chart (Academic year 2022-2023 data).
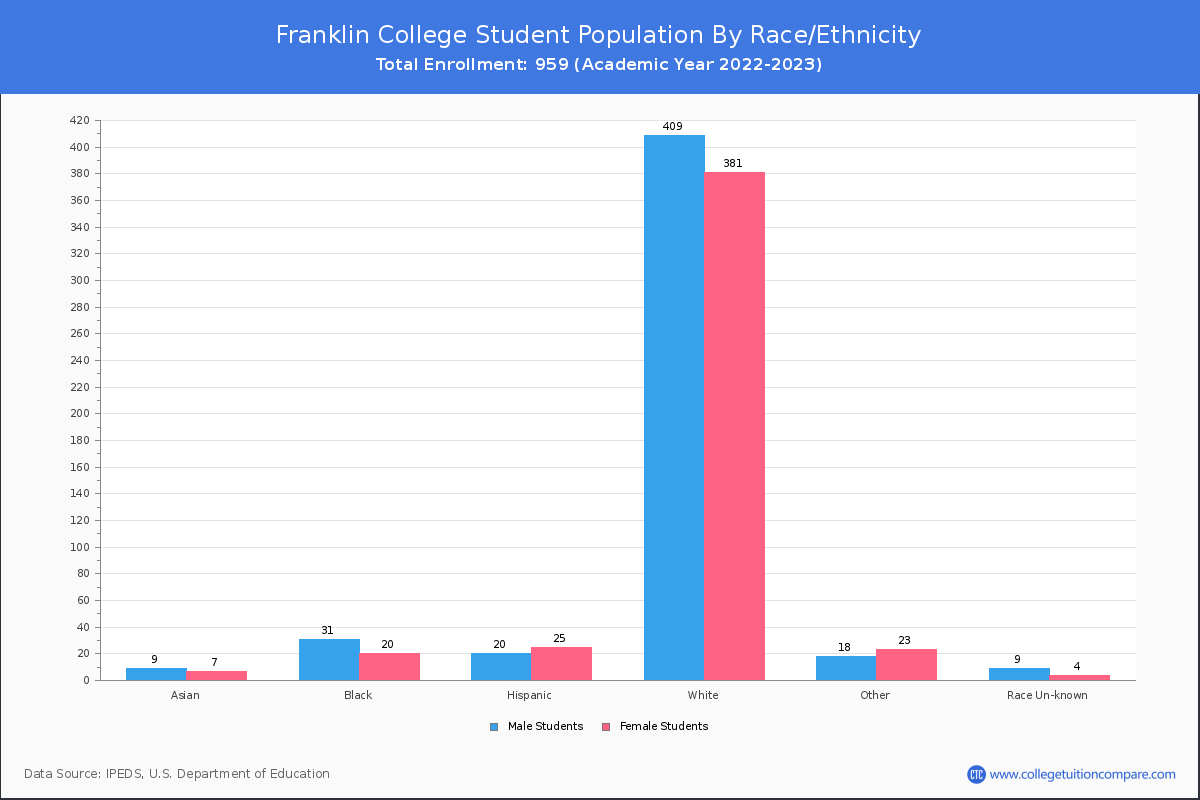
| Race | Total | Men | Women |
|---|---|---|---|
| American Indian or Native American | 1 | 0 | 1 |
| Asian | 17 | 7 | 10 |
| Black | 54 | 38 | 16 |
| Hispanic | 53 | 26 | 27 |
| Native Hawaiian or Other Pacific Islanders | 0 | 0 | 0 |
| White | 774 | 379 | 395 |
| Two or more races | 42 | 22 | 20 |
| Race Unknown | 11 | 7 | 4 |
| Race | Total | Men | Women |
|---|---|---|---|
| American Indian or Native American | 1 | 0 | 1 |
| Asian | 17 | 7 | 10 |
| Black | 49 | 38 | 11 |
| Hispanic | 49 | 25 | 24 |
| Native Hawaiian or Other Pacific Islanders | 0 | 0 | 0 |
| White | 723 | 365 | 358 |
| Two or more races | 40 | 22 | 18 |
| Race Unknown | 10 | 7 | 3 |
| Race | Total | Men | Women |
|---|---|---|---|
| American Indian or Native American | 0 | 0 | 0 |
| Asian | 0 | 0 | 0 |
| Black | 2 | 2 | 0 |
| Hispanic | 1 | 1 | 0 |
| Native Hawaiian or Other Pacific Islanders | 0 | 0 | 0 |
| White | 21 | 12 | 9 |
| Two or more races | 0 | 0 | 0 |
| Race Unknown | 0 | 0 | 0 |
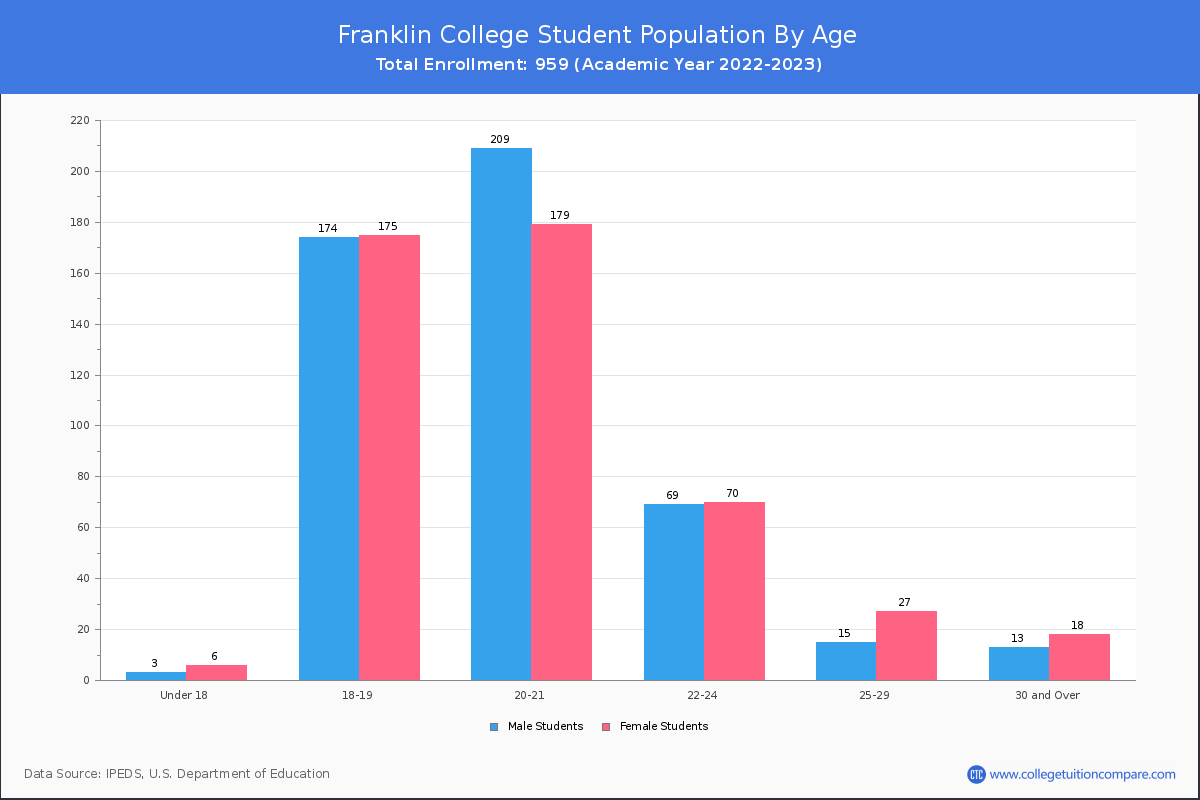
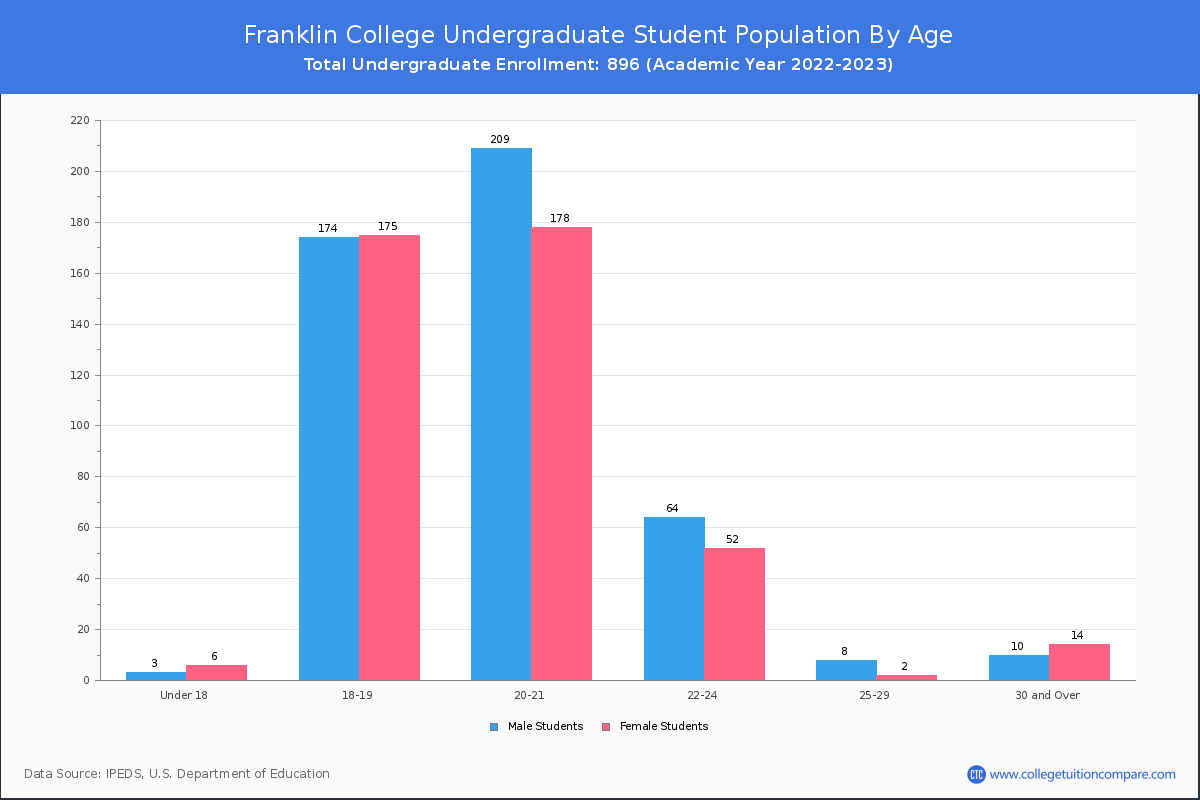
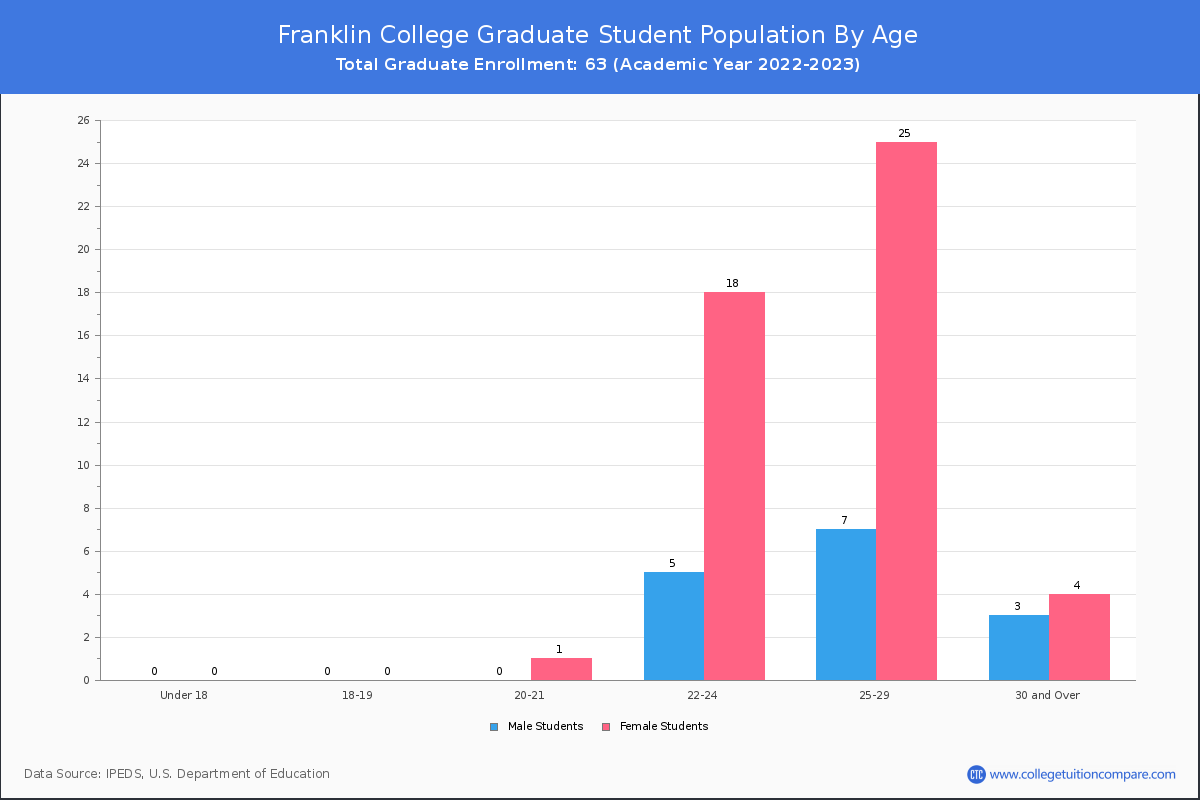
Student Age Distribution
By age, Franklin has 9 students under 18 years old and 9 students over 65 years old. There are 885 students under 25 years old, and 73 students over 25 years old out of 959 total students.
In undergraduate programs, 9 students are younger than 18 and 9 students are older than 65. Franklin has 861 undergraduate students aged under 25 and 34 students aged 25 and over.
It has 24 graduate students aged under 25 and 39 students aged 25 and over.
| Age | Total | Men | Women |
|---|---|---|---|
| Under 18 | 9 | 6 | 3 |
| 18-19 | 349 | 175 | 174 |
| 20-21 | 388 | 179 | 209 |
| 22-24 | 139 | 70 | 69 |
| 25-29 | 42 | 27 | 15 |
| 30-34 | 6 | 4 | 2 |
| 35-39 | 5 | 3 | 2 |
| 40-49 | 2 | 1 | 1 |
| 50-64 | 9 | 5 | 4 |
| Over 65 | 9 | 5 | 4 |
| Age | Total | Men | Women |
|---|---|---|---|
| Under 18 | 9 | 6 | 3 |
| 18-19 | 349 | 175 | 174 |
| 20-21 | 387 | 178 | 209 |
| 22-24 | 116 | 52 | 64 |
| 25-29 | 10 | 2 | 8 |
| 30-34 | 2 | 2 | 0 |
| 35-39 | 2 | 1 | 1 |
| 40-49 | 2 | 1 | 1 |
| 50-64 | 9 | 5 | 4 |
| Over 65 | 9 | 5 | 4 |
| Age | Total | Men | Women |
|---|
Transfer-in Students (Undergraduate)
Among 896 enrolled in undergraduate programs, 24 students have transferred-in from other institutions. The percentage of transfer-in students is 2.68%.23 students have transferred in as full-time status and 1 students transferred in as part-time status.
| Number of Students | |
|---|---|
| Regular Full-time | 827 |
| Transfer-in Full-time | 23 |
| Regular Part-time | 45 |
| Transfer-in Part-time | 1 |