Student Population by Gender
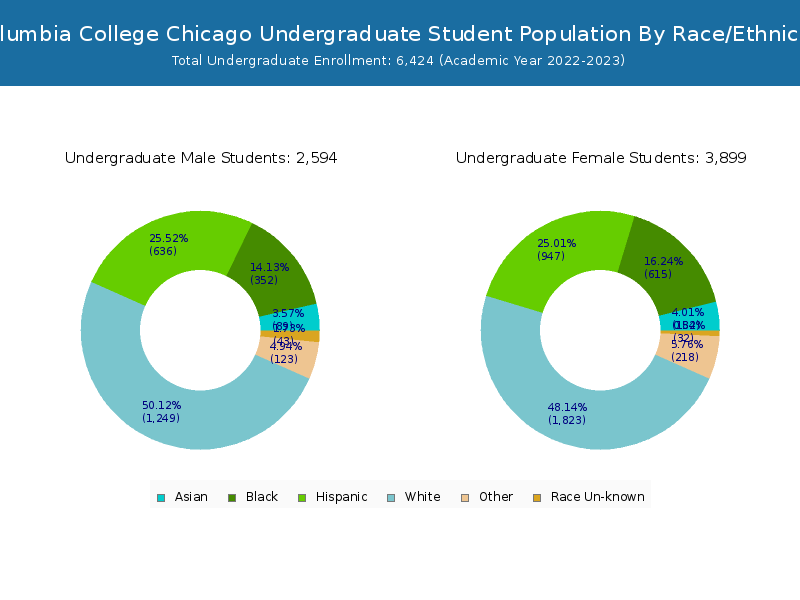
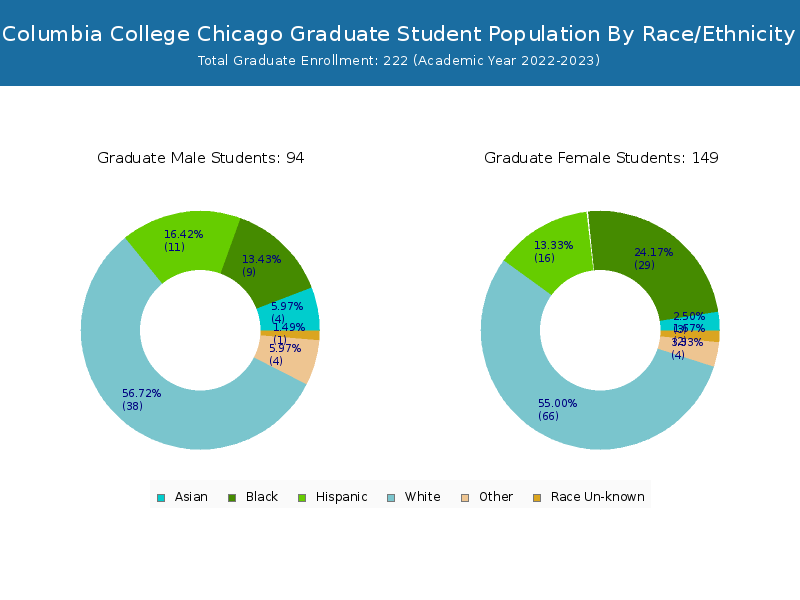
Columbia College Chicago has a total of 6,646 enrolled students for the academic year 2022-2023. 6,424 students have enrolled in undergraduate programs and 222 students joined graduate programs.
By gender, 2,637 male and 4,009 female students (the male-female ratio is 40:60) are attending the school. The gender distribution is based on the 2022-2023 data.
| Total | Undergraduate | Graduate | |
|---|---|---|---|
| Total | 6,646 | 6,424 | 222 |
| Men | 2,637 | 2,548 | 89 |
| Women | 4,009 | 3,876 | 133 |
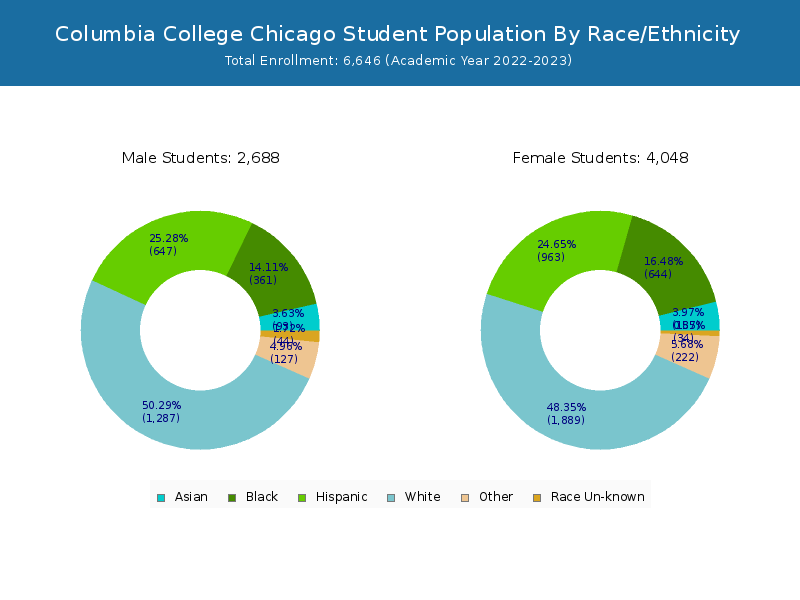
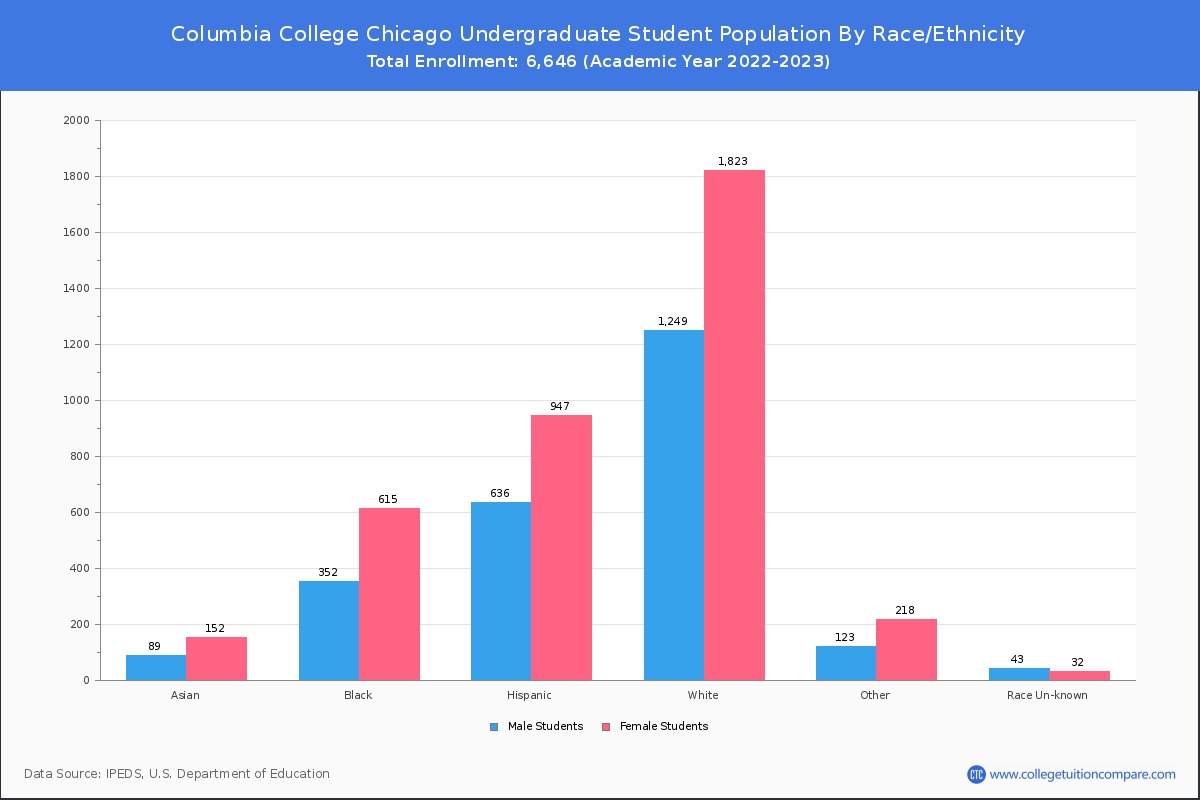
Student Distribution by Race/Ethnicity
By race/ethnicity, 2,902 White, 1,126 Black, and 231 Asian students out of a total of 6,646 are attending at Columbia College Chicago. Comprehensive enrollment statistic data by race/ethnicity is shown in the next chart (Academic year 2022-2023 data).

| Race | Total | Men | Women |
|---|---|---|---|
| American Indian or Native American | 7 | 3 | 4 |
| Asian | 231 | 91 | 140 |
| Black | 1,126 | 442 | 684 |
| Hispanic | 1,671 | 657 | 1,014 |
| Native Hawaiian or Other Pacific Islanders | 6 | 2 | 4 |
| White | 2,902 | 1,175 | 1,727 |
| Two or more races | 323 | 108 | 215 |
| Race Unknown | 75 | 37 | 38 |
| Race | Total | Men | Women |
|---|---|---|---|
| American Indian or Native American | 6 | 2 | 4 |
| Asian | 223 | 86 | 137 |
| Black | 1,087 | 430 | 657 |
| Hispanic | 1,650 | 648 | 1,002 |
| Native Hawaiian or Other Pacific Islanders | 6 | 2 | 4 |
| White | 2,820 | 1,143 | 1,677 |
| Two or more races | 318 | 105 | 213 |
| Race Unknown | 71 | 35 | 36 |
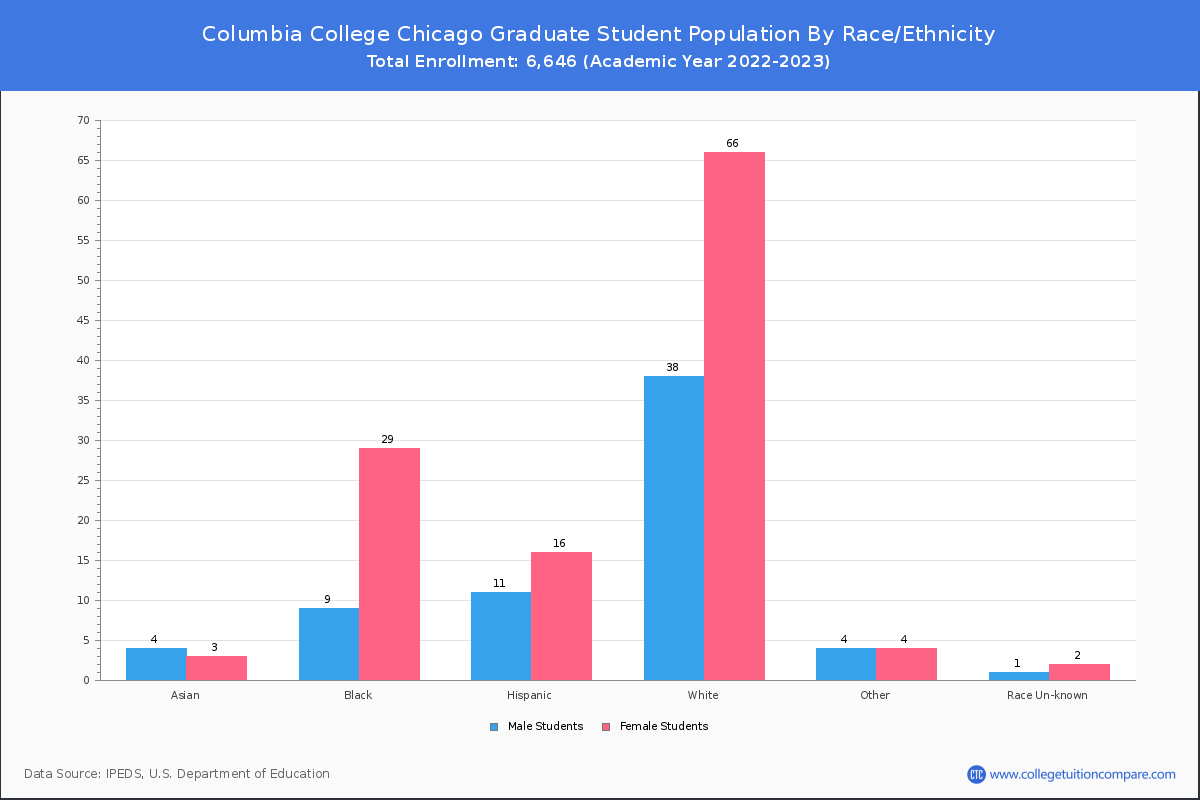
| Race | Total | Men | Women |
|---|---|---|---|
| American Indian or Native American | 1 | 1 | 0 |
| Asian | 19 | 12 | 7 |
| Black | 83 | 36 | 47 |
| Hispanic | 134 | 57 | 77 |
| Native Hawaiian or Other Pacific Islanders | 0 | 0 | 0 |
| White | 203 | 91 | 112 |
| Two or more races | 32 | 9 | 23 |
| Race Unknown | 2 | 1 | 1 |
Transfer-in Students (Undergraduate)
Among 6,424 enrolled in undergraduate programs, 491 students have transferred-in from other institutions. The percentage of transfer-in students is 7.64%.475 students have transferred in as full-time status and 16 students transferred in as part-time status.
| Number of Students | |
|---|---|
| Regular Full-time | 5,636 |
| Transfer-in Full-time | 475 |
| Regular Part-time | 297 |
| Transfer-in Part-time | 16 |