Student Population by Gender
Midwestern University-Downers Grove has a total of 2,758 enrolled students for the academic year 2022-2023. All 2,758 students are enrolled into graduate programs.
By gender, 913 male and 1,845 female students (the male-female ratio is 33:67) are attending the school. The gender distribution is based on the 2022-2023 data.
| Graduate | |
|---|---|
| Total | 2,758 |
| Men | 913 |
| Women | 1,845 |
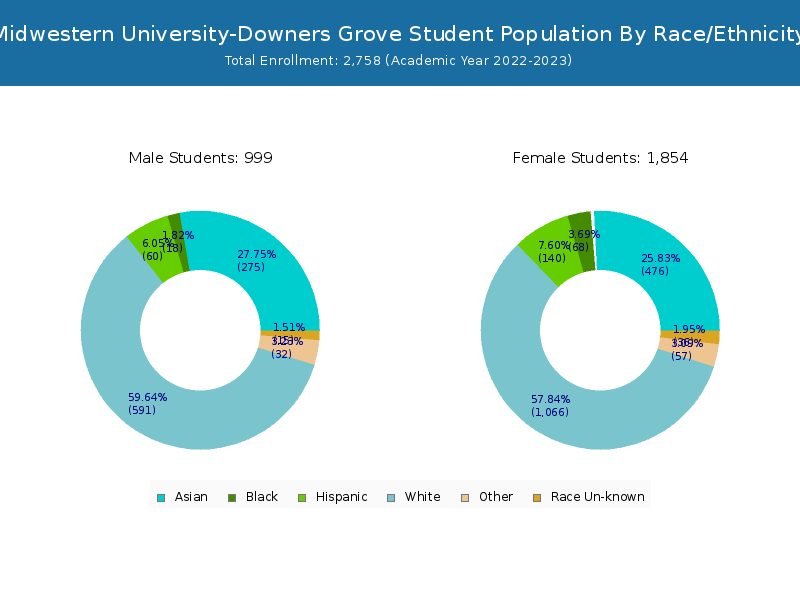
Student Distribution by Race/Ethnicity
By race/ethnicity, 1,569 White, 87 Black, and 729 Asian students out of a total of 2,758 are attending at Midwestern University-Downers Grove. Comprehensive enrollment statistic data by race/ethnicity is shown in the next chart (Academic year 2022-2023 data).
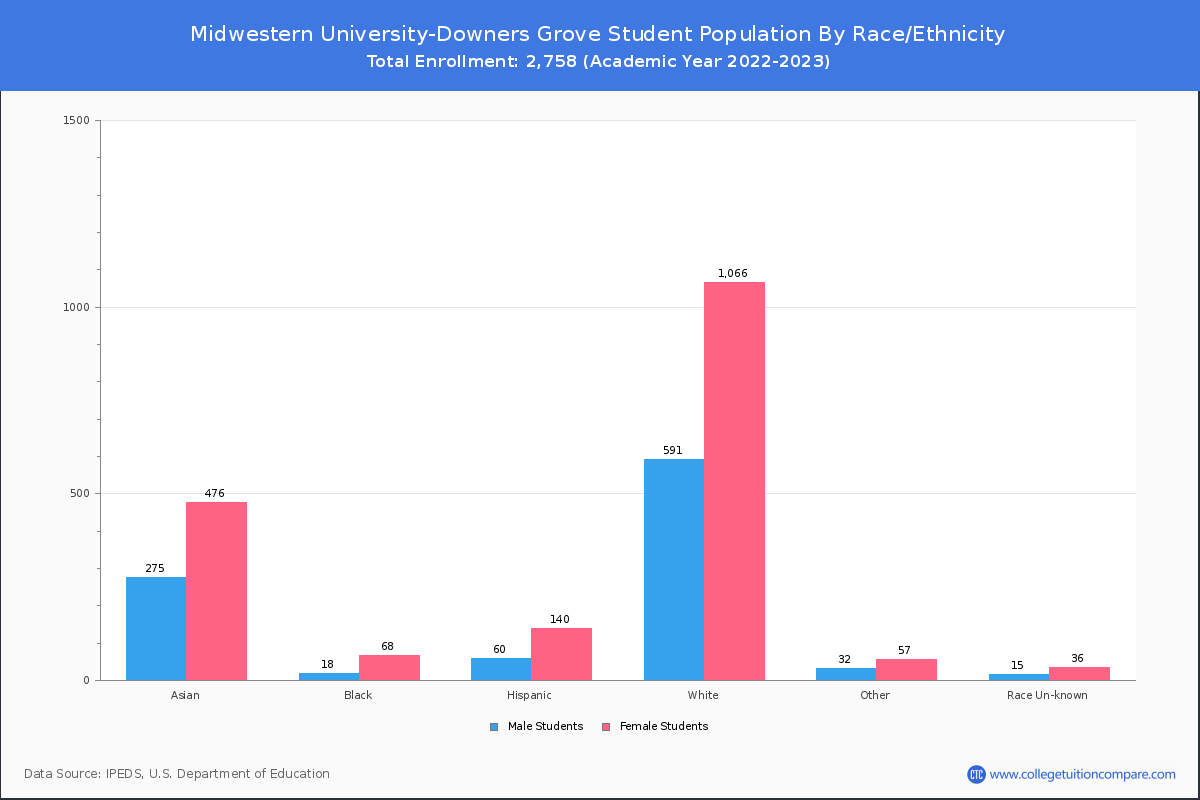
| Race | Total | Men | Women |
|---|---|---|---|
| American Indian or Native American | 1 | 0 | 1 |
| Asian | 729 | 249 | 480 |
| Black | 87 | 23 | 64 |
| Hispanic | 209 | 58 | 151 |
| Native Hawaiian or Other Pacific Islanders | 1 | 1 | 0 |
| White | 1,569 | 534 | 1,035 |
| Two or more races | 91 | 28 | 63 |
| Race Unknown | 43 | 12 | 31 |
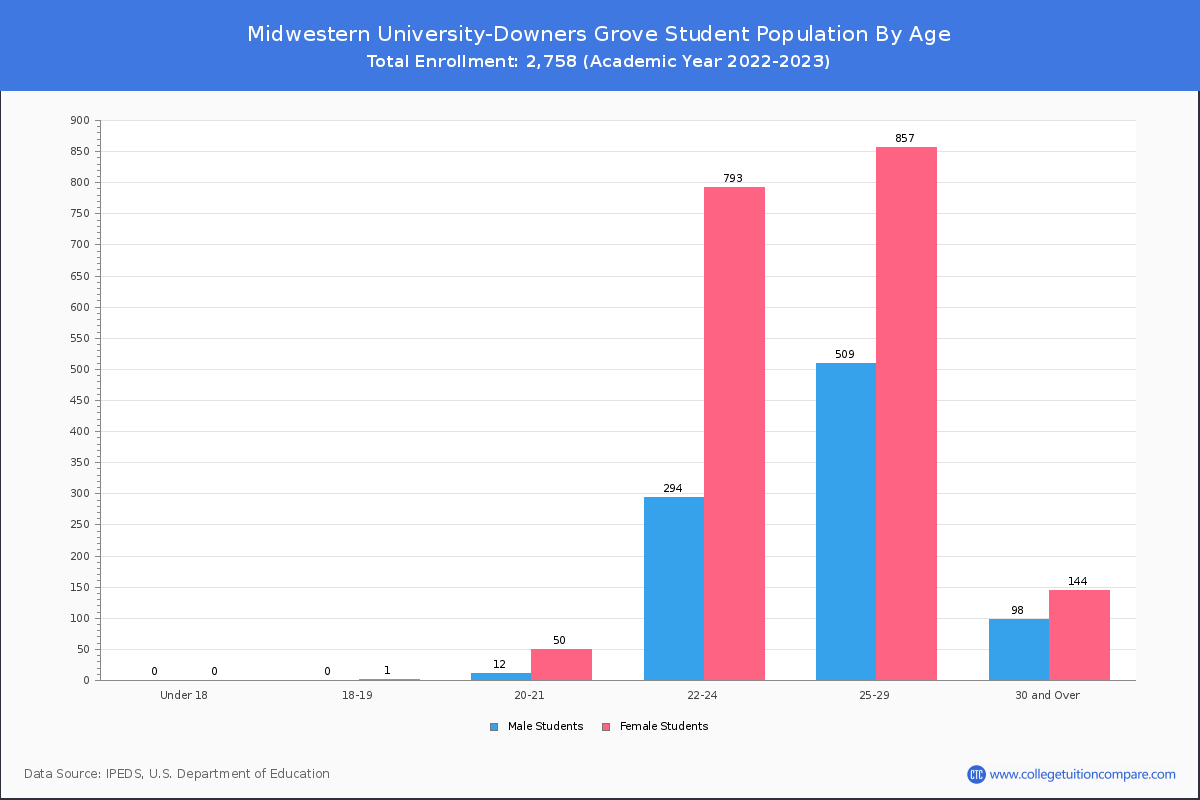
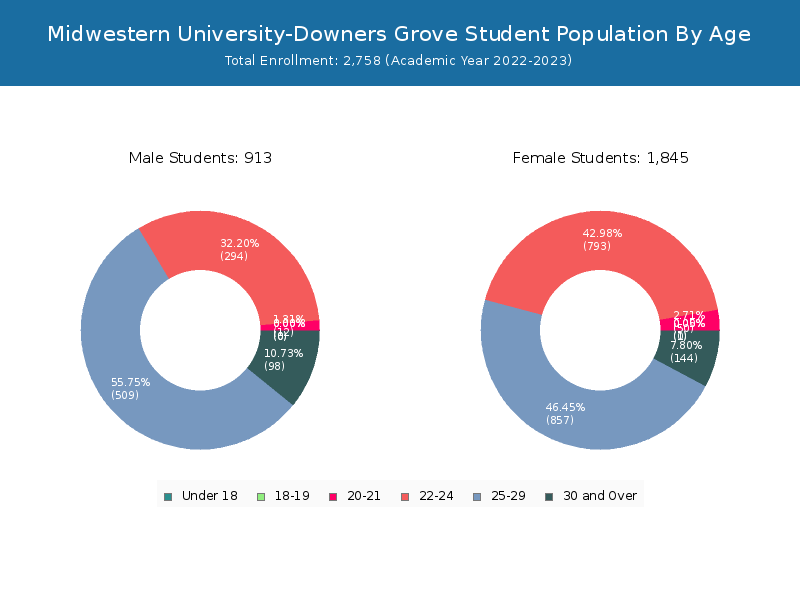
Student Age Distribution
There are 1,150 students under 25 years old, and 1,608 students over 25 years old out of 2,758 total students.
| Age | Total | Men | Women |
|---|