Student Population by Gender
Columbus State University has a total of 7,479 enrolled students for the academic year 2022-2023. 6,003 students have enrolled in undergraduate programs and 1,476 students joined graduate programs.
By gender, 2,972 male and 4,507 female students (the male-female ratio is 40:60) are attending the school. The gender distribution is based on the 2022-2023 data.
| Total | Undergraduate | Graduate | |
|---|---|---|---|
| Total | 7,479 | 6,003 | 1,476 |
| Men | 2,972 | 2,503 | 469 |
| Women | 4,507 | 3,500 | 1,007 |
Student Distribution by Race/Ethnicity
| Race | Total | Men | Women |
|---|---|---|---|
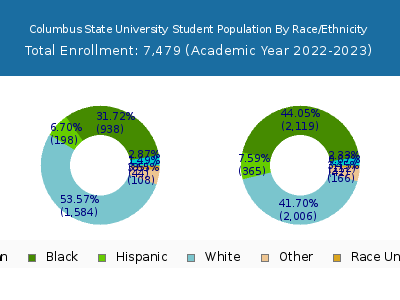
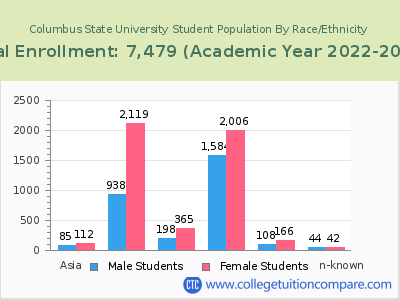
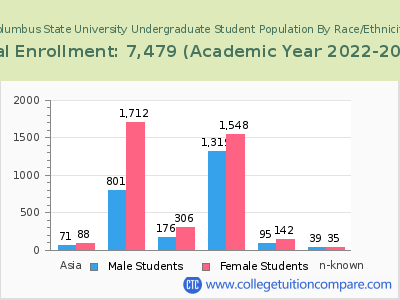
| American Indian or Native American | 19 | 9 | 10 |
| Asian | 218 | 106 | 112 |
| Black | 2,792 | 896 | 1,896 |
| Hispanic | 584 | 241 | 343 |
| Native Hawaiian or Other Pacific Islanders | 15 | 8 | 7 |
| White | 3,281 | 1,468 | 1,813 |
| Two or more races | 278 | 107 | 171 |
| Race Unknown | 137 | 69 | 68 |
| Race | Total | Men | Women |
|---|---|---|---|
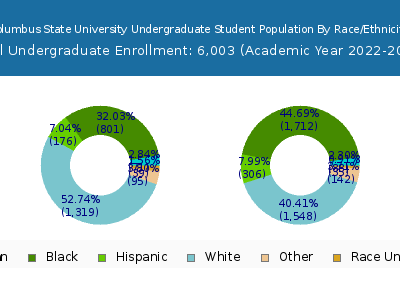
| American Indian or Native American | 17 | 8 | 9 |
| Asian | 173 | 88 | 85 |
| Black | 2,254 | 775 | 1,479 |
| Hispanic | 505 | 216 | 289 |
| Native Hawaiian or Other Pacific Islanders | 13 | 7 | 6 |
| White | 2,585 | 1,215 | 1,370 |
| Two or more races | 246 | 95 | 151 |
| Race Unknown | 128 | 65 | 63 |
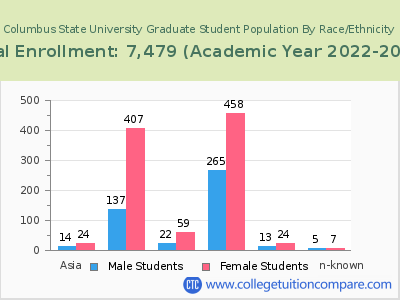
| Race | Total | Men | Women |
|---|---|---|---|
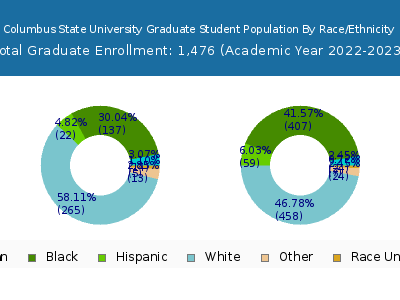
| American Indian or Native American | 1 | 0 | 1 |
| Asian | 13 | 7 | 6 |
| Black | 170 | 58 | 112 |
| Hispanic | 42 | 19 | 23 |
| Native Hawaiian or Other Pacific Islanders | 0 | 0 | 0 |
| White | 181 | 77 | 104 |
| Two or more races | 21 | 8 | 13 |
| Race Unknown | 23 | 12 | 11 |
Student Age Distribution
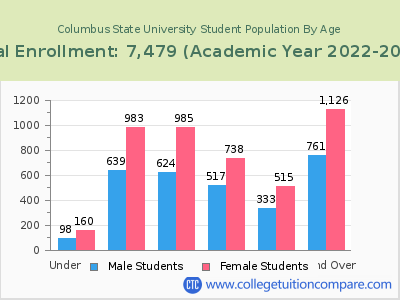
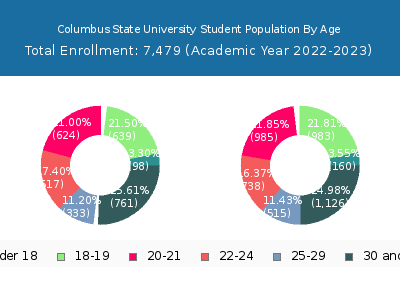
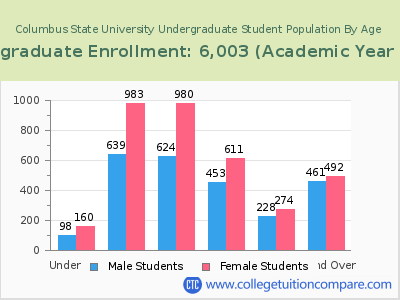
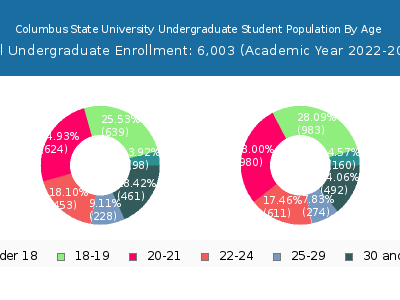
By age, CSU has 258 students under 18 years old and 26 students over 65 years old. There are 4,744 students under 25 years old, and 2,735 students over 25 years old out of 7,479 total students.
In undergraduate programs, 258 students are younger than 18 and 17 students are older than 65. CSU has 4,548 undergraduate students aged under 25 and 1,455 students aged 25 and over.
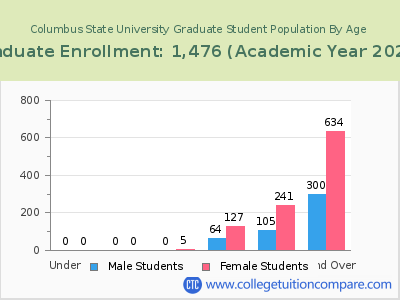
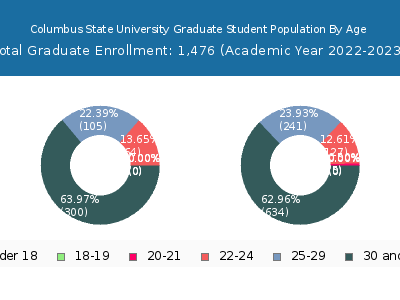
It has 196 graduate students aged under 25 and 1,280 students aged 25 and over.
| Age | Total | Men | Women |
|---|---|---|---|
| Under 18 | 258 | 160 | 98 |
| 18-19 | 1,622 | 983 | 639 |
| 20-21 | 1,609 | 985 | 624 |
| 22-24 | 1,255 | 738 | 517 |
| 25-29 | 848 | 515 | 333 |
| 30-34 | 525 | 305 | 220 |
| 35-39 | 459 | 274 | 185 |
| 40-49 | 623 | 388 | 235 |
| 50-64 | 254 | 147 | 107 |
| Over 65 | 26 | 12 | 14 |
| Age | Total | Men | Women |
|---|---|---|---|
| Under 18 | 258 | 160 | 98 |
| 18-19 | 1,622 | 983 | 639 |
| 20-21 | 1,604 | 980 | 624 |
| 22-24 | 1,064 | 611 | 453 |
| 25-29 | 502 | 274 | 228 |
| 30-34 | 304 | 157 | 147 |
| 35-39 | 226 | 113 | 113 |
| 40-49 | 293 | 160 | 133 |
| 50-64 | 113 | 54 | 59 |
| Over 65 | 17 | 8 | 9 |
| Age | Total | Men | Women |
|---|
Online Student Enrollment
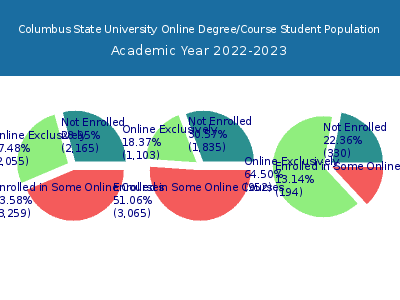
Distance learning, also called online education, is very attractive to students, especially who want to continue education and work in field. At Columbus State University, 2,055 students are enrolled exclusively in online courses and 3,259 students are enrolled in some online courses.
1,717 students lived in Georgia or jurisdiction in which the school is located are enrolled exclusively in online courses and 338 students live in other State or outside of the United States.
| All Students | Enrolled Exclusively Online Courses | Enrolled in Some Online Courses | |
|---|---|---|---|
| All Students | 7,479 | 2,055 | 3,259 |
| Undergraduate | 6,003 | 1,103 | 3,065 |
| Graduate | 1,476 | 952 | 194 |
| Georgia Residents | Other States in U.S. | Outside of U.S. | |
|---|---|---|---|
| All Students | 1,717 | 324 | 14 |
| Undergraduate | 942 | 155 | 6 |
| Graduate | 775 | 169 | 8 |
Transfer-in Students (Undergraduate)
Among 6,003 enrolled in undergraduate programs, 455 students have transferred-in from other institutions. The percentage of transfer-in students is 7.58%.315 students have transferred in as full-time status and 140 students transferred in as part-time status.
| Number of Students | |
|---|---|
| Regular Full-time | 3,860 |
| Transfer-in Full-time | 315 |
| Regular Part-time | 1,688 |
| Transfer-in Part-time | 140 |
