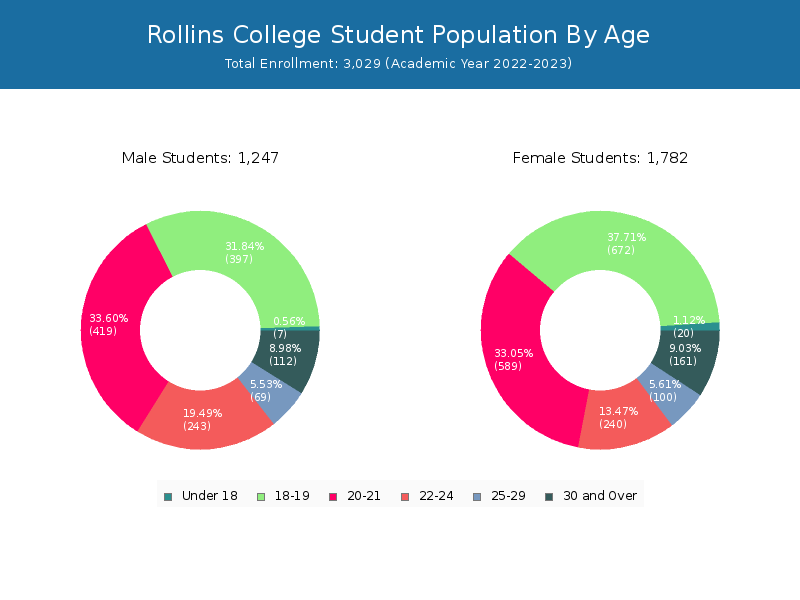
Student Population by Gender
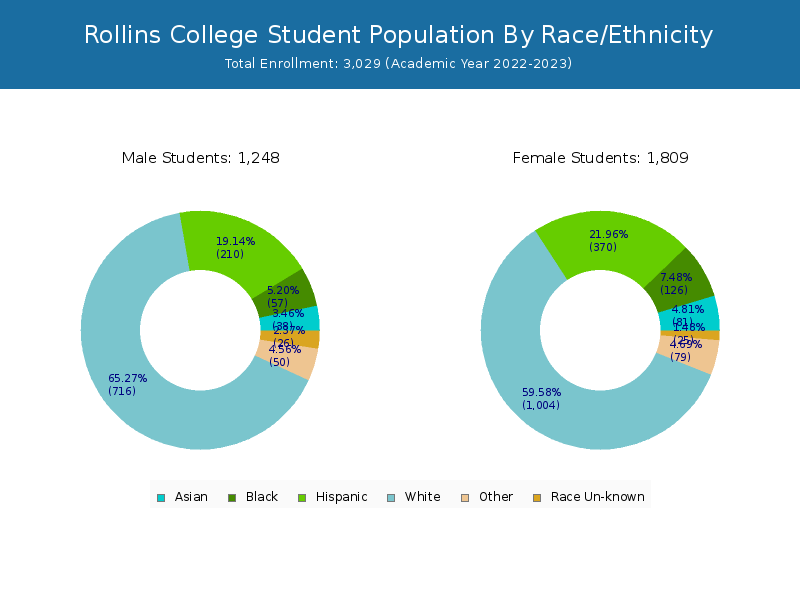
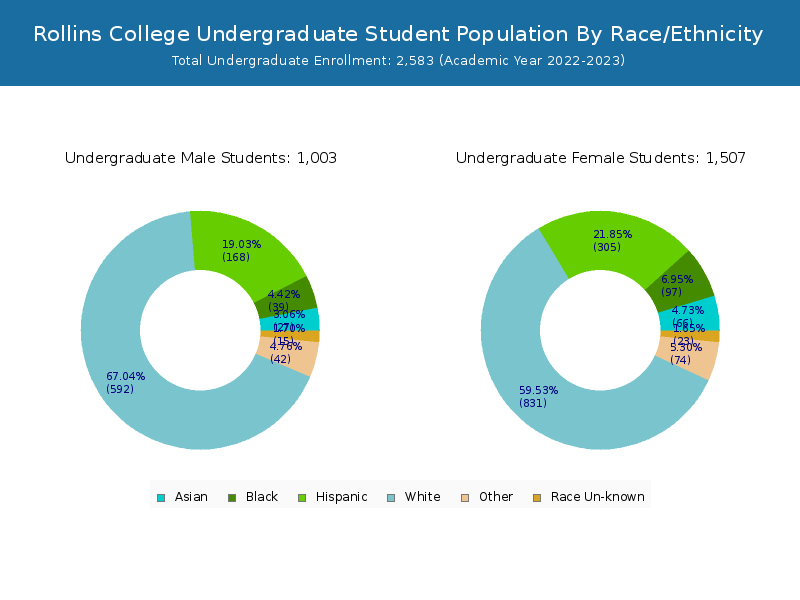
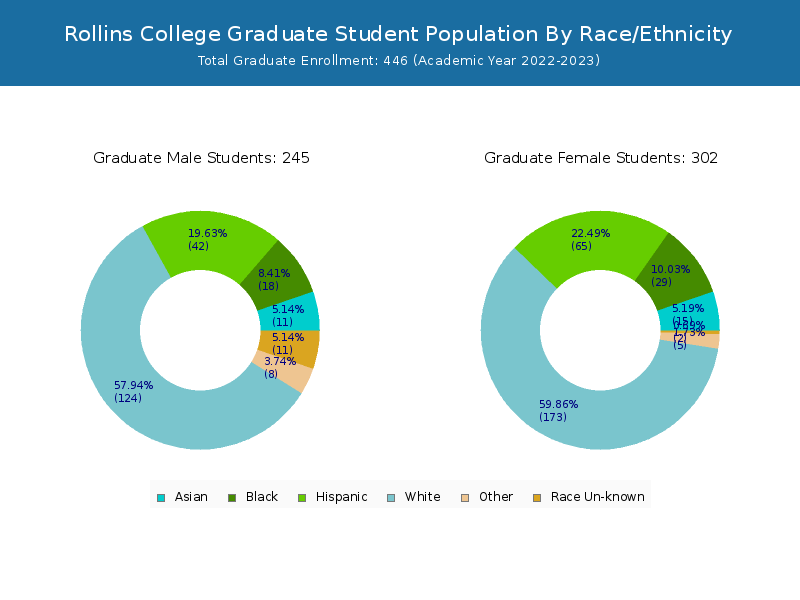
Rollins College has a total of 3,029 enrolled students for the academic year 2022-2023. 2,583 students have enrolled in undergraduate programs and 446 students joined graduate programs.
By gender, 1,247 male and 1,782 female students (the male-female ratio is 41:59) are attending the school. The gender distribution is based on the 2022-2023 data.
| Total | Undergraduate | Graduate | |
|---|---|---|---|
| Total | 3,029 | 2,583 | 446 |
| Men | 1,247 | 1,042 | 205 |
| Women | 1,782 | 1,541 | 241 |
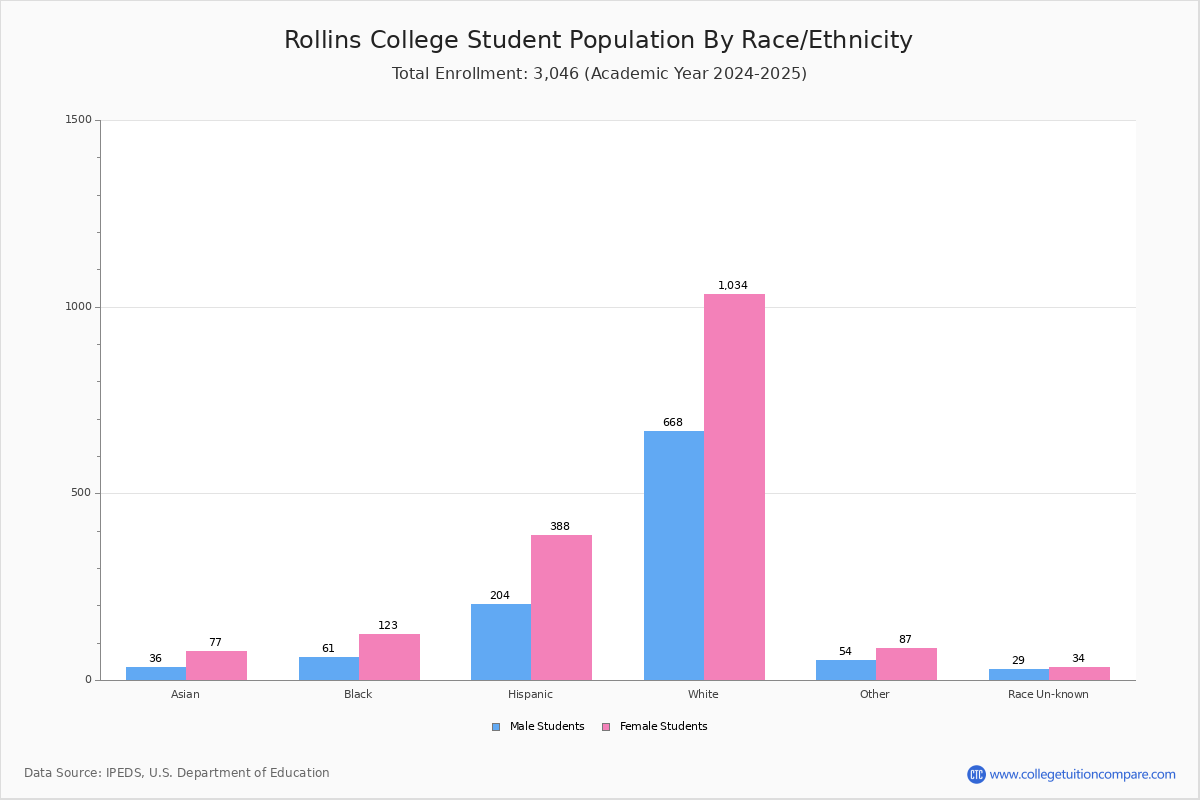
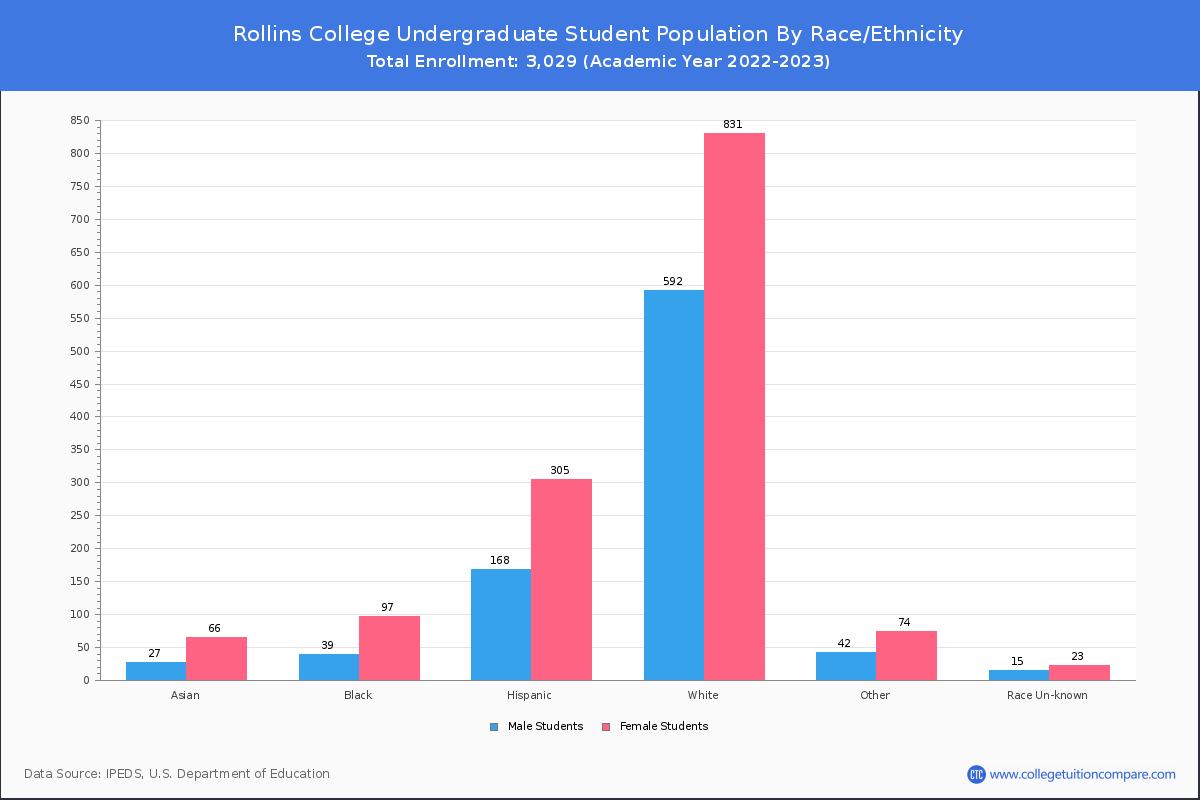
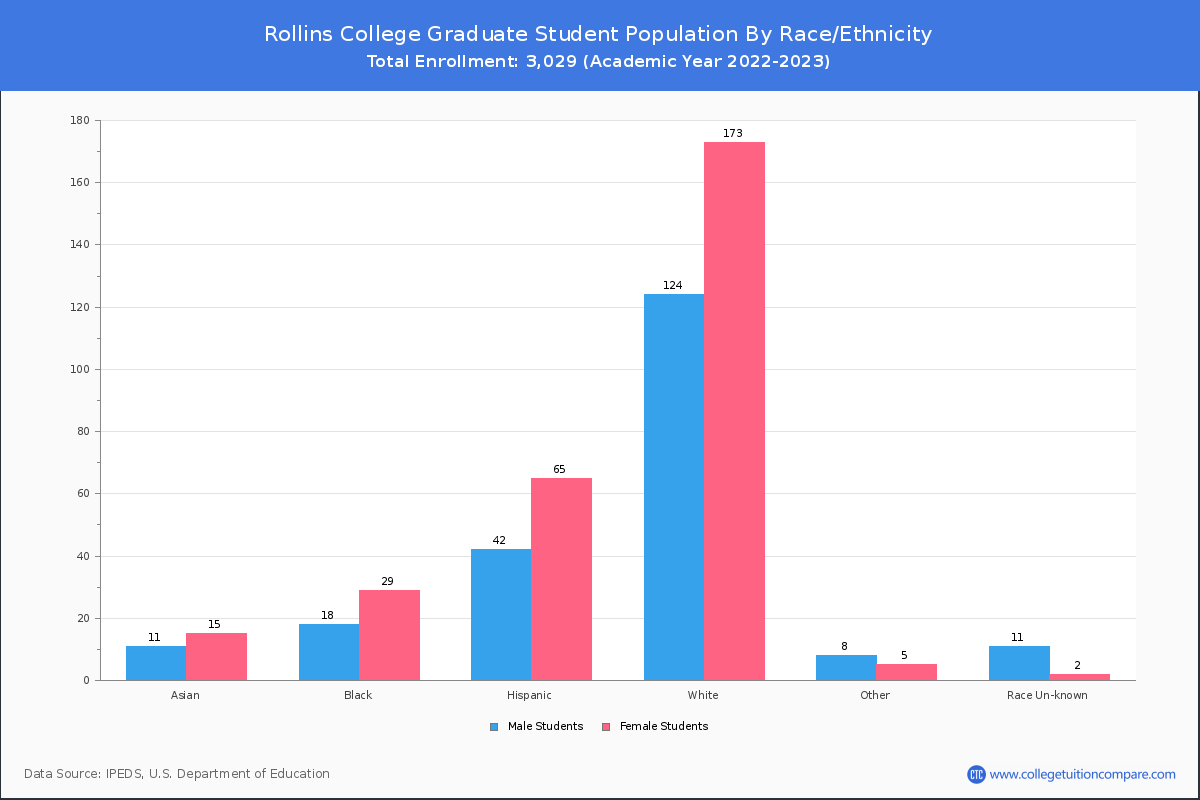
Student Distribution by Race/Ethnicity
By race/ethnicity, 1,737 White, 192 Black, and 109 Asian students out of a total of 3,029 are attending at Rollins College. Comprehensive enrollment statistic data by race/ethnicity is shown in the next chart (Academic year 2022-2023 data).
| Race | Total | Men | Women |
|---|---|---|---|
| American Indian or Native American | 6 | 2 | 4 |
| Asian | 109 | 37 | 72 |
| Black | 192 | 64 | 128 |
| Hispanic | 534 | 192 | 342 |
| Native Hawaiian or Other Pacific Islanders | 4 | 1 | 3 |
| White | 1,737 | 733 | 1,004 |
| Two or more races | 120 | 50 | 70 |
| Race Unknown | 58 | 28 | 30 |
| Race | Total | Men | Women |
|---|---|---|---|
| American Indian or Native American | 2 | 1 | 1 |
| Asian | 88 | 30 | 58 |
| Black | 150 | 46 | 104 |
| Hispanic | 443 | 158 | 285 |
| Native Hawaiian or Other Pacific Islanders | 4 | 1 | 3 |
| White | 1,502 | 625 | 877 |
| Two or more races | 113 | 44 | 69 |
| Race Unknown | 48 | 20 | 28 |
| Race | Total | Men | Women |
|---|---|---|---|
| American Indian or Native American | 0 | 0 | 0 |
| Asian | 3 | 0 | 3 |
| Black | 8 | 4 | 4 |
| Hispanic | 16 | 6 | 10 |
| Native Hawaiian or Other Pacific Islanders | 0 | 0 | 0 |
| White | 60 | 28 | 32 |
| Two or more races | 6 | 6 | 0 |
| Race Unknown | 4 | 2 | 2 |
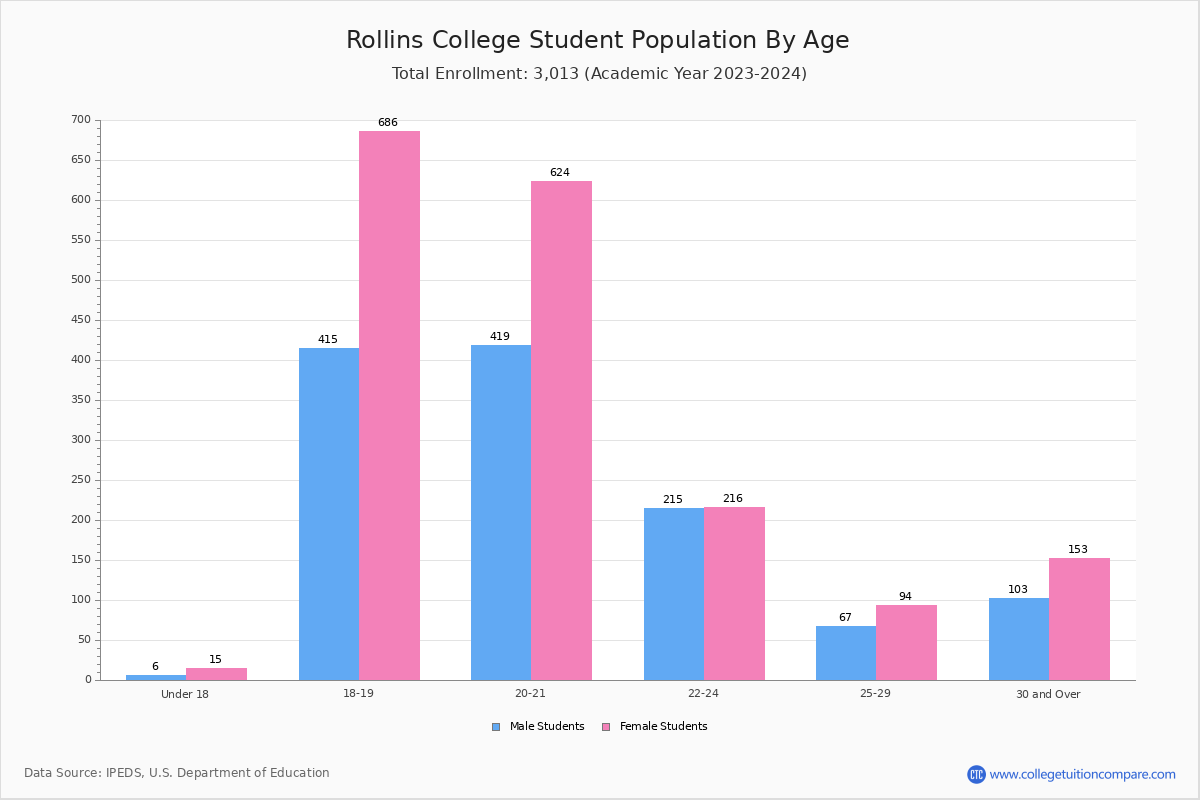
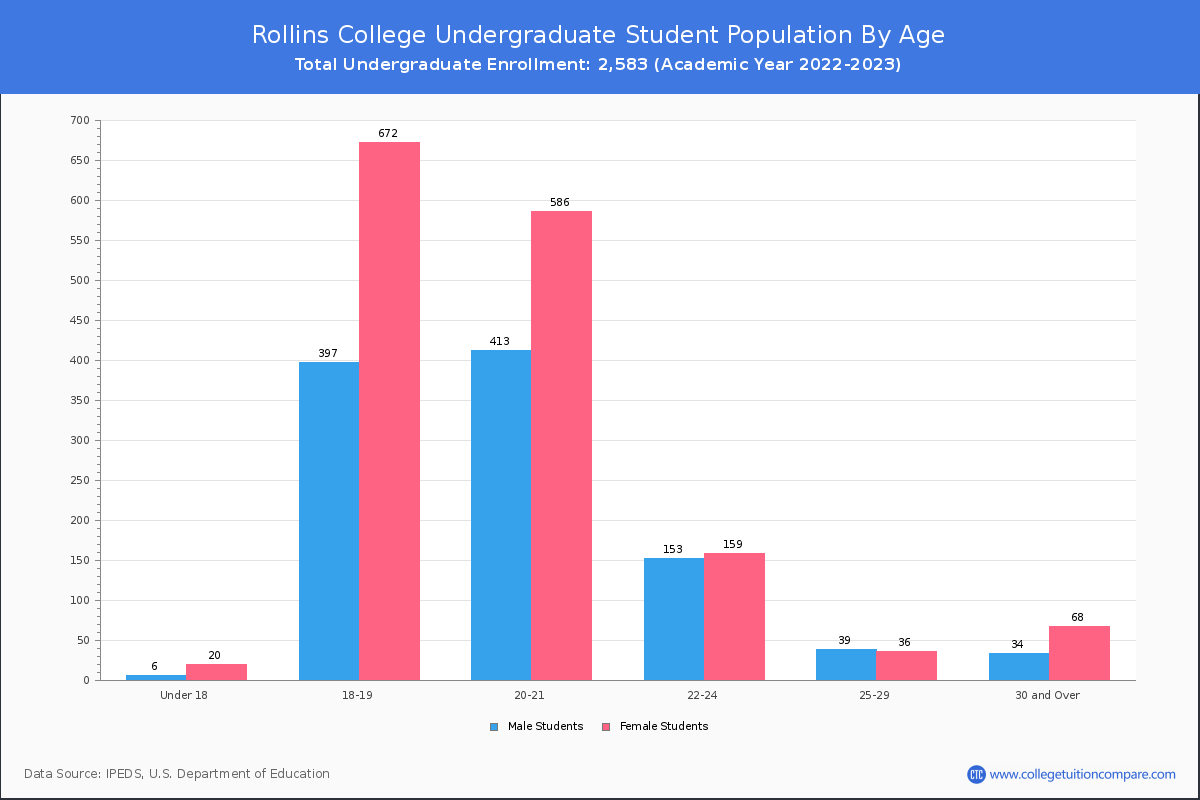
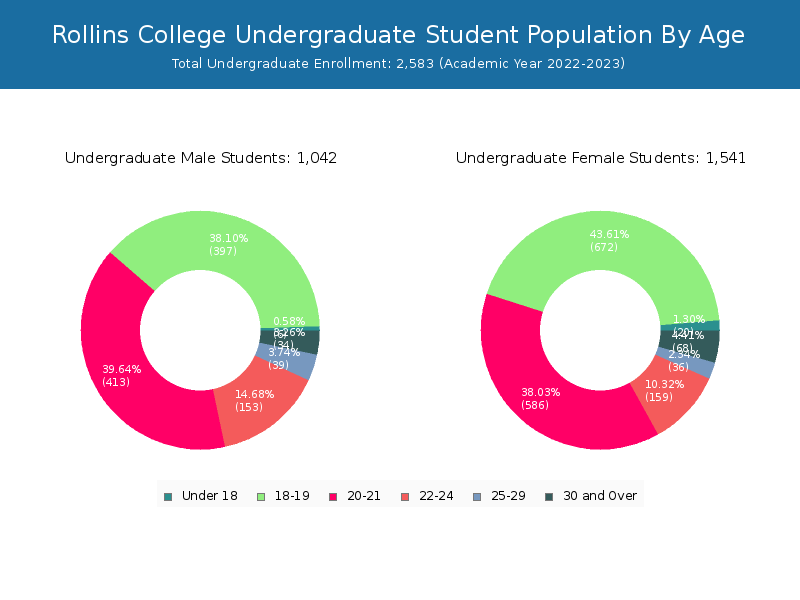
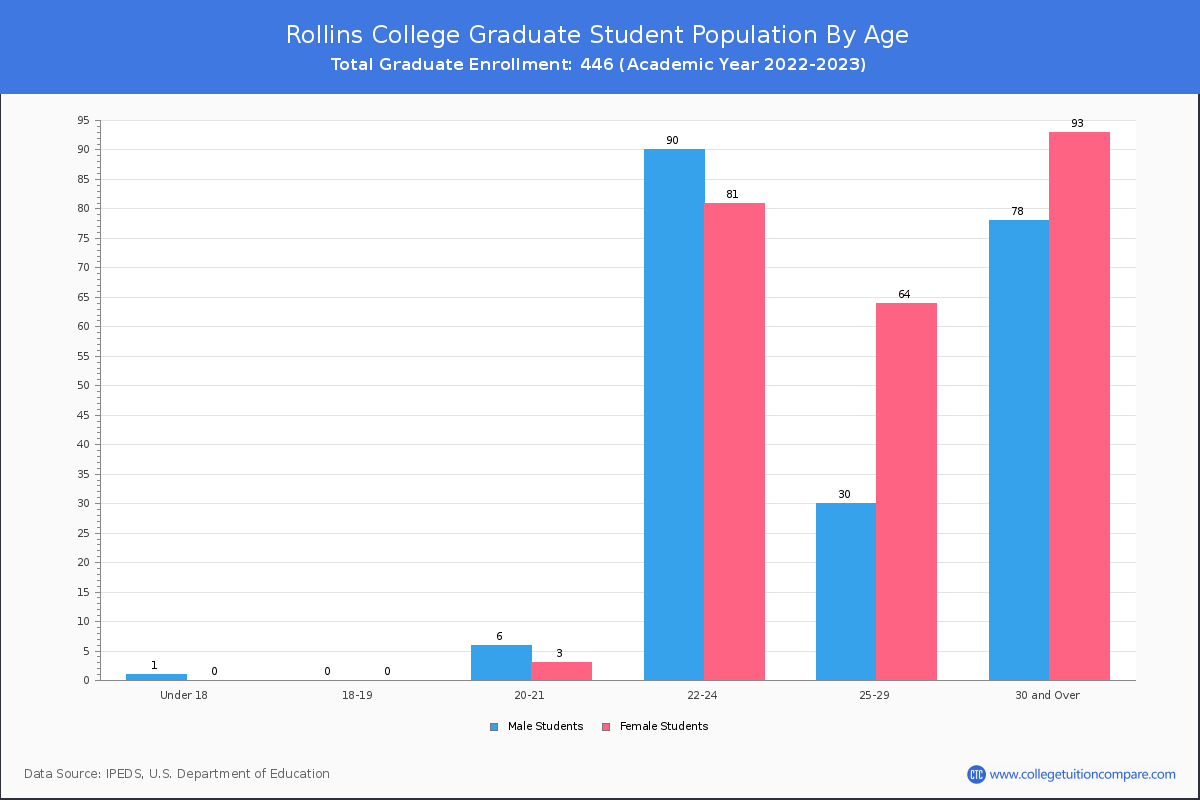
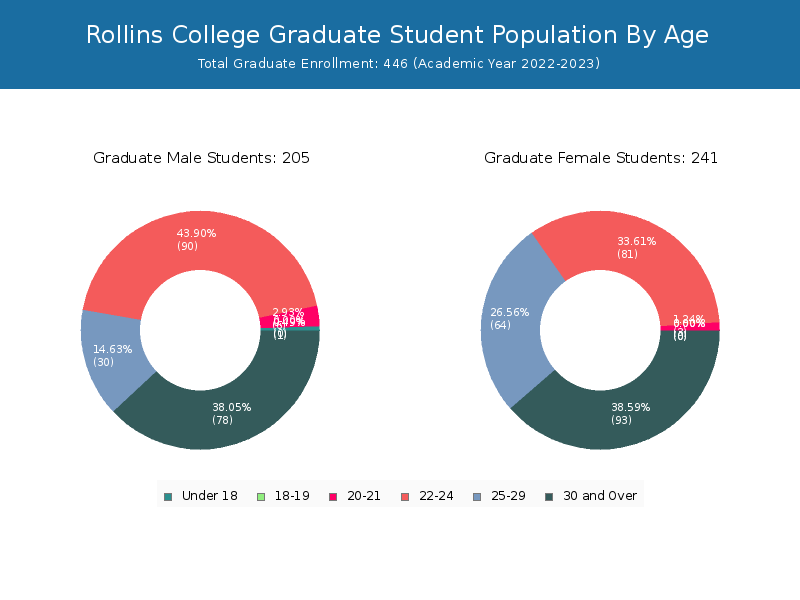
Student Age Distribution
By age, Rollins has 27 students under 18 years old and 3 students over 65 years old. There are 2,587 students under 25 years old, and 442 students over 25 years old out of 3,029 total students.
Rollins has 2,406 undergraduate students aged under 25 and 177 students aged 25 and over.
In graduate schools at Rollins, 1 students are younger than 18 and 3 students are older than 65. It has 181 graduate students aged under 25 and 265 students aged 25 and over.
| Age | Total | Men | Women |
|---|---|---|---|
| Under 18 | 27 | 20 | 7 |
| 18-19 | 1,069 | 672 | 397 |
| 20-21 | 1,008 | 589 | 419 |
| 22-24 | 483 | 240 | 243 |
| 25-29 | 169 | 100 | 69 |
| 30-34 | 91 | 50 | 41 |
| 35-39 | 58 | 37 | 21 |
| 40-49 | 73 | 49 | 24 |
| 50-64 | 48 | 24 | 24 |
| Over 65 | 3 | 1 | 2 |
| Age | Total | Men | Women |
|---|---|---|---|
| Under 18 | 26 | 20 | 6 |
| 18-19 | 1,069 | 672 | 397 |
| 20-21 | 999 | 586 | 413 |
| 22-24 | 312 | 159 | 153 |
| 25-29 | 75 | 36 | 39 |
| 30-34 | 32 | 18 | 14 |
| 35-39 | 23 | 16 | 7 |
| 40-49 | 23 | 18 | 5 |
| 50-64 | 24 | 16 | 8 |
| Age | Total | Men | Women |
|---|---|---|---|
| Under 18 | 1 | 0 | 1 |
Transfer-in Students (Undergraduate)
Among 2,583 enrolled in undergraduate programs, 105 students have transferred-in from other institutions. The percentage of transfer-in students is 4.07%.
| Number of Students | |
|---|---|
| Regular Full-time | 2,391 |
| Transfer-in Full-time | 105 |