Student Population by Gender
Western Connecticut State University has a total of 4,417 enrolled students for the academic year 2022-2023. 3,799 students have enrolled in undergraduate programs and 618 students joined graduate programs.
By gender, 2,004 male and 2,413 female students (the male-female ratio is 45:55) are attending the school. The gender distribution is based on the 2022-2023 data.
| Total | Undergraduate | Graduate | |
|---|---|---|---|
| Total | 4,417 | 3,799 | 618 |
| Men | 2,004 | 1,844 | 160 |
| Women | 2,413 | 1,955 | 458 |
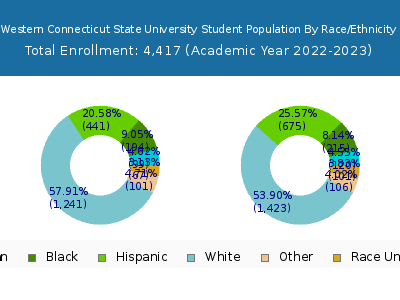
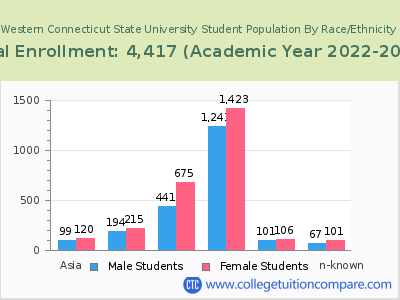
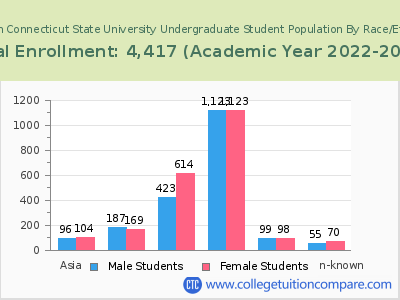
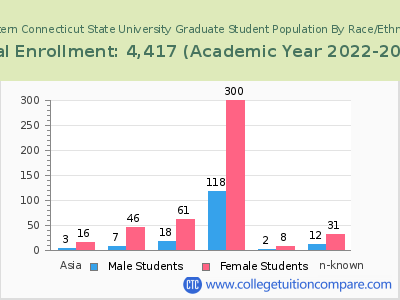
Student Distribution by Race/Ethnicity
| Race | Total | Men | Women |
|---|---|---|---|
| American Indian or Native American | 14 | 6 | 8 |
| Asian | 202 | 90 | 112 |
| Black | 385 | 190 | 195 |
| Hispanic | 1,104 | 439 | 665 |
| Native Hawaiian or Other Pacific Islanders | 0 | 0 | 0 |
| White | 2,369 | 1,116 | 1,253 |
| Two or more races | 211 | 114 | 97 |
| Race Unknown | 115 | 43 | 72 |
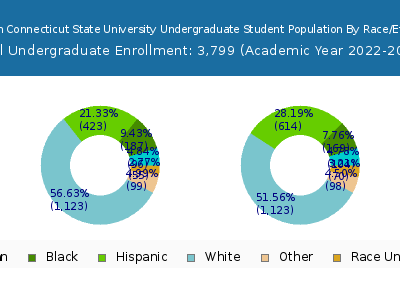
| Race | Total | Men | Women |
|---|---|---|---|
| American Indian or Native American | 13 | 6 | 7 |
| Asian | 183 | 85 | 98 |
| Black | 330 | 180 | 150 |
| Hispanic | 1,026 | 418 | 608 |
| Native Hawaiian or Other Pacific Islanders | 0 | 0 | 0 |
| White | 1,966 | 1,010 | 956 |
| Two or more races | 204 | 111 | 93 |
| Race Unknown | 68 | 31 | 37 |
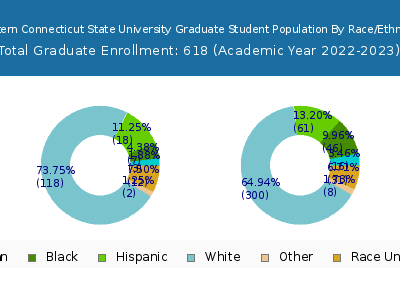
| Race | Total | Men | Women |
|---|---|---|---|
| American Indian or Native American | 1 | 0 | 1 |
| Asian | 19 | 7 | 12 |
| Black | 21 | 11 | 10 |
| Hispanic | 100 | 37 | 63 |
| Native Hawaiian or Other Pacific Islanders | 0 | 0 | 0 |
| White | 147 | 70 | 77 |
| Two or more races | 14 | 5 | 9 |
| Race Unknown | 8 | 5 | 3 |
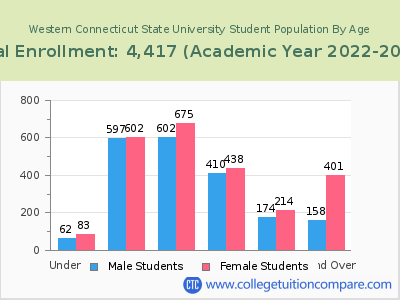
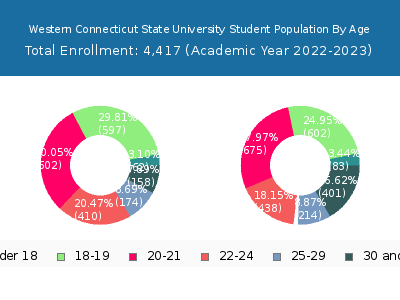
Student Age Distribution
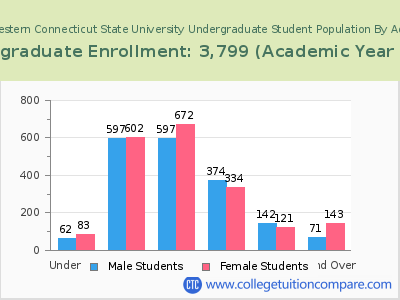
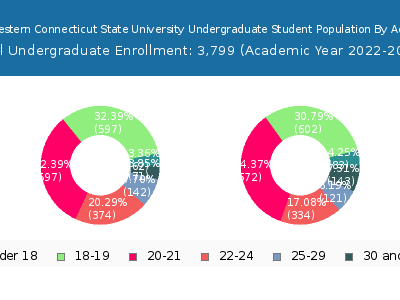
By age, WCSU has 145 students under 18 years old and 46 students over 65 years old. There are 3,469 students under 25 years old, and 947 students over 25 years old out of 4,417 total students.
In undergraduate programs, 145 students are younger than 18 and 8 students are older than 65. WCSU has 3,321 undergraduate students aged under 25 and 477 students aged 25 and over.
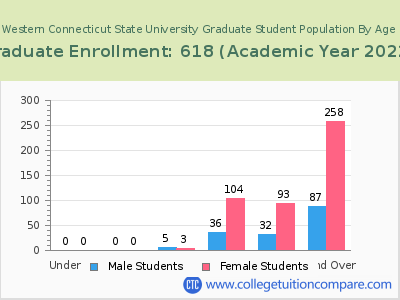
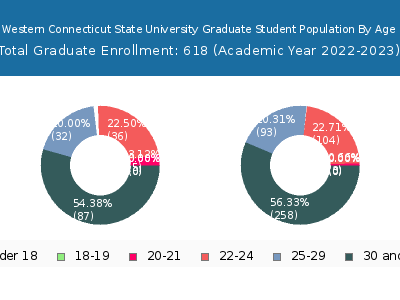
It has 148 graduate students aged under 25 and 470 students aged 25 and over.
| Age | Total | Men | Women |
|---|---|---|---|
| Under 18 | 145 | 83 | 62 |
| 18-19 | 1,199 | 602 | 597 |
| 20-21 | 1,277 | 675 | 602 |
| 22-24 | 848 | 438 | 410 |
| 25-29 | 388 | 214 | 174 |
| 30-34 | 154 | 96 | 58 |
| 35-39 | 111 | 83 | 28 |
| 40-49 | 142 | 113 | 29 |
| 50-64 | 106 | 83 | 23 |
| Over 65 | 46 | 26 | 20 |
| Age | Total | Men | Women |
|---|---|---|---|
| Under 18 | 145 | 83 | 62 |
| 18-19 | 1,199 | 602 | 597 |
| 20-21 | 1,269 | 672 | 597 |
| 22-24 | 708 | 334 | 374 |
| 25-29 | 263 | 121 | 142 |
| 30-34 | 79 | 47 | 32 |
| 35-39 | 42 | 26 | 16 |
| 40-49 | 58 | 46 | 12 |
| 50-64 | 27 | 22 | 5 |
| Over 65 | 8 | 2 | 6 |
| Age | Total | Men | Women |
|---|
Online Student Enrollment
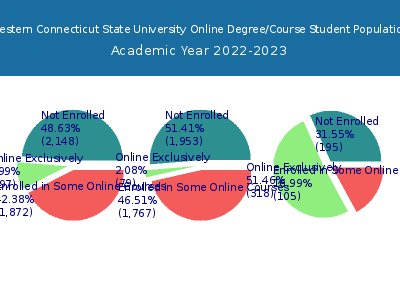
Distance learning, also called online education, is very attractive to students, especially who want to continue education and work in field. At Western Connecticut State University, 397 students are enrolled exclusively in online courses and 1,872 students are enrolled in some online courses.
308 students lived in Connecticut or jurisdiction in which the school is located are enrolled exclusively in online courses and 89 students live in other State or outside of the United States.
| All Students | Enrolled Exclusively Online Courses | Enrolled in Some Online Courses | |
|---|---|---|---|
| All Students | 4,417 | 397 | 1,872 |
| Undergraduate | 3,799 | 79 | 1,767 |
| Graduate | 618 | 318 | 105 |
| Connecticut Residents | Other States in U.S. | Outside of U.S. | |
|---|---|---|---|
| All Students | 308 | 86 | 3 |
| Undergraduate | 68 | 11 | 0 |
| Graduate | 240 | 75 | 3 |
Transfer-in Students (Undergraduate)
Among 3,799 enrolled in undergraduate programs, 312 students have transferred-in from other institutions. The percentage of transfer-in students is 8.21%.248 students have transferred in as full-time status and 64 students transferred in as part-time status.
| Number of Students | |
|---|---|
| Regular Full-time | 2,917 |
| Transfer-in Full-time | 248 |
| Regular Part-time | 570 |
| Transfer-in Part-time | 64 |
