Student Population by Gender
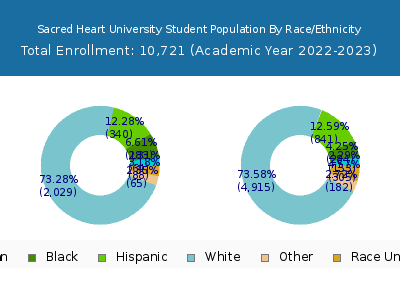
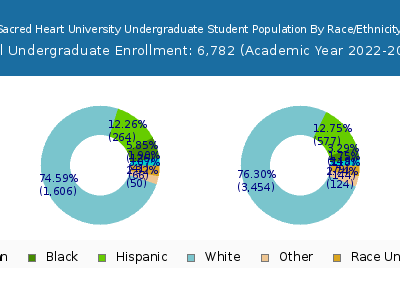
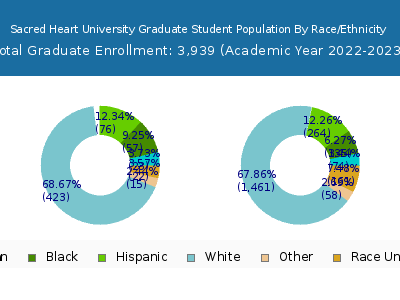
Sacred Heart University has a total of 10,721 enrolled students for the academic year 2022-2023. 6,782 students have enrolled in undergraduate programs and 3,939 students joined graduate programs.
By gender, 3,720 male and 7,001 female students (the male-female ratio is 35:65) are attending the school. The gender distribution is based on the 2022-2023 data.
| Total | Undergraduate | Graduate | |
|---|---|---|---|
| Total | 10,721 | 6,782 | 3,939 |
| Men | 3,720 | 2,245 | 1,475 |
| Women | 7,001 | 4,537 | 2,464 |
Student Distribution by Race/Ethnicity
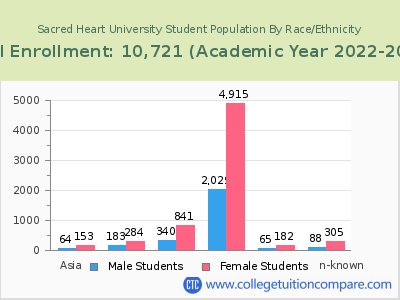
| Race | Total | Men | Women |
|---|---|---|---|
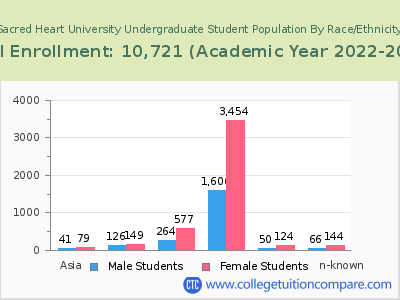
| American Indian or Native American | 5 | 3 | 2 |
| Asian | 199 | 60 | 139 |
| Black | 442 | 174 | 268 |
| Hispanic | 1,104 | 350 | 754 |
| Native Hawaiian or Other Pacific Islanders | 3 | 2 | 1 |
| White | 6,932 | 2,036 | 4,896 |
| Two or more races | 223 | 57 | 166 |
| Race Unknown | 345 | 84 | 261 |
| Race | Total | Men | Women |
|---|---|---|---|
| American Indian or Native American | 4 | 3 | 1 |
| Asian | 103 | 38 | 65 |
| Black | 248 | 119 | 129 |
| Hispanic | 831 | 286 | 545 |
| Native Hawaiian or Other Pacific Islanders | 1 | 1 | 0 |
| White | 5,173 | 1,645 | 3,528 |
| Two or more races | 167 | 46 | 121 |
| Race Unknown | 175 | 62 | 113 |
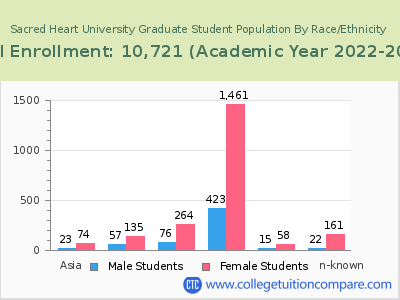
| Race | Total | Men | Women |
|---|---|---|---|
| American Indian or Native American | 0 | 0 | 0 |
| Asian | 6 | 4 | 2 |
| Black | 9 | 4 | 5 |
| Hispanic | 18 | 6 | 12 |
| Native Hawaiian or Other Pacific Islanders | 1 | 1 | 0 |
| White | 99 | 50 | 49 |
| Two or more races | 2 | 1 | 1 |
| Race Unknown | 0 | 0 | 0 |
Student Age Distribution
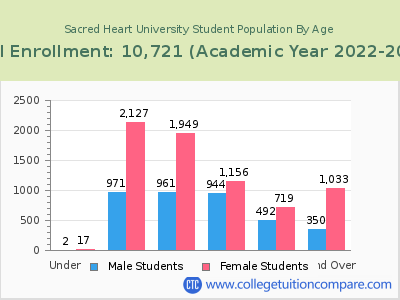
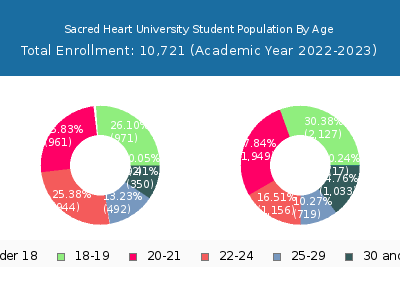
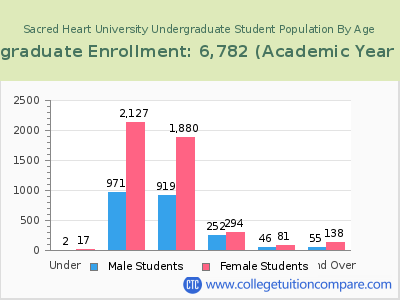
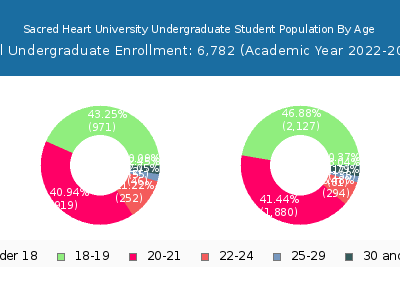
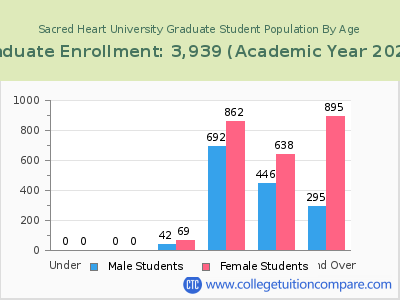
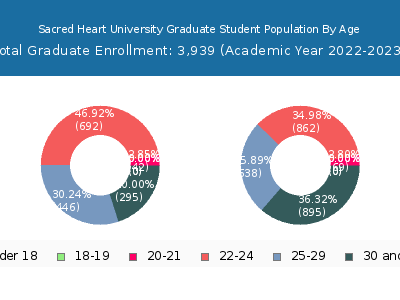
By age, SHU has 19 students under 18 years old and 6 students over 65 years old. There are 8,127 students under 25 years old, and 2,594 students over 25 years old out of 10,721 total students.
SHU has 6,462 undergraduate students aged under 25 and 320 students aged 25 and over.
It has 1,665 graduate students aged under 25 and 2,274 students aged 25 and over.
| Age | Total | Men | Women |
|---|---|---|---|
| Under 18 | 19 | 17 | 2 |
| 18-19 | 3,098 | 2,127 | 971 |
| 20-21 | 2,910 | 1,949 | 961 |
| 22-24 | 2,100 | 1,156 | 944 |
| 25-29 | 1,211 | 719 | 492 |
| 30-34 | 538 | 383 | 155 |
| 35-39 | 246 | 178 | 68 |
| 40-49 | 378 | 291 | 87 |
| 50-64 | 215 | 179 | 36 |
| Over 65 | 6 | 2 | 4 |
| Age | Total | Men | Women |
|---|---|---|---|
| Under 18 | 19 | 17 | 2 |
| 18-19 | 3,098 | 2,127 | 971 |
| 20-21 | 2,799 | 1,880 | 919 |
| 22-24 | 546 | 294 | 252 |
| 25-29 | 127 | 81 | 46 |
| 30-34 | 79 | 52 | 27 |
| 35-39 | 34 | 27 | 7 |
| 40-49 | 54 | 35 | 19 |
| 50-64 | 26 | 24 | 2 |
| Age | Total | Men | Women |
|---|
Online Student Enrollment
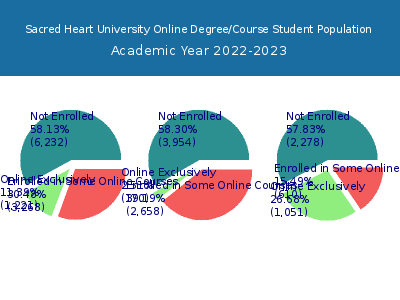
Distance learning, also called online education, is very attractive to students, especially who want to continue education and work in field. At Sacred Heart University, 1,221 students are enrolled exclusively in online courses and 3,268 students are enrolled in some online courses.
803 students lived in Connecticut or jurisdiction in which the school is located are enrolled exclusively in online courses and 418 students live in other State or outside of the United States.
| All Students | Enrolled Exclusively Online Courses | Enrolled in Some Online Courses | |
|---|---|---|---|
| All Students | 10,721 | 1,221 | 3,268 |
| Undergraduate | 6,782 | 170 | 2,658 |
| Graduate | 3,939 | 1,051 | 610 |
| Connecticut Residents | Other States in U.S. | Outside of U.S. | |
|---|---|---|---|
| All Students | 803 | 415 | 3 |
| Undergraduate | 122 | 47 | 1 |
| Graduate | 681 | 368 | 2 |
Transfer-in Students (Undergraduate)
Among 6,782 enrolled in undergraduate programs, 140 students have transferred-in from other institutions. The percentage of transfer-in students is 2.06%.128 students have transferred in as full-time status and 12 students transferred in as part-time status.
| Number of Students | |
|---|---|
| Regular Full-time | 6,149 |
| Transfer-in Full-time | 128 |
| Regular Part-time | 493 |
| Transfer-in Part-time | 12 |
