Student Population by Gender
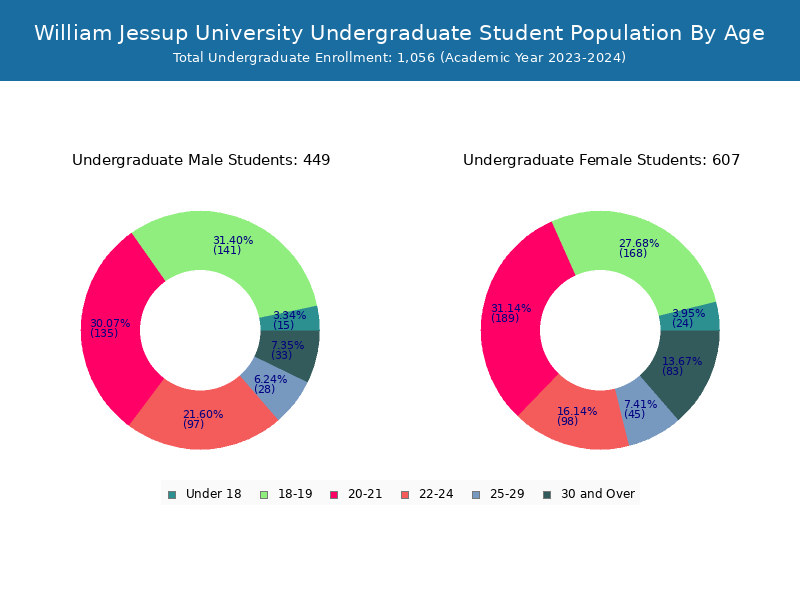
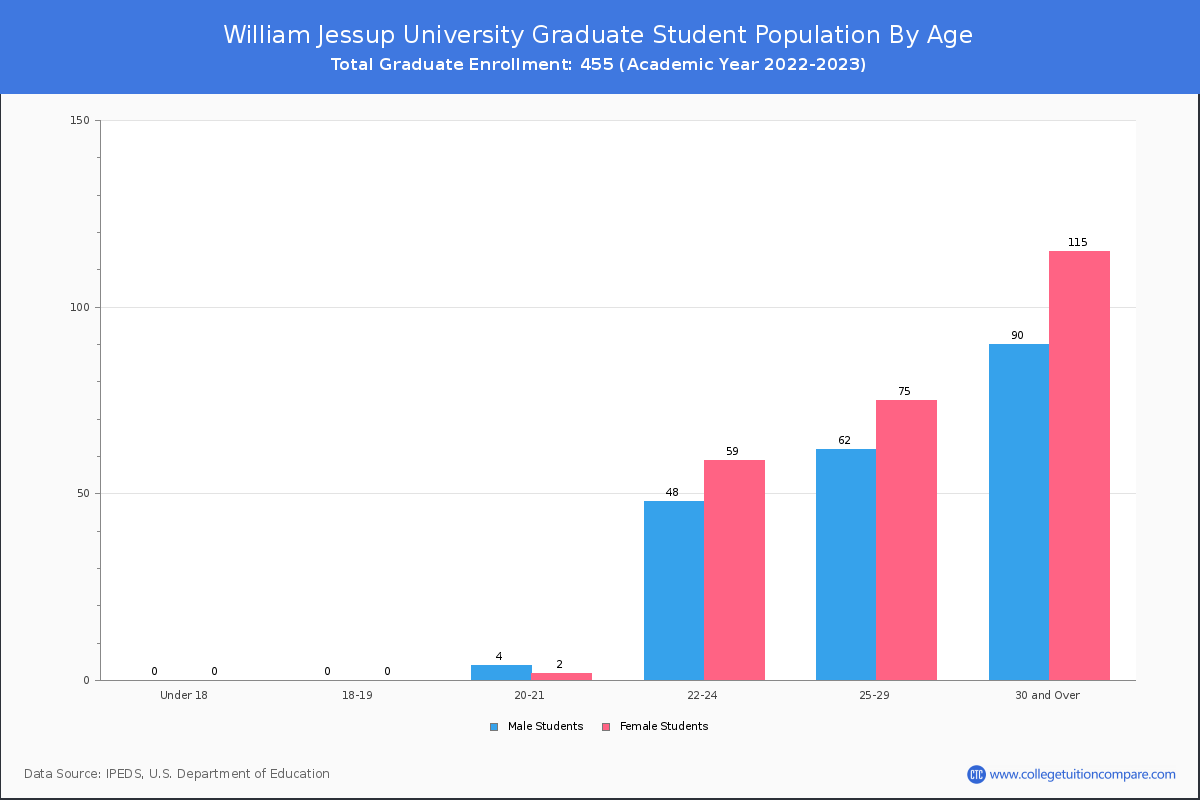
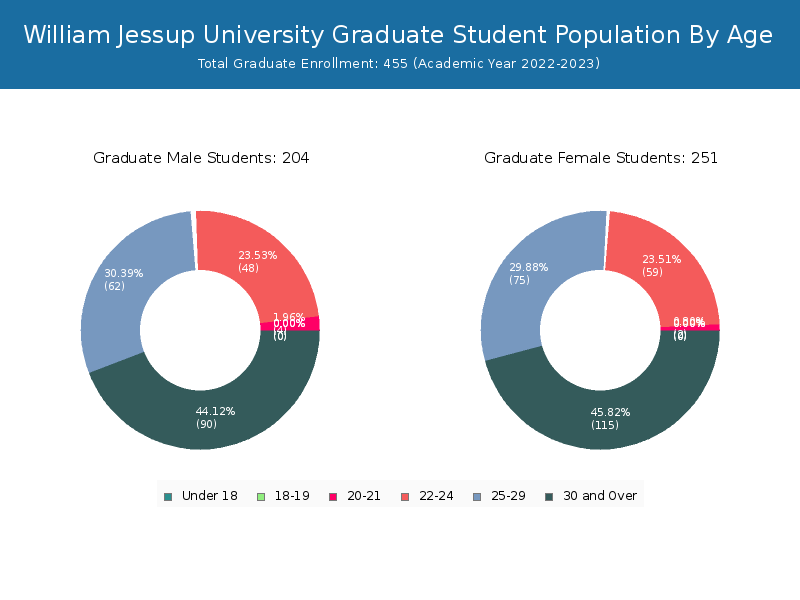
William Jessup University has a total of 1,624 enrolled students for the academic year 2022-2023. 1,169 students have enrolled in undergraduate programs and 455 students joined graduate programs.
By gender, 687 male and 937 female students (the male-female ratio is 42:58) are attending the school. The gender distribution is based on the 2022-2023 data.
| Total | Undergraduate | Graduate | |
|---|---|---|---|
| Total | 1,624 | 1,169 | 455 |
| Men | 687 | 483 | 204 |
| Women | 937 | 686 | 251 |
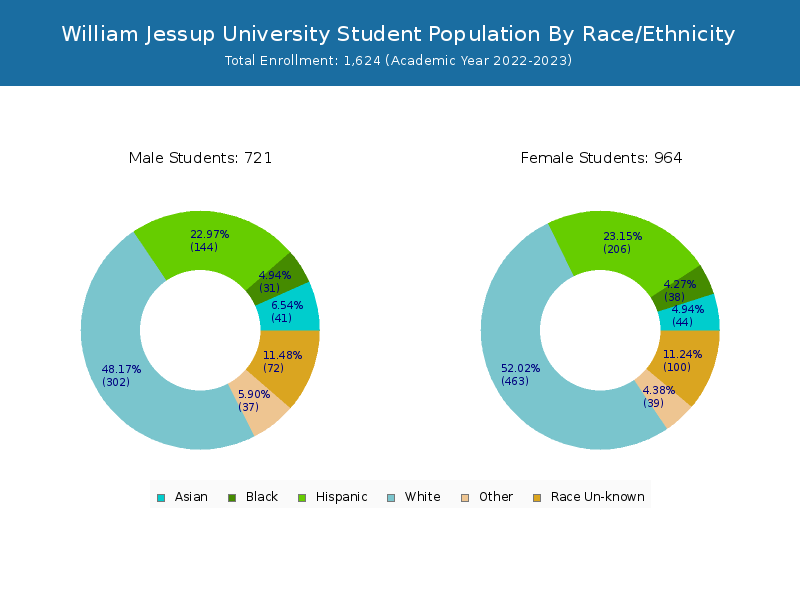
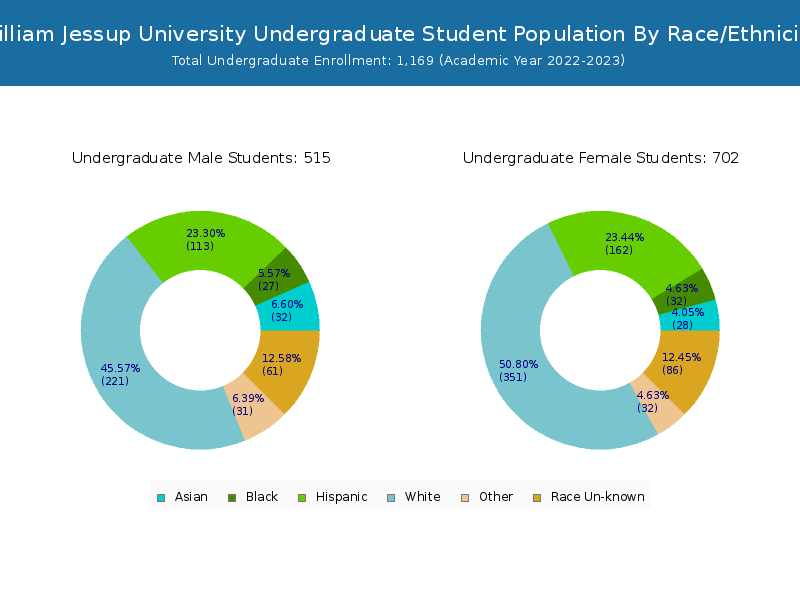
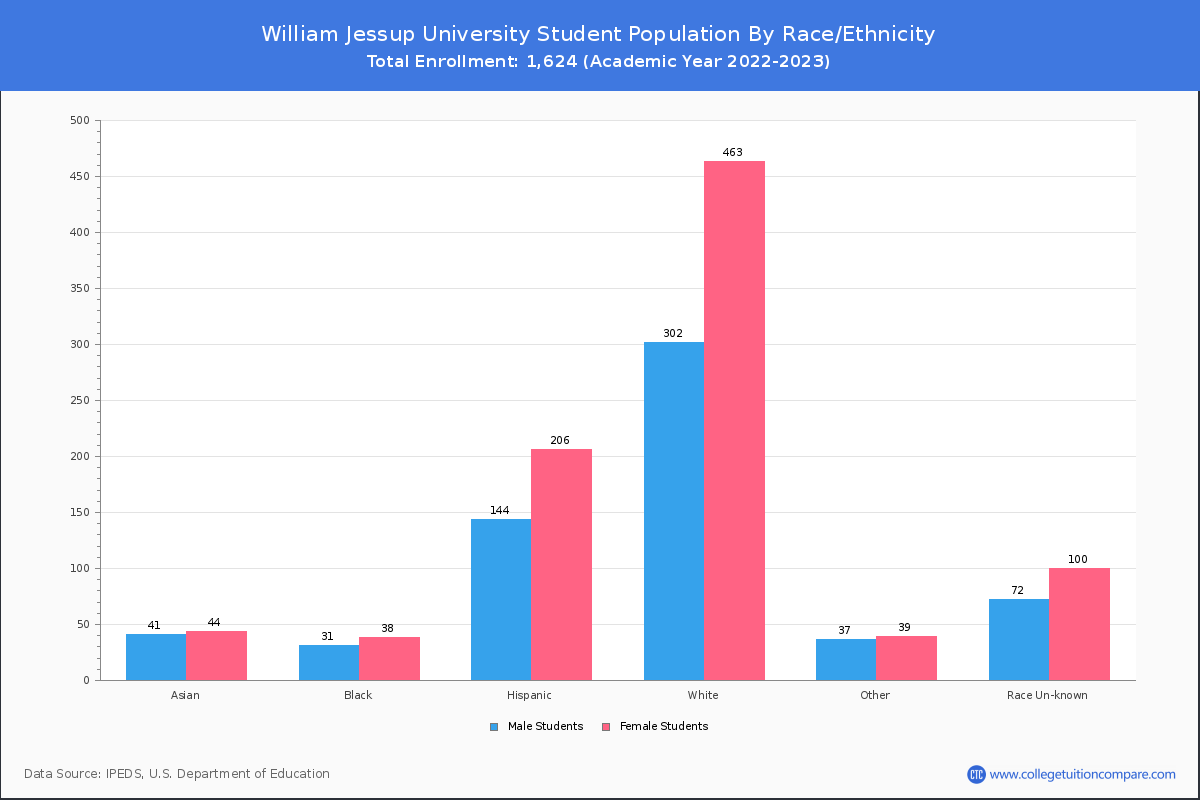
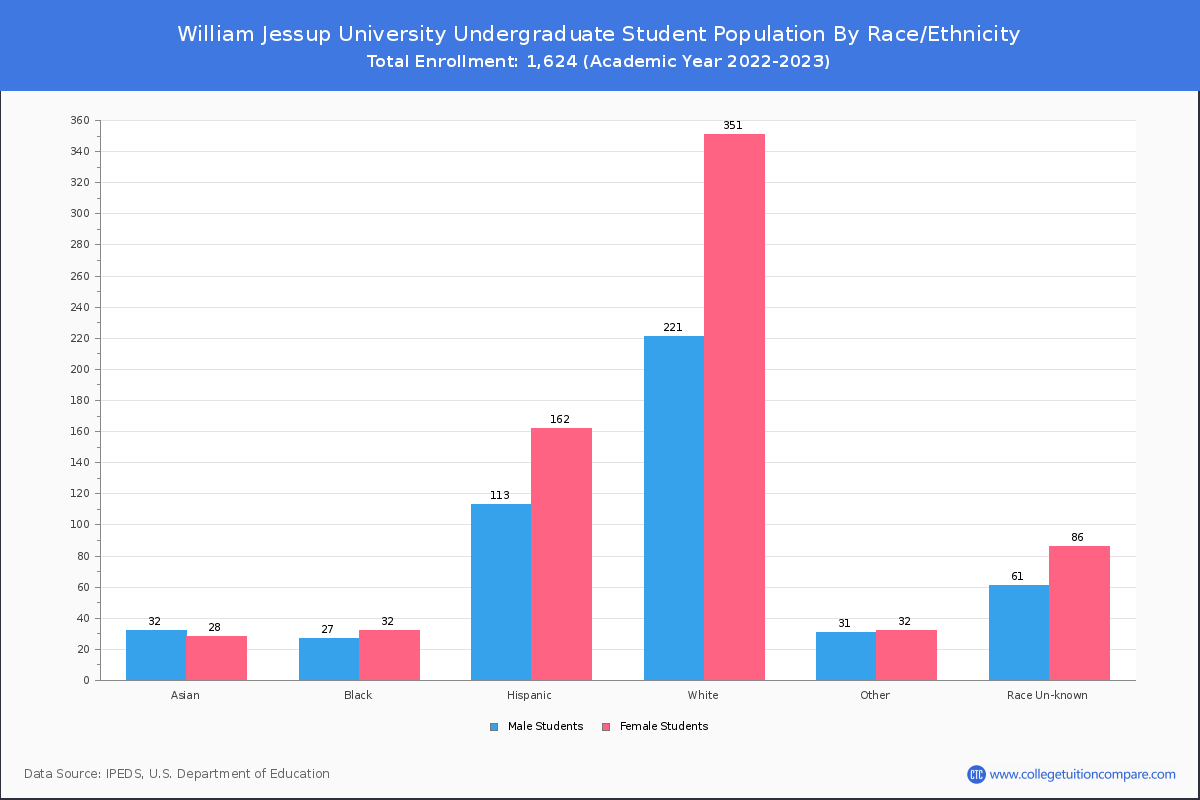
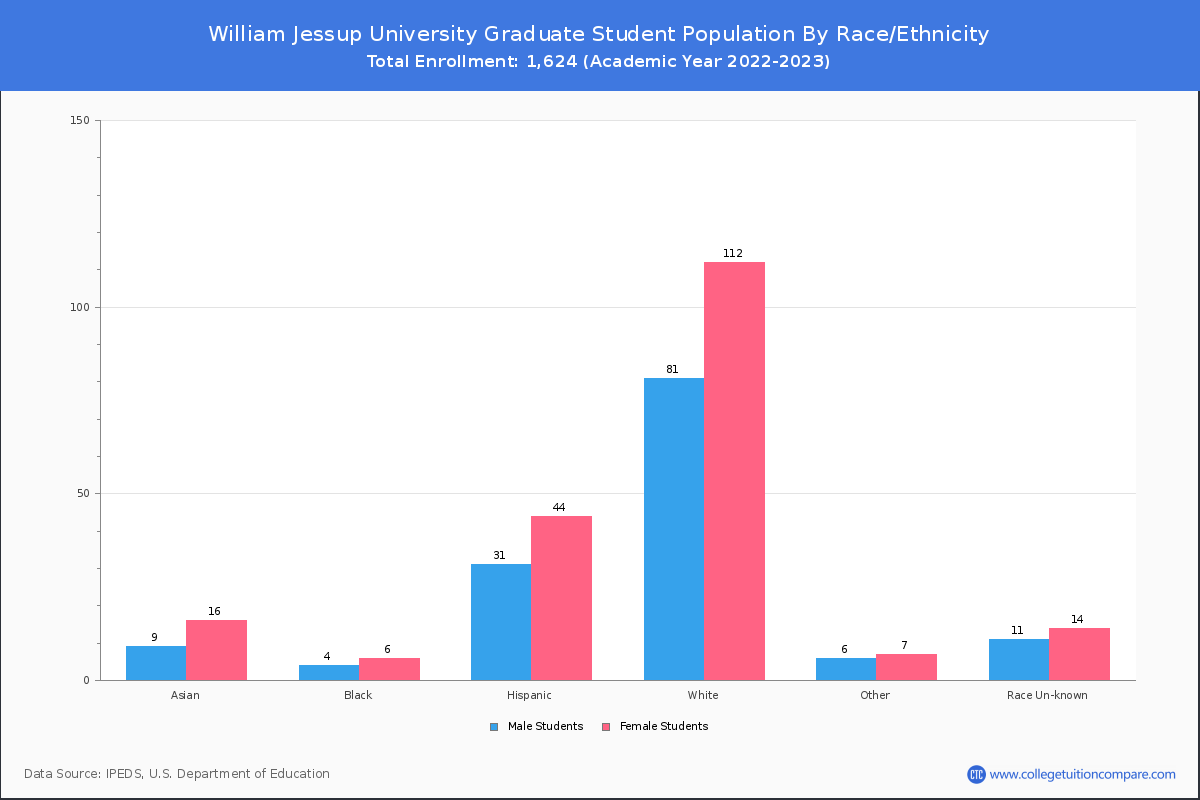
Student Distribution by Race/Ethnicity
By race/ethnicity, 714 White, 113 Black, and 59 Asian students out of a total of 1,624 are attending at William Jessup University. Comprehensive enrollment statistic data by race/ethnicity is shown in the next chart (Academic year 2022-2023 data).
| Race | Total | Men | Women |
|---|---|---|---|
| American Indian or Native American | 13 | 4 | 9 |
| Asian | 59 | 31 | 28 |
| Black | 113 | 44 | 69 |
| Hispanic | 355 | 150 | 205 |
| Native Hawaiian or Other Pacific Islanders | 19 | 9 | 10 |
| White | 714 | 270 | 444 |
| Two or more races | 69 | 32 | 37 |
| Race Unknown | 97 | 33 | 64 |
| Race | Total | Men | Women |
|---|---|---|---|
| American Indian or Native American | 12 | 4 | 8 |
| Asian | 41 | 22 | 19 |
| Black | 97 | 39 | 58 |
| Hispanic | 284 | 116 | 168 |
| Native Hawaiian or Other Pacific Islanders | 18 | 8 | 10 |
| White | 539 | 208 | 331 |
| Two or more races | 60 | 31 | 29 |
| Race Unknown | 83 | 32 | 51 |
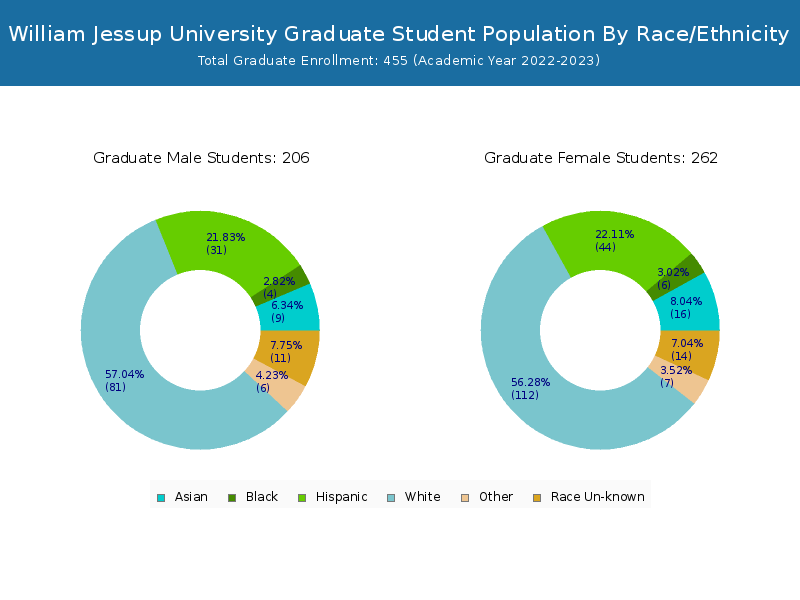
| Race | Total | Men | Women |
|---|---|---|---|
| American Indian or Native American | 1 | 1 | 0 |
| Asian | 6 | 3 | 3 |
| Black | 25 | 10 | 15 |
| Hispanic | 43 | 24 | 19 |
| Native Hawaiian or Other Pacific Islanders | 1 | 0 | 1 |
| White | 79 | 38 | 41 |
| Two or more races | 12 | 5 | 7 |
| Race Unknown | 14 | 7 | 7 |
Student Age Distribution
By age, William Jessup has 48 students under 18 years old and 9 students over 65 years old. There are 985 students under 25 years old, and 639 students over 25 years old out of 1,624 total students.
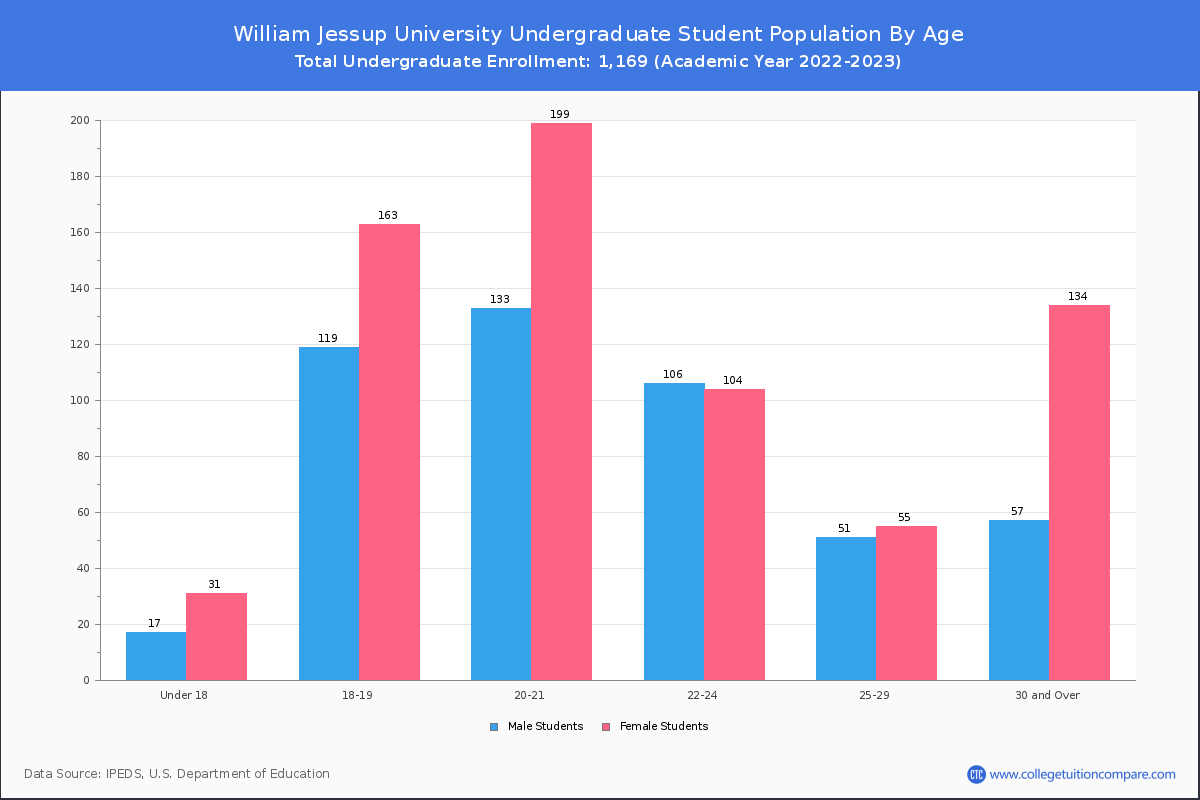
In undergraduate programs, 48 students are younger than 18 and 6 students are older than 65. William Jessup has 872 undergraduate students aged under 25 and 297 students aged 25 and over.
It has 113 graduate students aged under 25 and 342 students aged 25 and over.
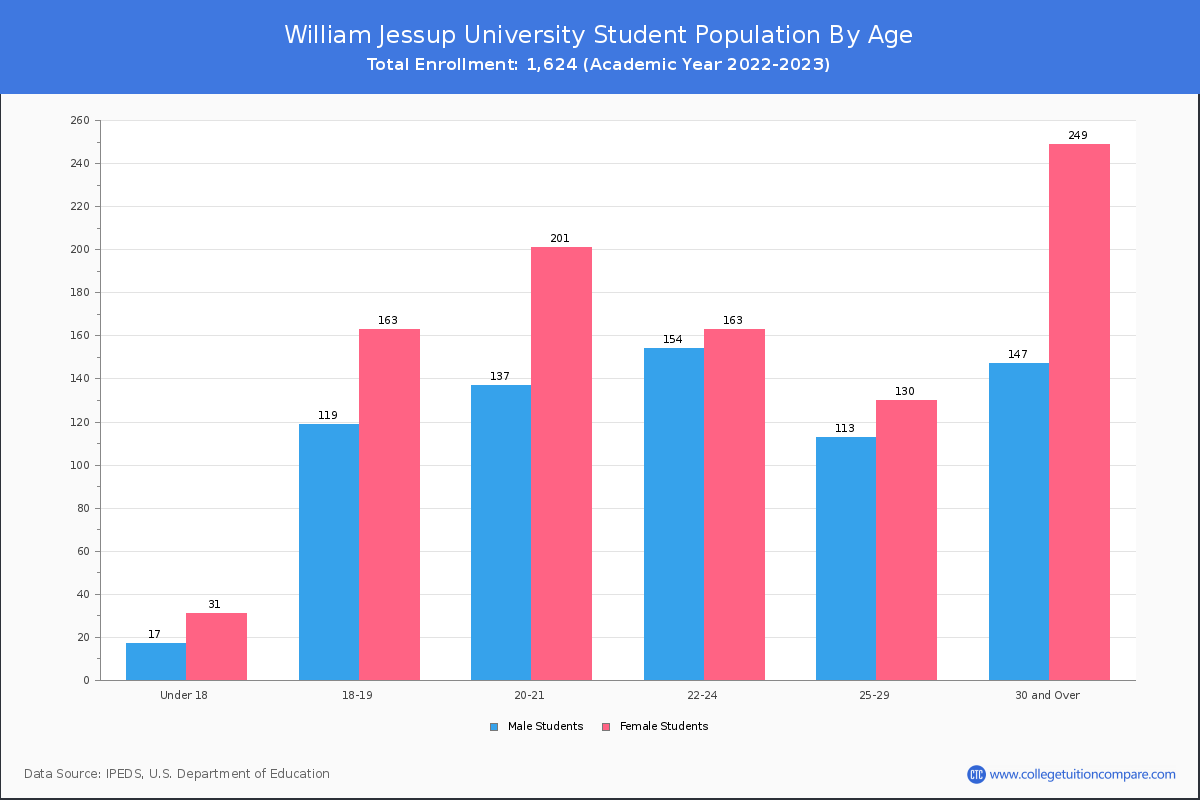
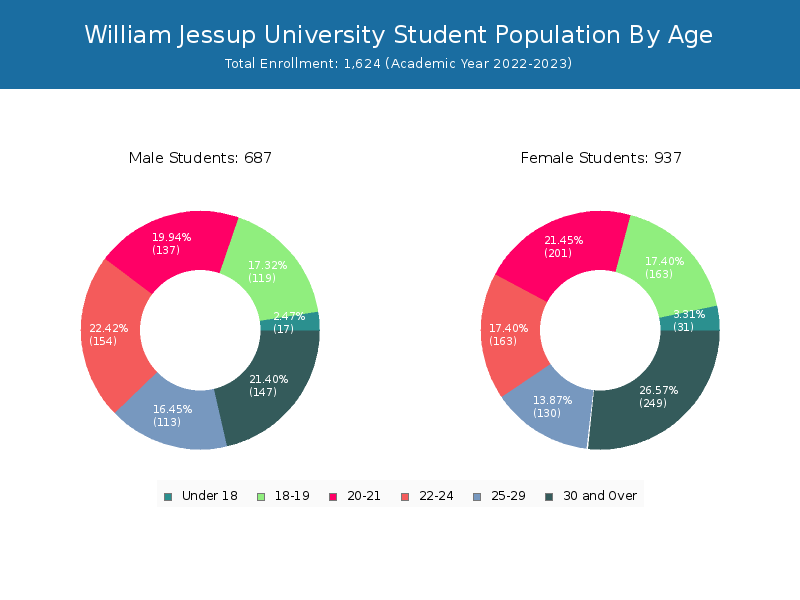
| Age | Total | Men | Women |
|---|---|---|---|
| Under 18 | 48 | 31 | 17 |
| 18-19 | 282 | 163 | 119 |
| 20-21 | 338 | 201 | 137 |
| 22-24 | 317 | 163 | 154 |
| 25-29 | 243 | 130 | 113 |
| 30-34 | 119 | 64 | 55 |
| 35-39 | 80 | 53 | 27 |
| 40-49 | 126 | 84 | 42 |
| 50-64 | 62 | 43 | 19 |
| Over 65 | 9 | 5 | 4 |
| Age | Total | Men | Women |
|---|---|---|---|
| Under 18 | 48 | 31 | 17 |
| 18-19 | 282 | 163 | 119 |
| 20-21 | 332 | 199 | 133 |
| 22-24 | 210 | 104 | 106 |
| 25-29 | 106 | 55 | 51 |
| 30-34 | 57 | 34 | 23 |
| 35-39 | 47 | 34 | 13 |
| 40-49 | 59 | 45 | 14 |
| 50-64 | 22 | 17 | 5 |
| Over 65 | 6 | 4 | 2 |
| Age | Total | Men | Women |
|---|
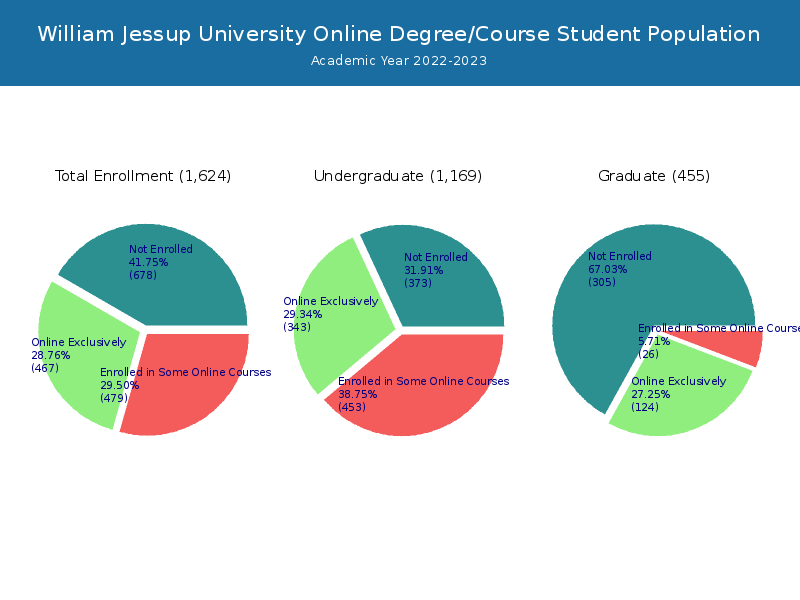
Online Student Enrollment
Distance learning, also called online education, is very attractive to students, especially who want to continue education and work in field. At William Jessup University, 467 students are enrolled exclusively in online courses and 479 students are enrolled in some online courses.
287 students lived in California or jurisdiction in which the school is located are enrolled exclusively in online courses and 180 students live in other State or outside of the United States.
| All Students | Enrolled Exclusively Online Courses | Enrolled in Some Online Courses | |
|---|---|---|---|
| All Students | 1,624 | 467 | 479 |
| Undergraduate | 1,169 | 343 | 453 |
| Graduate | 455 | 124 | 26 |
| California Residents | Other States in U.S. | Outside of U.S. | |
|---|---|---|---|
| All Students | 287 | 172 | 8 |
| Undergraduate | 183 | 153 | 7 |
| Graduate | 104 | 19 | 1 |
Transfer-in Students (Undergraduate)
Among 1,169 enrolled in undergraduate programs, 189 students have transferred-in from other institutions. The percentage of transfer-in students is 16.17%.158 students have transferred in as full-time status and 31 students transferred in as part-time status.
| Number of Students | |
|---|---|
| Regular Full-time | 742 |
| Transfer-in Full-time | 158 |
| Regular Part-time | 238 |
| Transfer-in Part-time | 31 |