Graduation Rates in Reasonable Completion Time
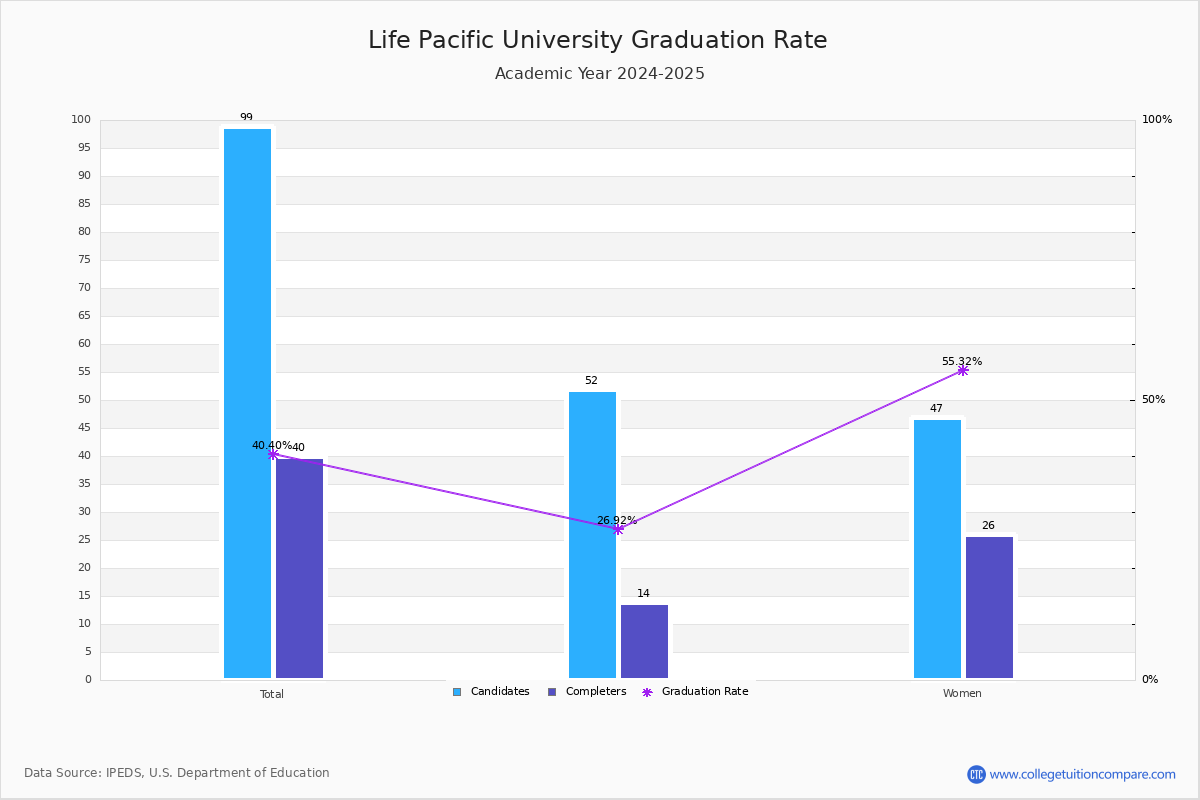
For the academic year 2022-2023, 28 students out of 60 candidates have completed their courses within 150% normal time (i.e. in 6 years for 4-year BS degree) at Life Pacific University.
By gender, 10 male and 18 female students graduated the school last year completing their jobs in the period. Its graduation rate is around the average rate when comparing similar colleges' rate of 43.44% (private (not-for-profit) Baccalaureate College - Diverse Fields).
| Candidates | Completers | Graduation Rates | |
|---|---|---|---|
| Total | 60 | 28 | 46.67% |
| Men | 22 | 10 | 45.45% |
| Women | 38 | 18 | 47.37% |
Graduation Rate By Race/Ethnicity
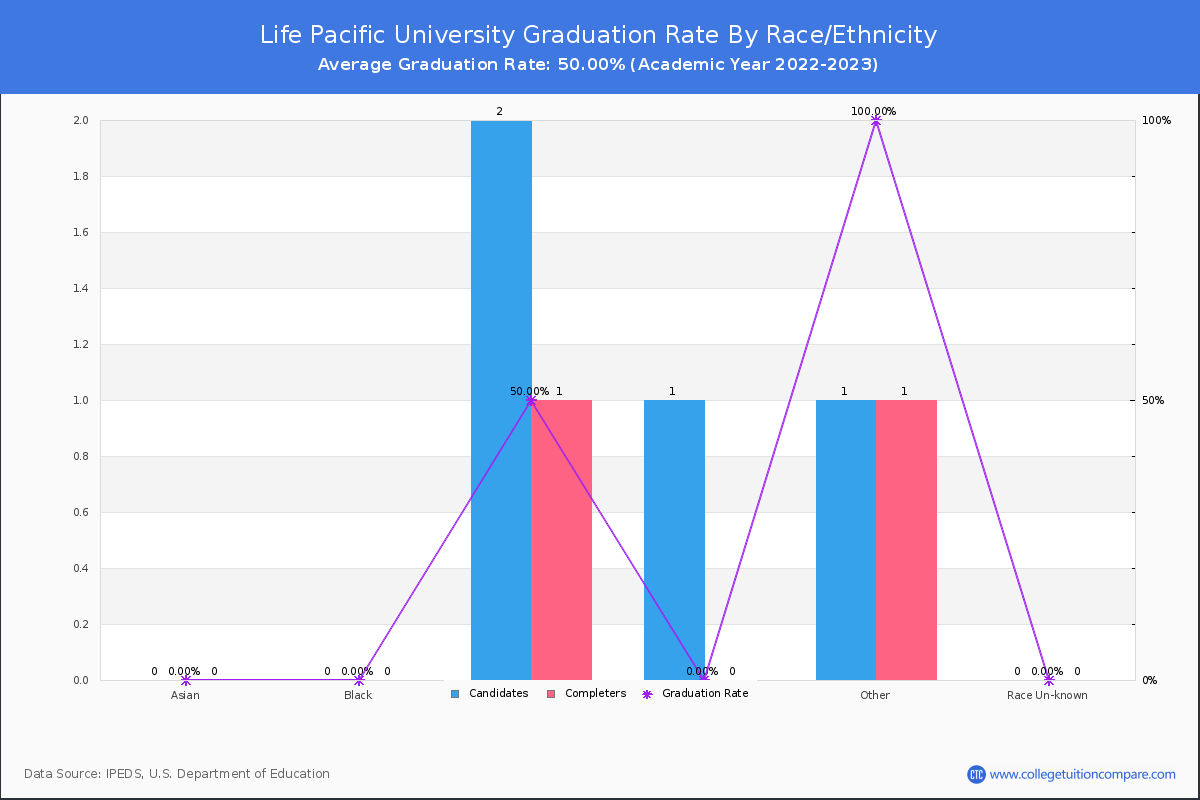
The following table shows graduation rate by race and at Life Pacific University.
- Asian: 100.00%
- Black (Non-Hispanic): 50.00%
- Hispanic: 48.28%
- White: 41.18%
- Two or More Race: 33.33%
- Unknown: 60.00%
| Total | Male | Female | |
|---|---|---|---|
| Asian | 100.00%(1/1) | - | 100.00%(1/1) |
| Black (Non-Hispanic) | 50.00%(2/4) | 33.33%(1/3) | 100.00%(1/1) |
| Hispanic | 48.28%(14/29) | 37.50%(3/8) | 52.38%(11/21) |
| White | 41.18%(7/17) | 57.14%(4/7) | 30.00%(3/10) |
| Two or More Race | 33.33%(1/3) | - | 50.00%(1/2) |
| Unknown | 60.00%(3/5) | 66.67%(2/3) | 50.00%(1/2) |
Transfer-out and Retention Rates
At LPU, the transfer-out rate is 33.33%. Its transfer-out rate is relatively higher than the average rate when comparing similar colleges' rate of 28.16%.
LPU's retention rate is 69% for full-time students and 75 % for part-time students last year. Its retention rate is around the average rate when comparing similar colleges' rate of 66.31%.