Student Population by Gender
Hendrix College has a total of 1,144 enrolled students for the academic year 2022-2023. 1,132 students have enrolled in undergraduate programs and 12 students joined graduate programs.
By gender, 568 male and 576 female students (the male-female ratio is 50:50) are attending the school. The gender distribution is based on the 2022-2023 data.
| Total | Undergraduate | Graduate | |
|---|---|---|---|
| Total | 1,144 | 1,132 | 12 |
| Men | 568 | 558 | 10 |
| Women | 576 | 574 | 2 |
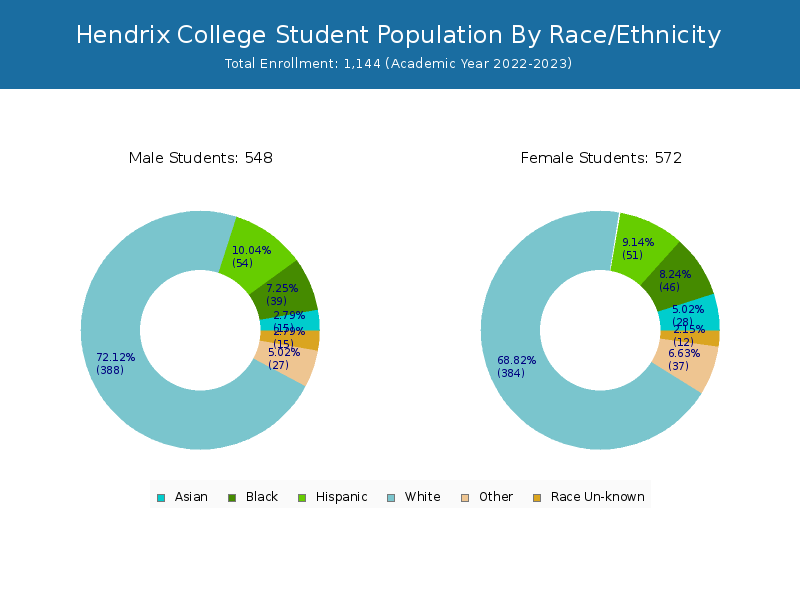
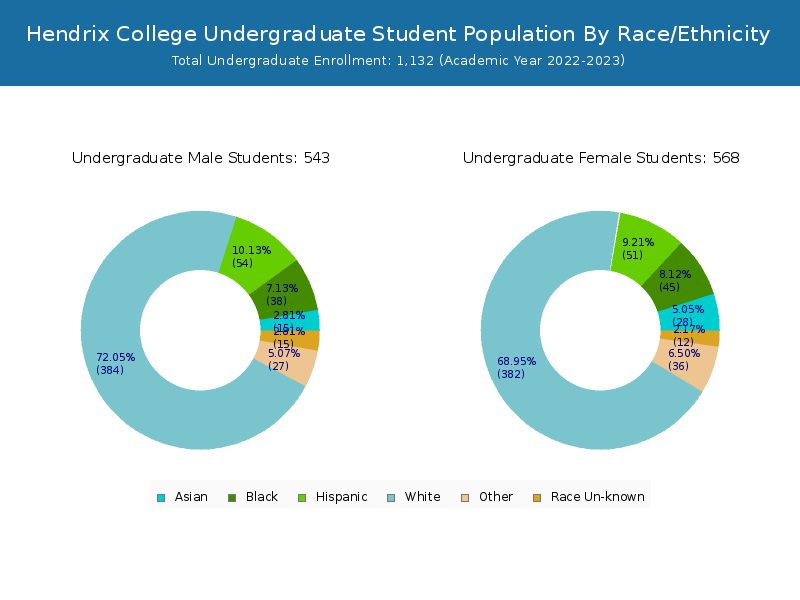
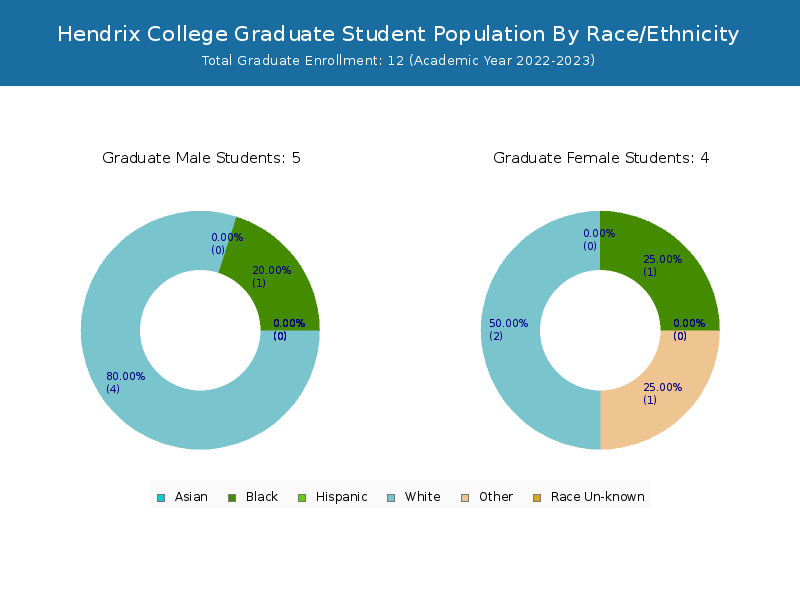
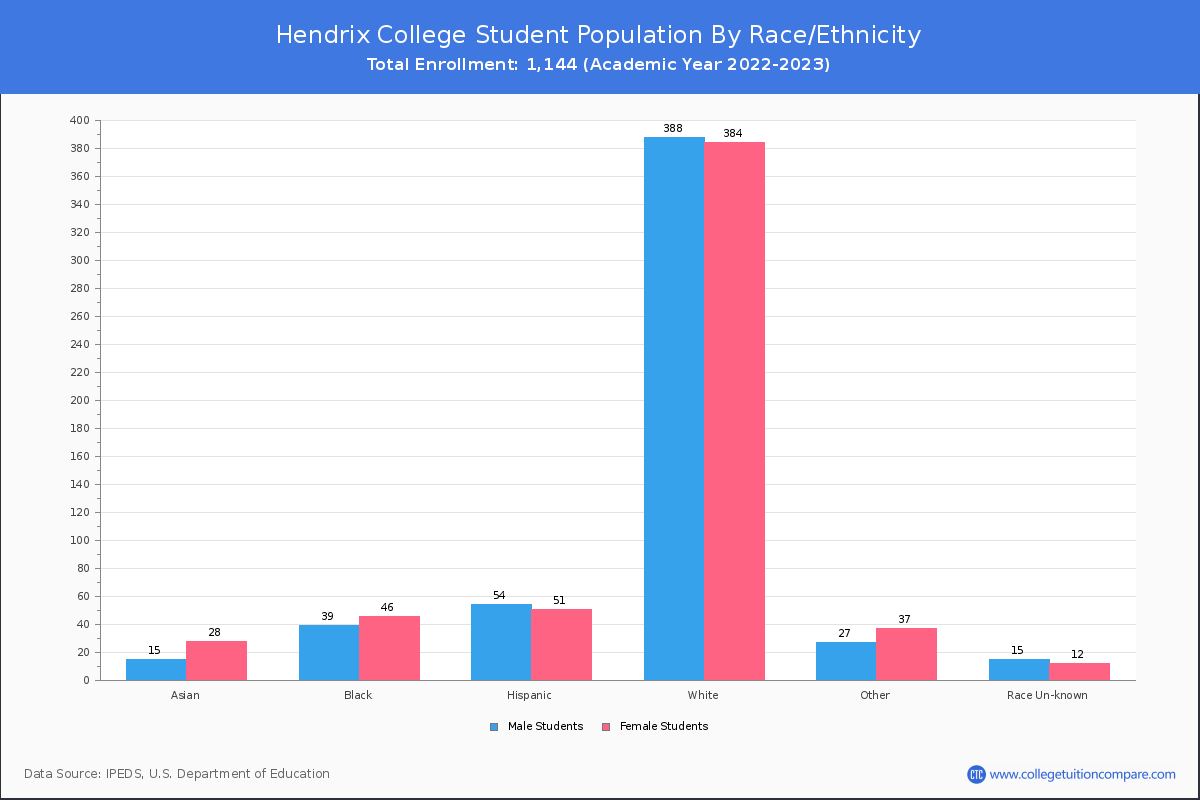
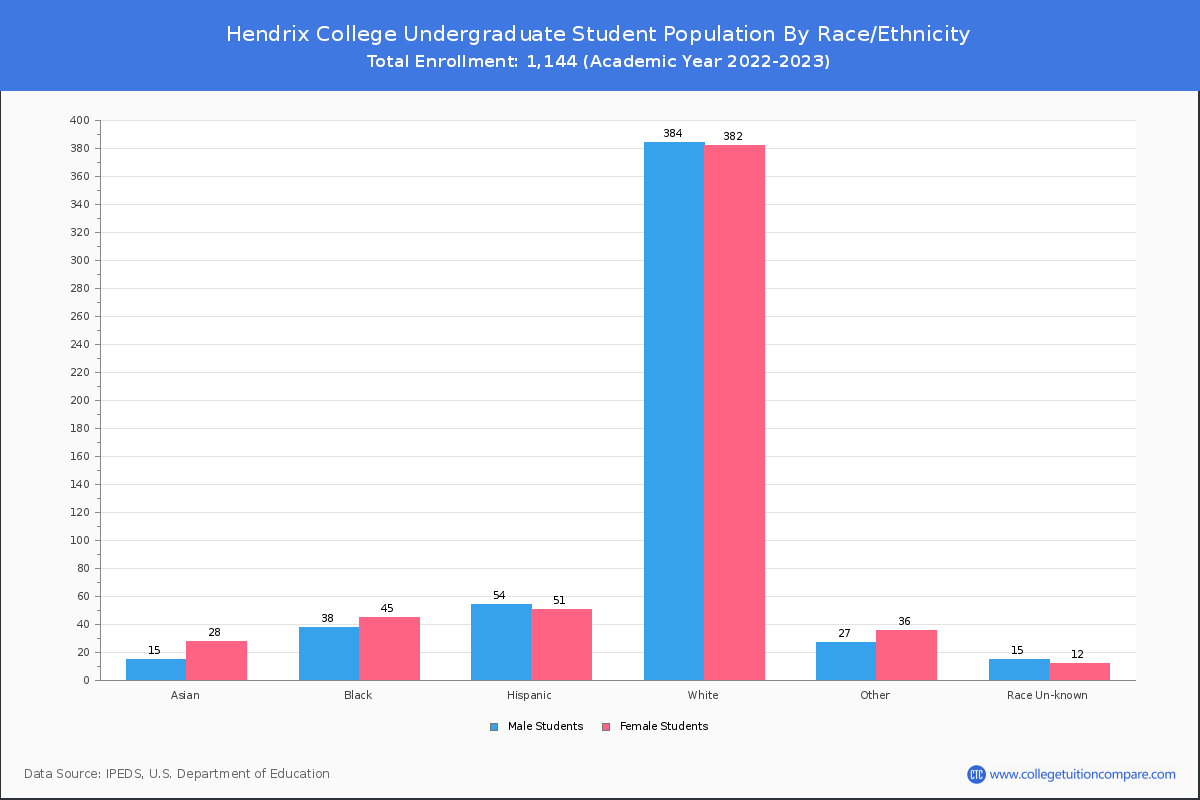
Student Distribution by Race/Ethnicity
By race/ethnicity, 789 White, 85 Black, and 36 Asian students out of a total of 1,144 are attending at Hendrix College. Comprehensive enrollment statistic data by race/ethnicity is shown in the next chart (Academic year 2022-2023 data).
| Race | Total | Men | Women |
|---|---|---|---|
| American Indian or Native American | 9 | 7 | 2 |
| Asian | 36 | 16 | 20 |
| Black | 85 | 37 | 48 |
| Hispanic | 104 | 57 | 47 |
| Native Hawaiian or Other Pacific Islanders | 1 | 1 | 0 |
| White | 789 | 392 | 397 |
| Two or more races | 57 | 27 | 30 |
| Race Unknown | 31 | 19 | 12 |
| Race | Total | Men | Women |
|---|---|---|---|
| American Indian or Native American | 9 | 7 | 2 |
| Asian | 36 | 16 | 20 |
| Black | 85 | 37 | 48 |
| Hispanic | 103 | 56 | 47 |
| Native Hawaiian or Other Pacific Islanders | 1 | 1 | 0 |
| White | 778 | 383 | 395 |
| Two or more races | 57 | 27 | 30 |
| Race Unknown | 31 | 19 | 12 |
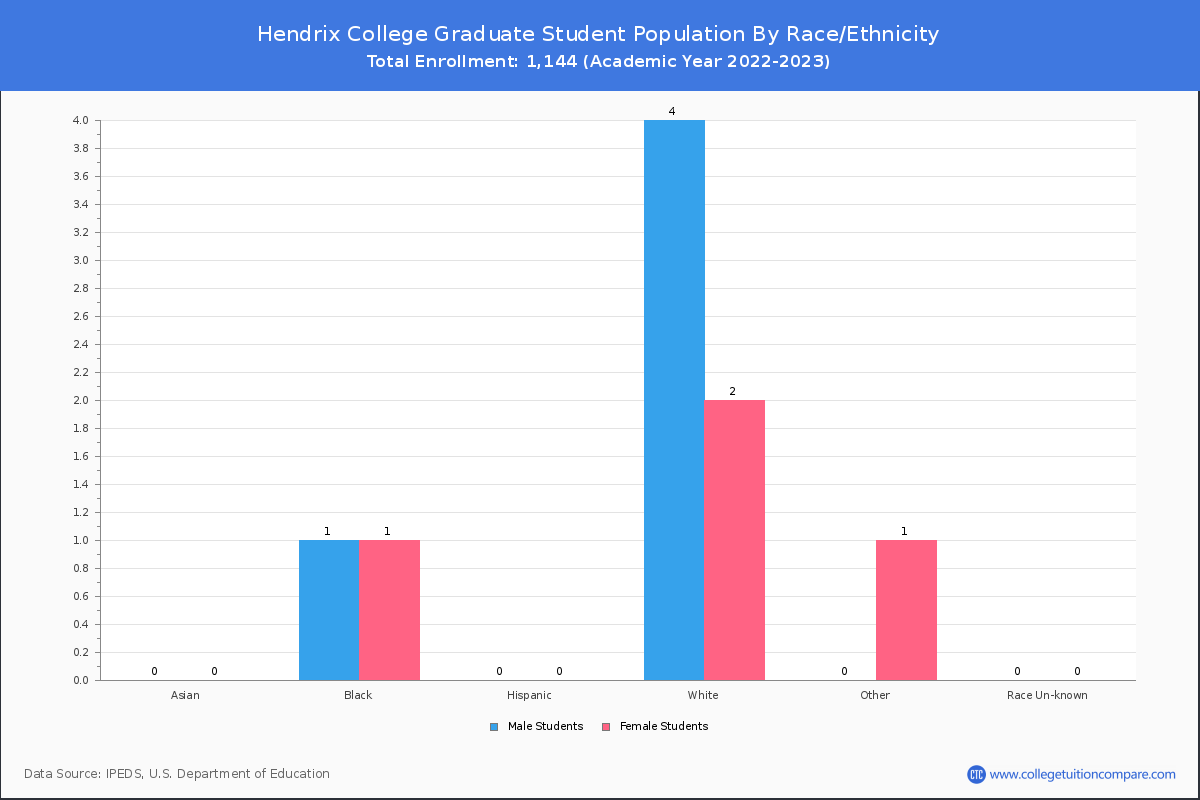
| Race | Total | Men | Women |
|---|---|---|---|
| American Indian or Native American | 0 | 0 | 0 |
| Asian | 0 | 0 | 0 |
| Black | 1 | 0 | 1 |
| Hispanic | 3 | 1 | 2 |
| Native Hawaiian or Other Pacific Islanders | 0 | 0 | 0 |
| White | 6 | 4 | 2 |
| Two or more races | 1 | 0 | 1 |
| Race Unknown | 0 | 0 | 0 |
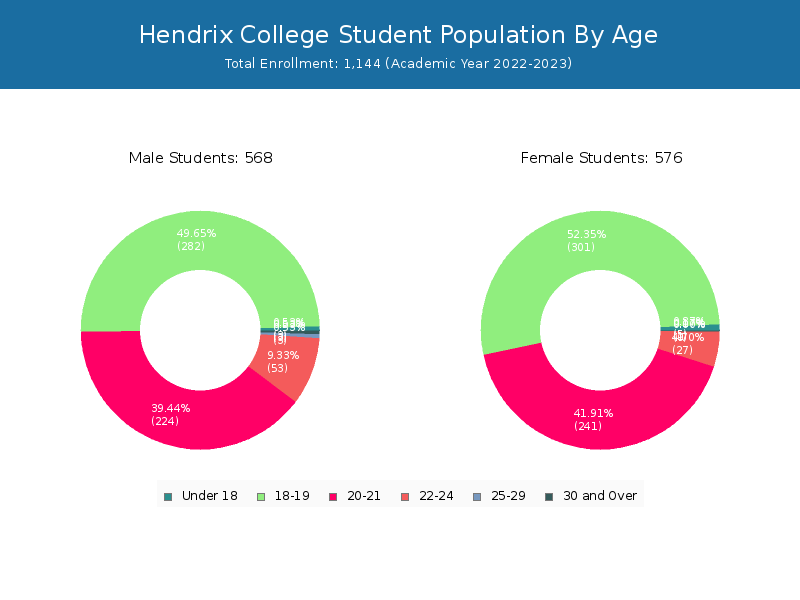
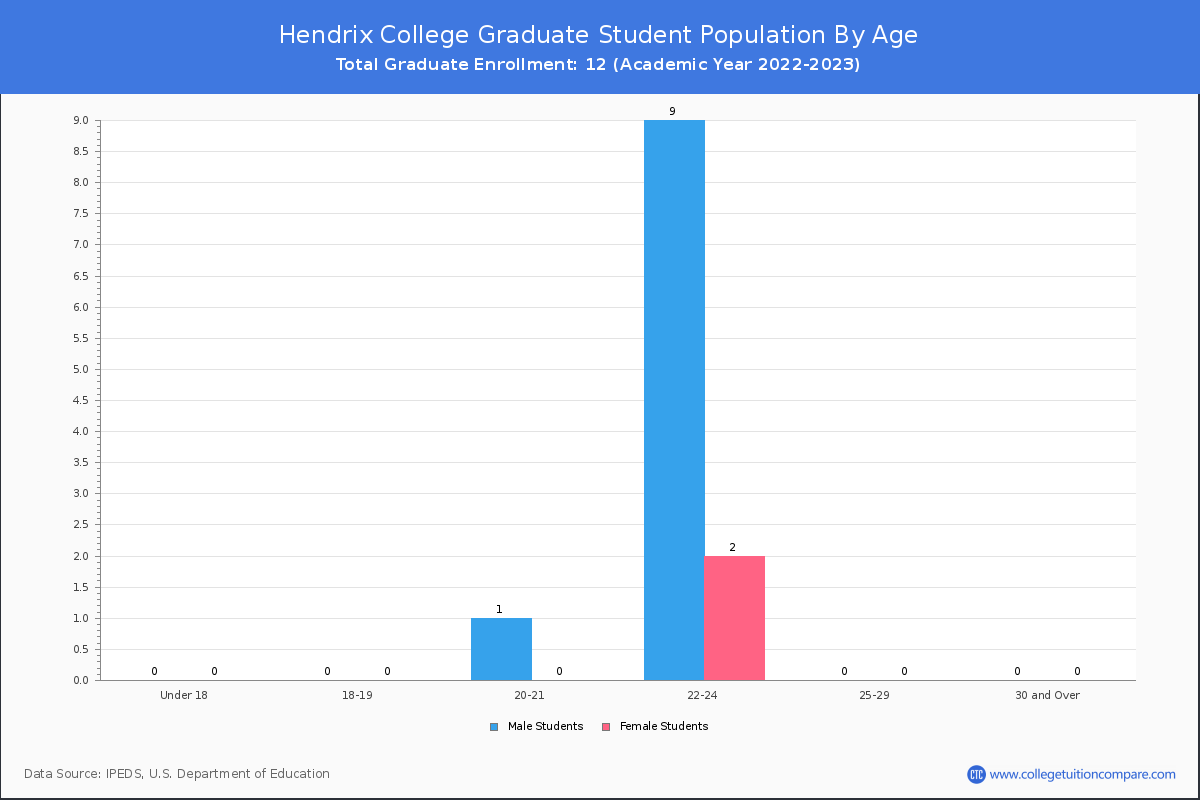
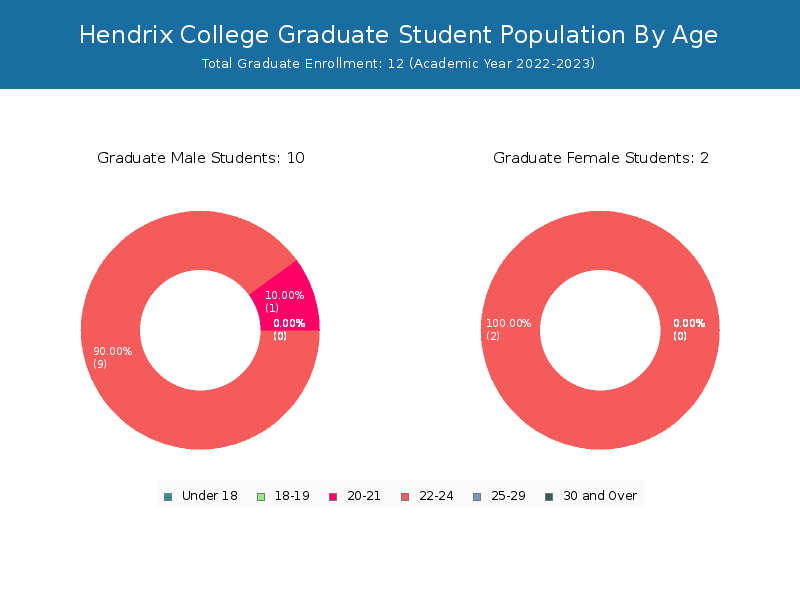
Student Age Distribution
There are 1,136 students under 25 years old, and 7 students over 25 years old out of 1,144 total students.
Hendrix has 1,124 undergraduate students aged under 25 and 7 students aged 25 and over.
All graduate students at Hendrix is aged under 25.
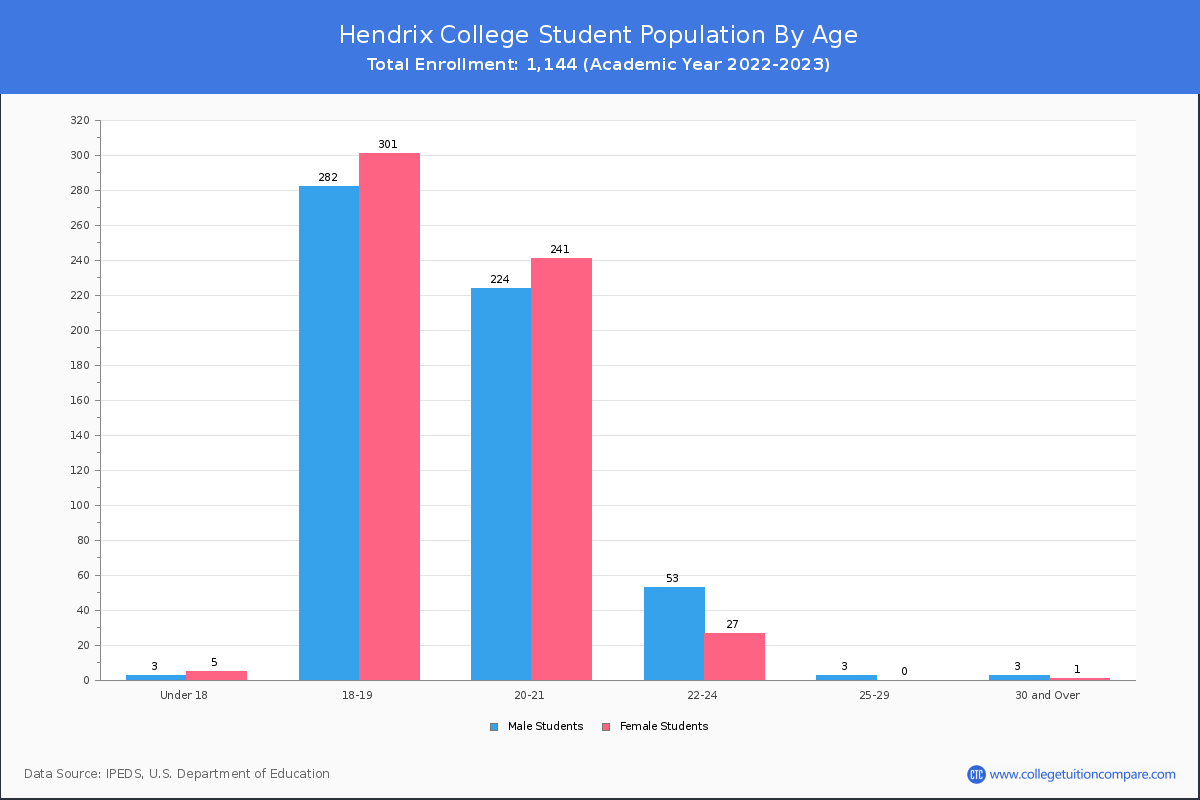
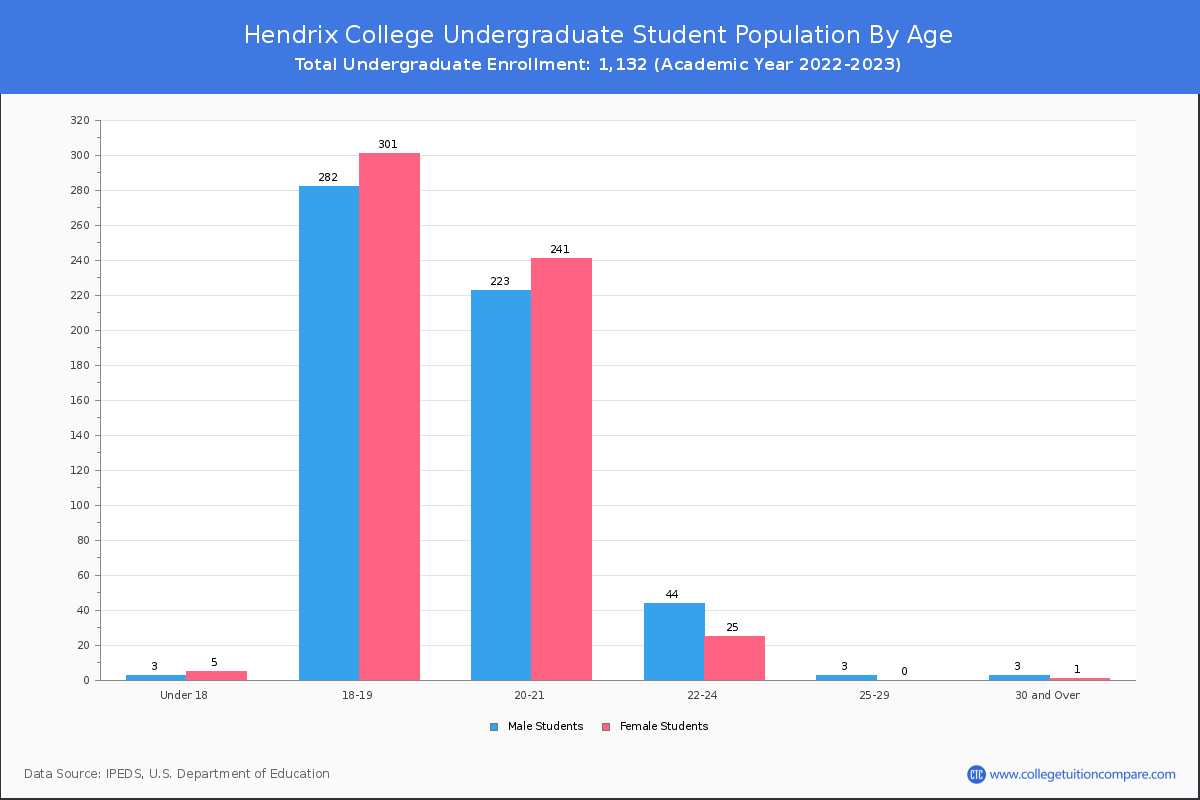
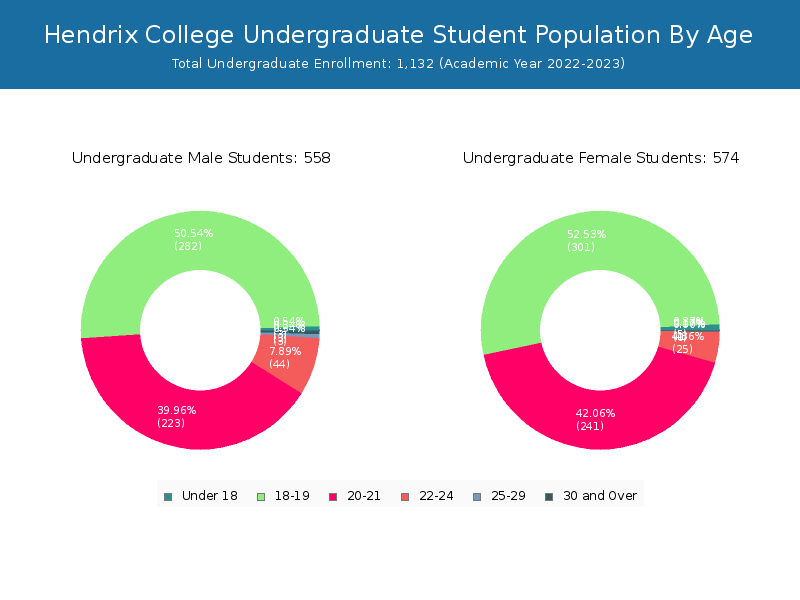
| Age | Total | Men | Women |
|---|---|---|---|
| Under 18 | 8 | 5 | 3 |
| 18-19 | 583 | 301 | 282 |
| 20-21 | 465 | 241 | 224 |
| 22-24 | 80 | 27 | 53 |
| 25-29 | 3 | 0 | 3 |
| Age | Total | Men | Women |
|---|---|---|---|
| Under 18 | 8 | 5 | 3 |
| 18-19 | 583 | 301 | 282 |
| 20-21 | 464 | 241 | 223 |
| 22-24 | 69 | 25 | 44 |
| 25-29 | 3 | 0 | 3 |
| Age | Total | Men | Women |
|---|
Transfer-in Students (Undergraduate)
Among 1,132 enrolled in undergraduate programs, 12 students have transferred-in from other institutions. The percentage of transfer-in students is 1.06%.11 students have transferred in as full-time status and 1 students transferred in as part-time status.
| Number of Students | |
|---|---|
| Regular Full-time | 1,108 |
| Transfer-in Full-time | 11 |
| Regular Part-time | 12 |
| Transfer-in Part-time | 1 |