Graduation Rates in Reasonable Completion Time
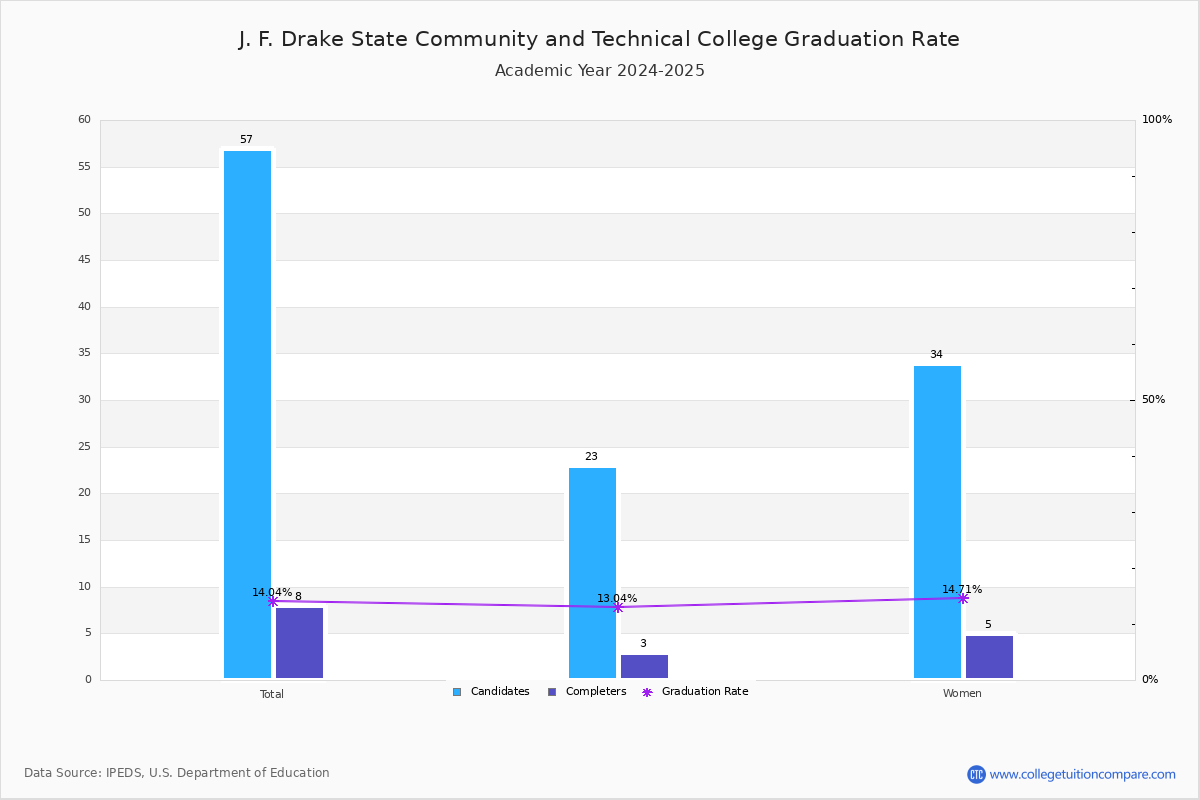
For the academic year 2022-2023, 9 students out of 74 candidates have completed their courses within 150% normal time (i.e. in 3 years for 2-year Associate degree) at J. F. Drake State Community and Technical College.
By gender, 3 male and 6 female students graduated the school last year completing their jobs in the period. Its graduation rate is much lower than the average rate when comparing similar colleges' rate of 34.56% (public special-use Associate's college).
| Candidates | Completers | Graduation Rates | |
|---|---|---|---|
| Total | 74 | 9 | 12.16% |
| Men | 37 | 3 | 8.11% |
| Women | 37 | 6 | 16.22% |
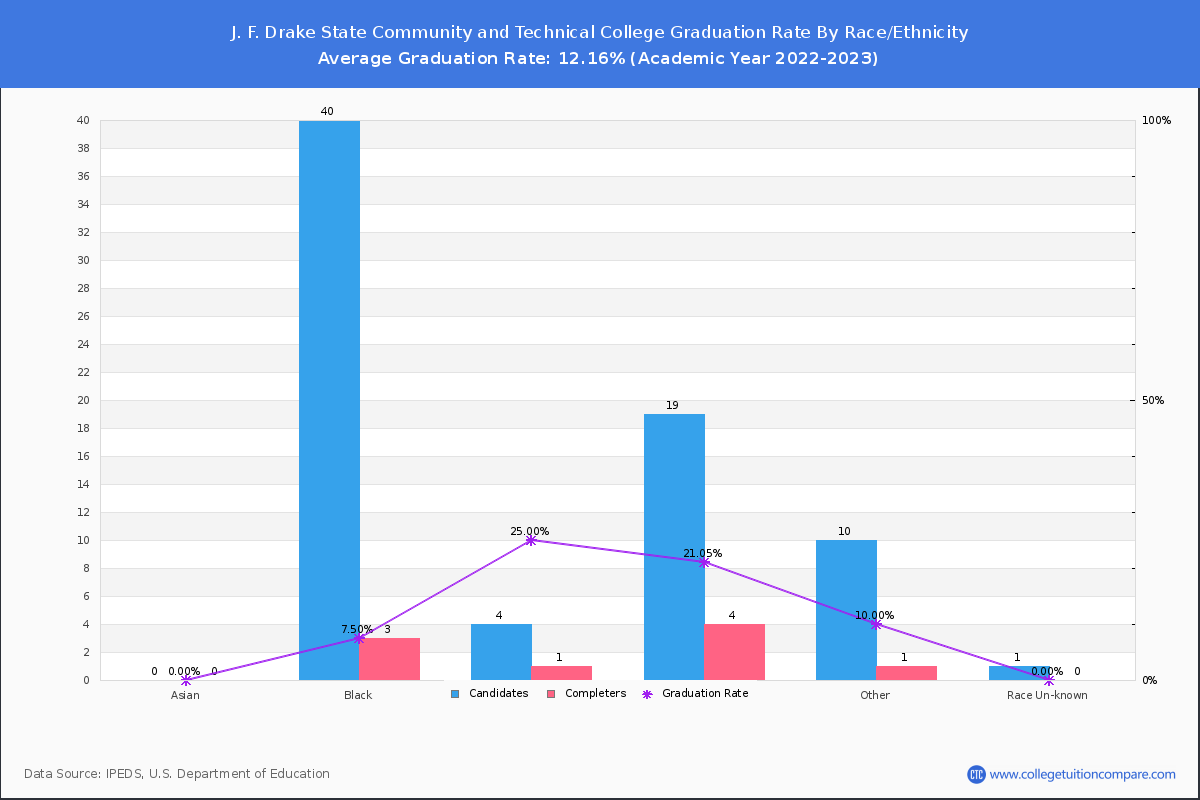
Graduation Rate By Race/Ethnicity
The following table shows graduation rate by race and at J. F. Drake State Community and Technical College.
- American Indian or Alaska Native: 0.00%
- Black (Non-Hispanic): 7.50%
- Hispanic: 25.00%
- White: 21.05%
- Two or More Race: 12.50%
- Unknown: 0.00%
| Total | Male | Female | |
|---|---|---|---|
| American Indian or Alaska Native | 0.00%(-/2) | - | - |
| Black (Non-Hispanic) | 7.50%(3/40) | 5.00%(1/20) | 10.00%(2/20) |
| Hispanic | 25.00%(1/4) | - | 33.33%(1/3) |
| White | 21.05%(4/19) | 8.33%(1/12) | 42.86%(3/7) |
| Two or More Race | 12.50%(1/8) | 50.00%(1/2) | - |
| Unknown | 0.00%(-/1) | - | - |
Transfer-out and Retention Rates
At Drake State, the transfer-out rate is 18.92%. Its transfer-out rate is much higher than the average rate when comparing similar colleges' rate of 12.73%.
Drake State's retention rate is 47% for full-time students and 23 % for part-time students last year. Its retention rate is relatively lower than the average rate when comparing similar colleges' rate of 59.91%.