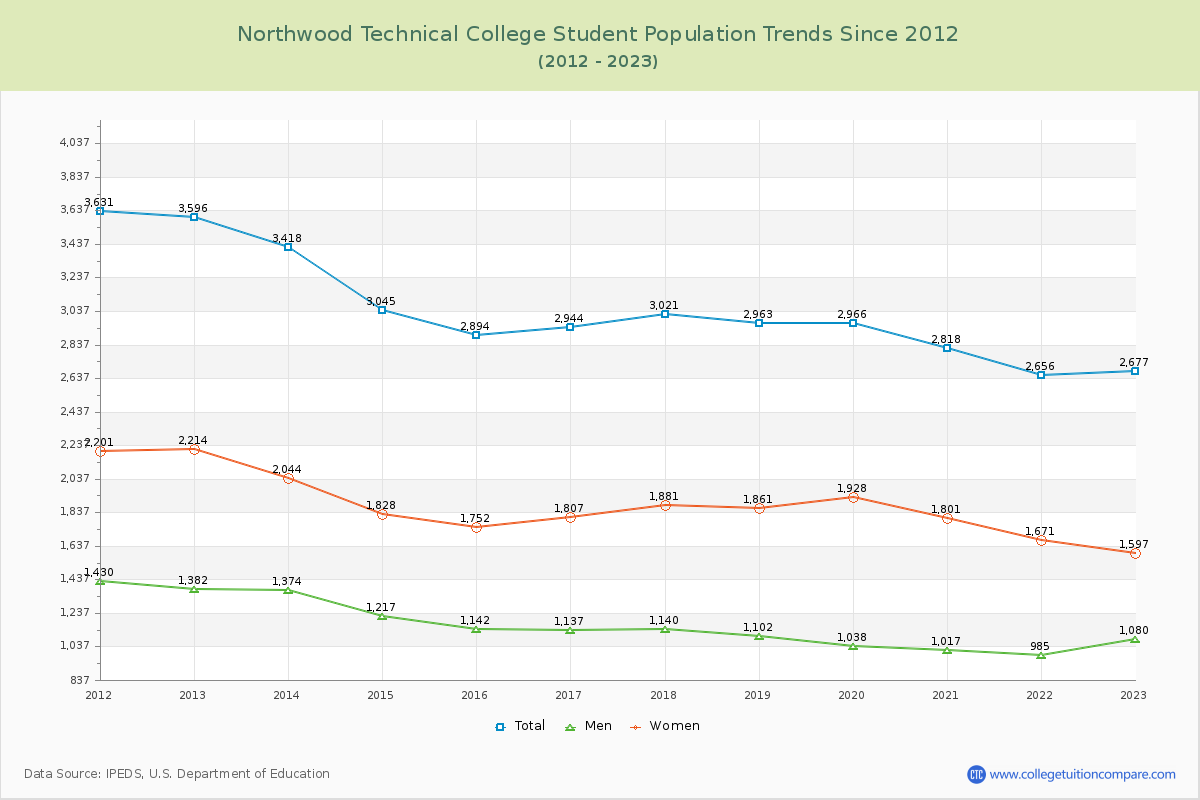
Student Population Changes
The average student population over the last 12 years is 3,000 where 2,677 students are attending the school for the academic year 2022-2023.
The female to male ratio is 1.48 to 1 and it means that there are more female students enrolled in WITC than male students.
The following table and chart illustrate the changes in student population by gender at Northwood Technical College since 2012.
| Year | Total | Men | Women |
|---|---|---|---|
| 2012-13 | 3,596 | 1,382 | 2,214 |
| 2013-14 | 3,418 -178 | 1,374 -8 | 2,044 -170 |
| 2014-15 | 3,045 -373 | 1,217 -157 | 1,828 -216 |
| 2015-16 | 2,894 -151 | 1,142 -75 | 1,752 -76 |
| 2016-17 | 2,944 50 | 1,137 -5 | 1,807 55 |
| 2017-18 | 3,021 77 | 1,140 3 | 1,881 74 |
| 2018-19 | 2,963 -58 | 1,102 -38 | 1,861 -20 |
| 2019-20 | 2,966 3 | 1,038 -64 | 1,928 67 |
| 2020-21 | 2,818 -148 | 1,017 -21 | 1,801 -127 |
| 2021-22 | 2,656 -162 | 985 -32 | 1,671 -130 |
| 2022-23 | 2,677 21 | 1,080 95 | 1,597 -74 |
| Average | 3,000 | 1,147 | 1,853 |