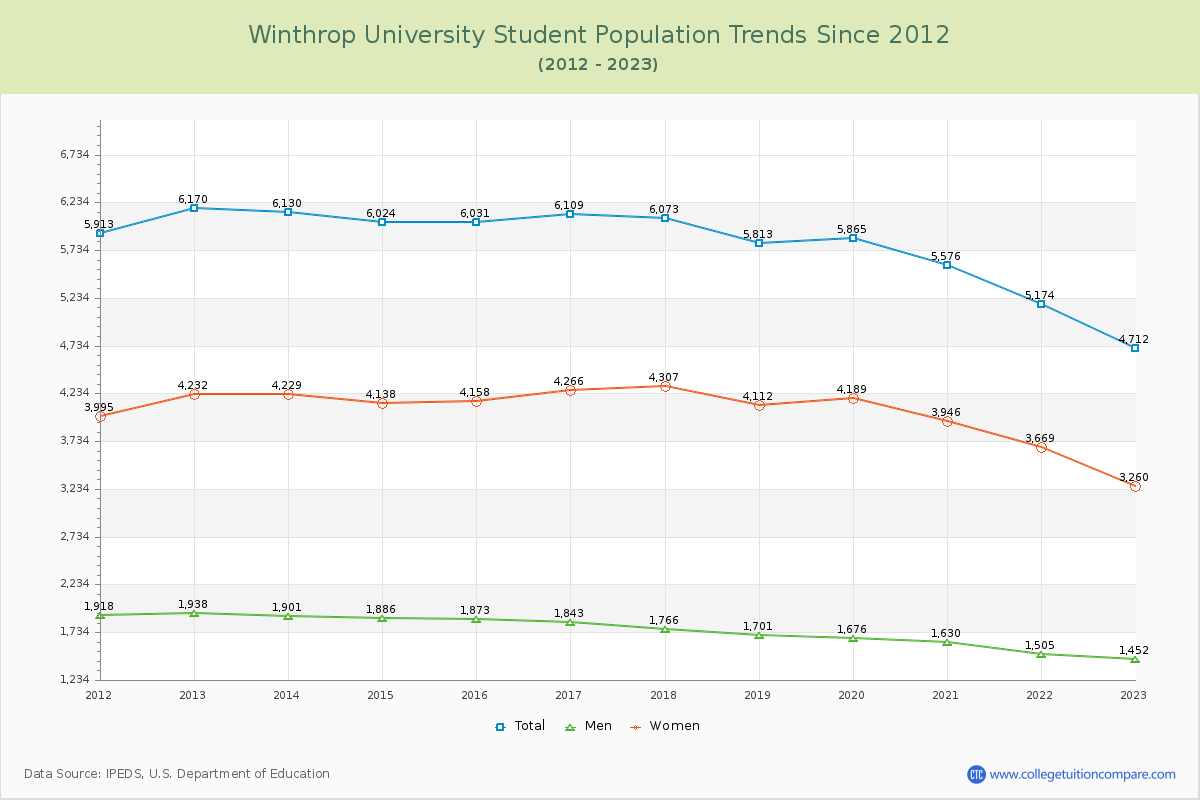
Student Population Changes
The average student population over the last 12 years is 5,789 where 4,712 students are attending the school for the academic year 2022-2023.
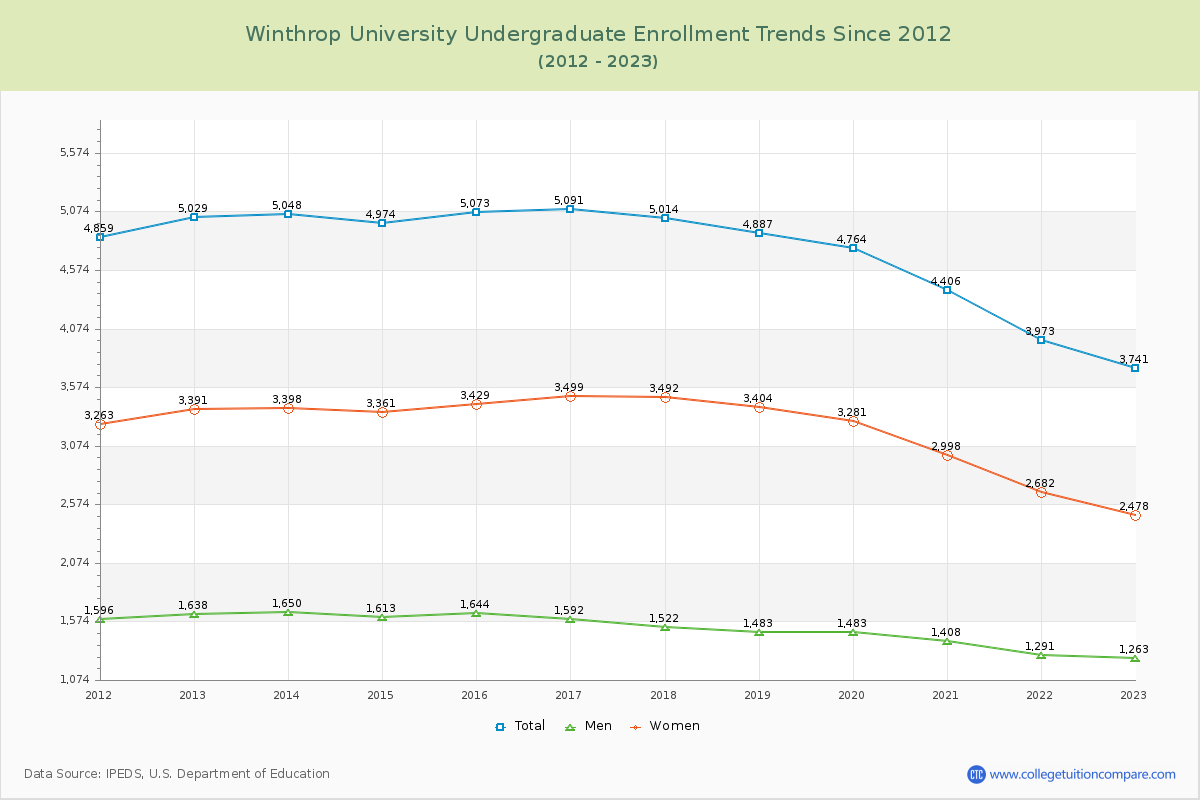
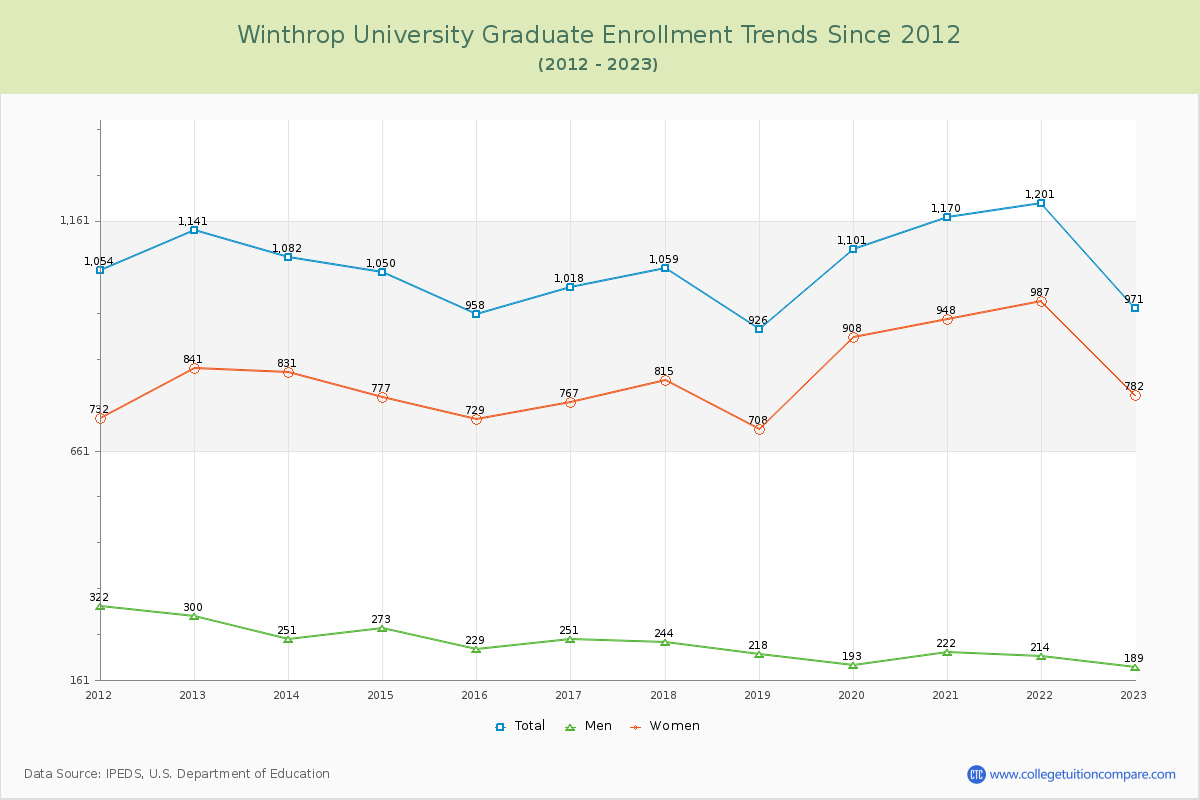
79.39% of total students is undergraduate students and 20.61% students is graduate students. The number of undergraduate students has decreased by 1,288 and the graduate enrollment has decreased by 170 over past 10 years.
The female to male ratio is 2.25 to 1 and it means that there are far more female students enrolled in Winthrop than male students.
The following table and chart illustrate the changes in student population by gender at Winthrop University since 2012.
| Year | Total | Undergraduate | Graduate | ||||
|---|---|---|---|---|---|---|---|
| Total | Men | Women | Total | Men | Women | ||
| 2012-13 | 6,170 | 5,029 | 1,638 | 3,391 | 1,141 | 300 | 841 |
| 2013-14 | 6,130 -40 | 5,048 19 | 1,650 12 | 3,398 7 | 1,082 -59 | 251 -49 | 831 -10 |
| 2014-15 | 6,024 -106 | 4,974 -74 | 1,613 -37 | 3,361 -37 | 1,050 -32 | 273 22 | 777 -54 |
| 2015-16 | 6,031 7 | 5,073 99 | 1,644 31 | 3,429 68 | 958 -92 | 229 -44 | 729 -48 |
| 2016-17 | 6,109 78 | 5,091 18 | 1,592 -52 | 3,499 70 | 1,018 60 | 251 22 | 767 38 |
| 2017-18 | 6,073 -36 | 5,014 -77 | 1,522 -70 | 3,492 -7 | 1,059 41 | 244 -7 | 815 48 |
| 2018-19 | 5,813 -260 | 4,887 -127 | 1,483 -39 | 3,404 -88 | 926 -133 | 218 -26 | 708 -107 |
| 2019-20 | 5,865 52 | 4,764 -123 | 1,483 0 | 3,281 -123 | 1,101 175 | 193 -25 | 908 200 |
| 2020-21 | 5,576 -289 | 4,406 -358 | 1,408 -75 | 2,998 -283 | 1,170 69 | 222 29 | 948 40 |
| 2021-22 | 5,174 -402 | 3,973 -433 | 1,291 -117 | 2,682 -316 | 1,201 31 | 214 -8 | 987 39 |
| 2022-23 | 4,712 -462 | 3,741 -232 | 1,263 -28 | 2,478 -204 | 971 -230 | 189 -25 | 782 -205 |
| Average | 5,789 | 4,727 | 1,508 | 3,219 | 1,062 | 235 | 827 |