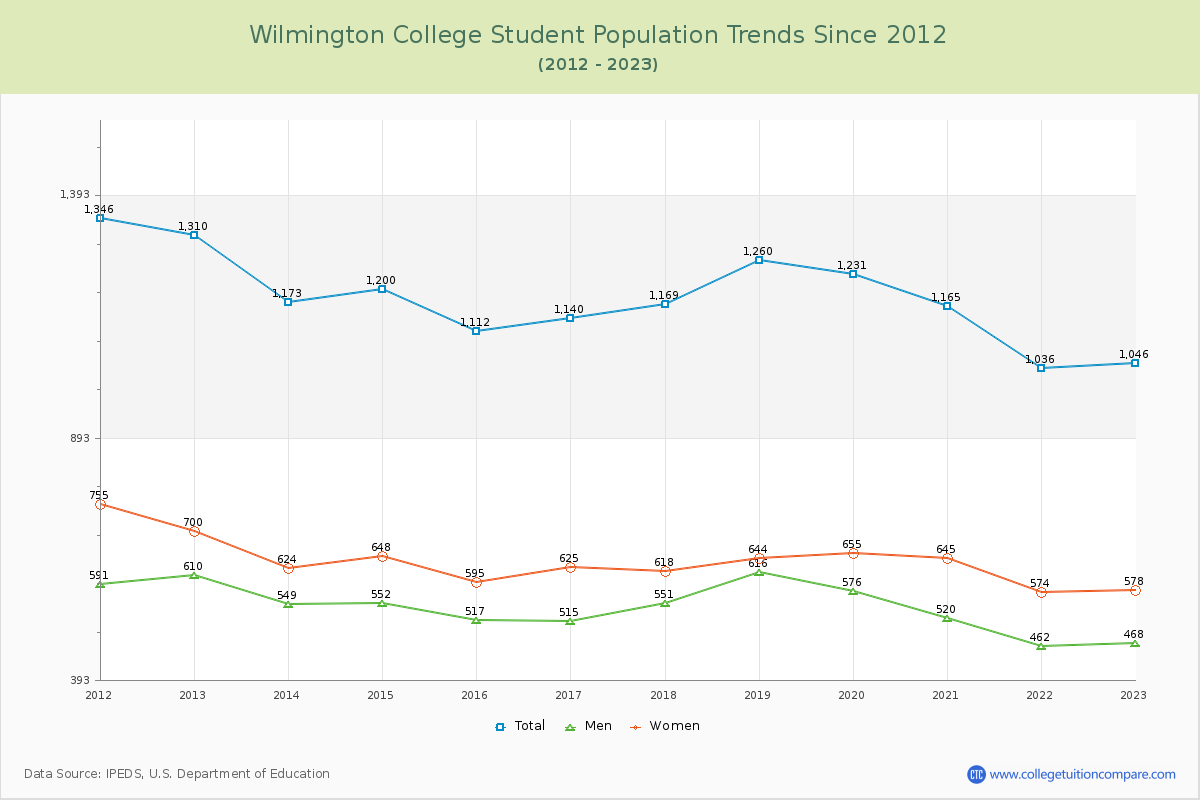
Student Population Changes
The average student population over the last 12 years is 1,167 where 1,046 students are attending the school for the academic year 2022-2023.
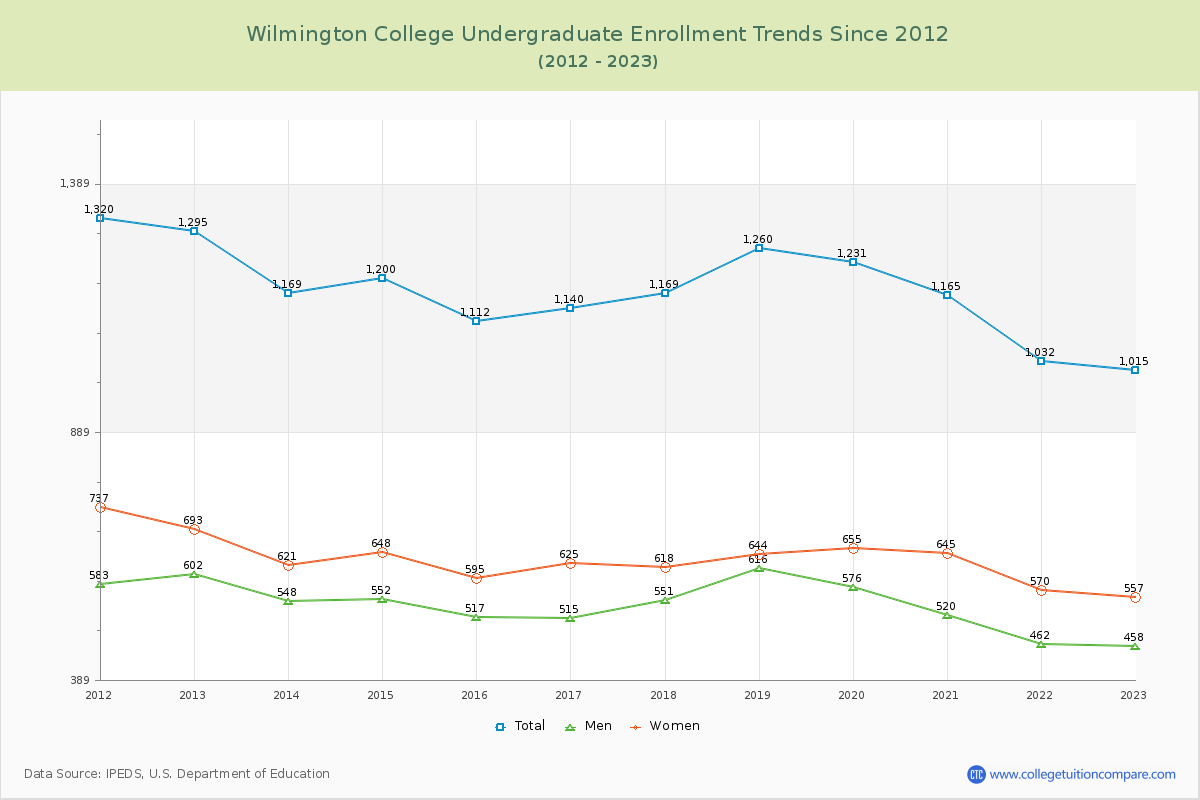
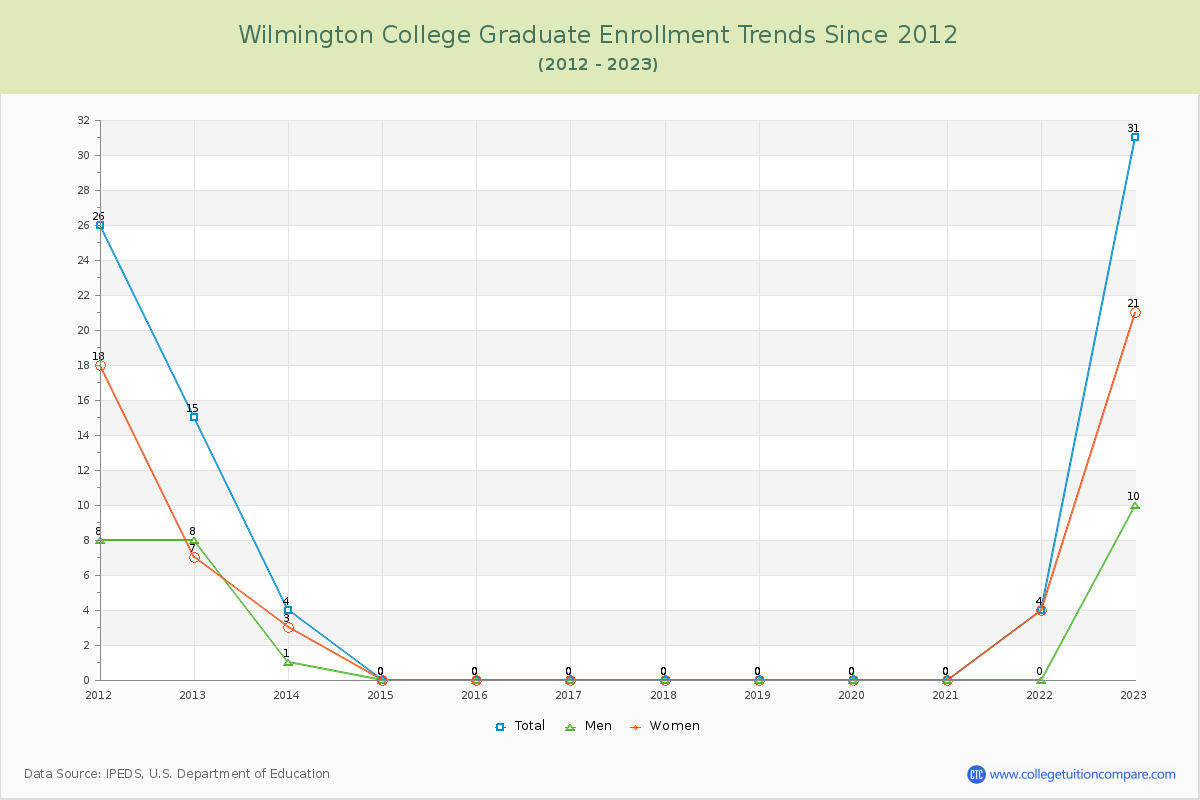
97.04% of total students is undergraduate students and 2.96% students is graduate students. The number of undergraduate students has decreased by 280 and the graduate enrollment has increased by 16 over past 10 years.
The female to male ratio is 1.24 to 1 and it means that there are slightly more female students enrolled in Wilmington than male students.
The following table and chart illustrate the changes in student population by gender at Wilmington College since 2012.
| Year | Total | Undergraduate | Graduate | ||||
|---|---|---|---|---|---|---|---|
| Total | Men | Women | Total | Men | Women | ||
| 2012-13 | 1,310 | 1,295 | 602 | 693 | 15 | 8 | 7 |
| 2013-14 | 1,173 -137 | 1,169 -126 | 548 -54 | 621 -72 | 4 -11 | 1 -7 | 3 -4 |
| 2014-15 | 1,200 27 | 1,200 31 | 552 4 | 648 27 | 0 -4 | 0 -1 | 0 -3 |
| 2015-16 | 1,112 -88 | 1,112 -88 | 517 -35 | 595 -53 | 0 0 | 0 0 | 0 0 |
| 2016-17 | 1,140 28 | 1,140 28 | 515 -2 | 625 30 | 0 0 | 0 0 | 0 0 |
| 2017-18 | 1,169 29 | 1,169 29 | 551 36 | 618 -7 | 0 0 | 0 0 | 0 0 |
| 2018-19 | 1,260 91 | 1,260 91 | 616 65 | 644 26 | 0 0 | 0 0 | 0 0 |
| 2019-20 | 1,231 -29 | 1,231 -29 | 576 -40 | 655 11 | 0 0 | 0 0 | 0 0 |
| 2020-21 | 1,165 -66 | 1,165 -66 | 520 -56 | 645 -10 | 0 0 | 0 0 | 0 0 |
| 2021-22 | 1,036 -129 | 1,032 -133 | 462 -58 | 570 -75 | 4 4 | 0 0 | 4 4 |
| 2022-23 | 1,046 10 | 1,015 -17 | 458 -4 | 557 -13 | 31 27 | 10 10 | 21 17 |
| Average | 1,167 | 1,163 | 538 | 625 | 5 | 2 | 3 |