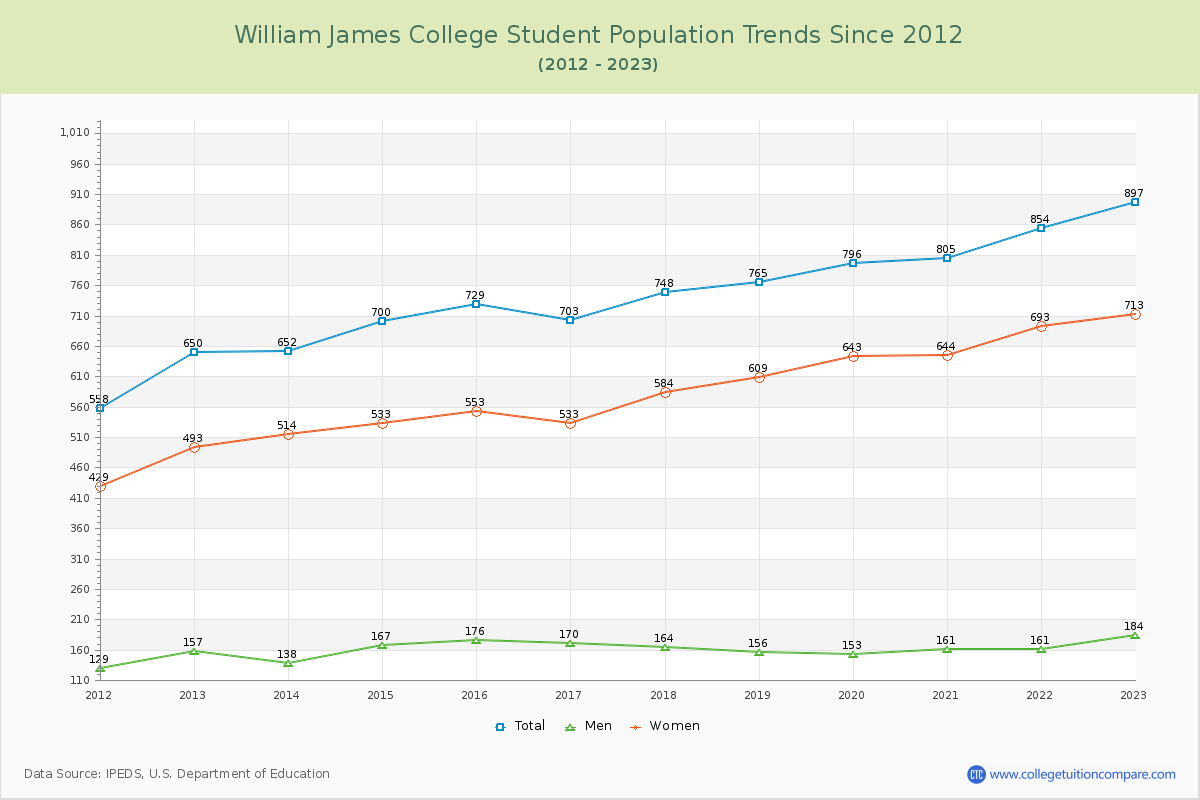
Student Population Changes
The average student population over the last 12 years is 754 where 897 students are attending the school for the academic year 2022-2023.
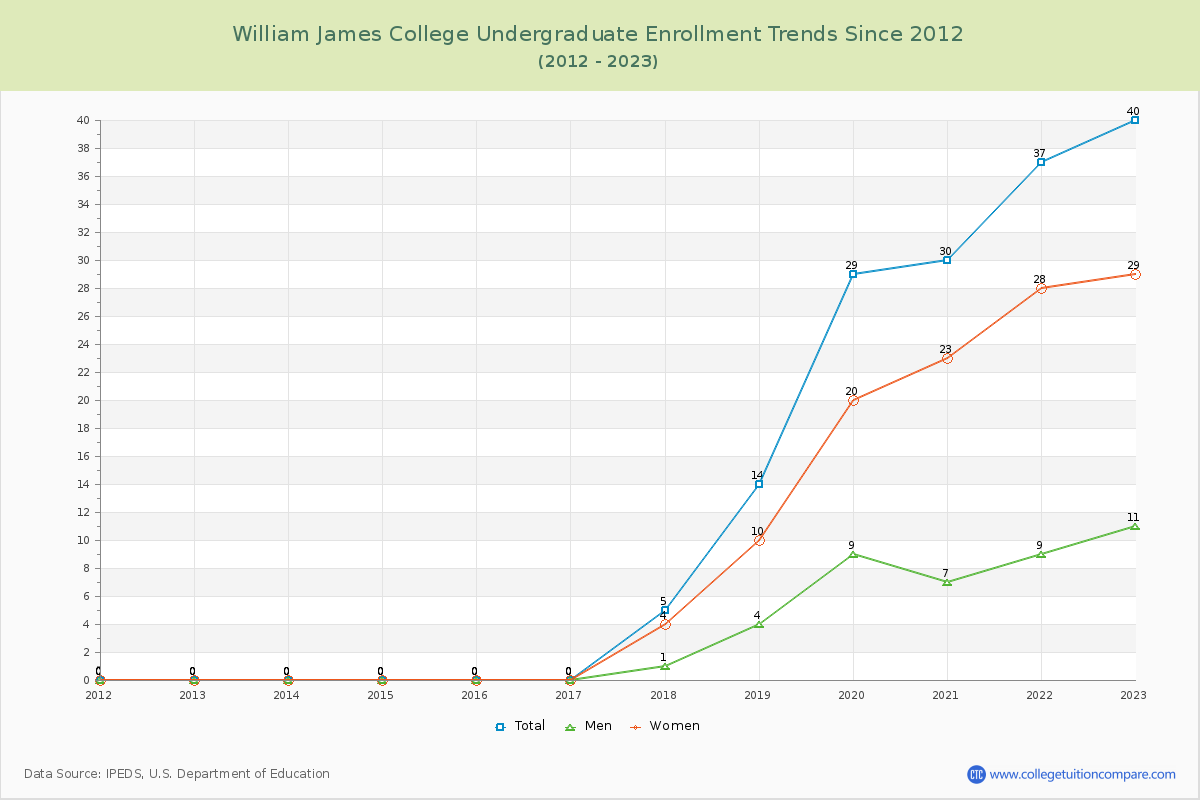
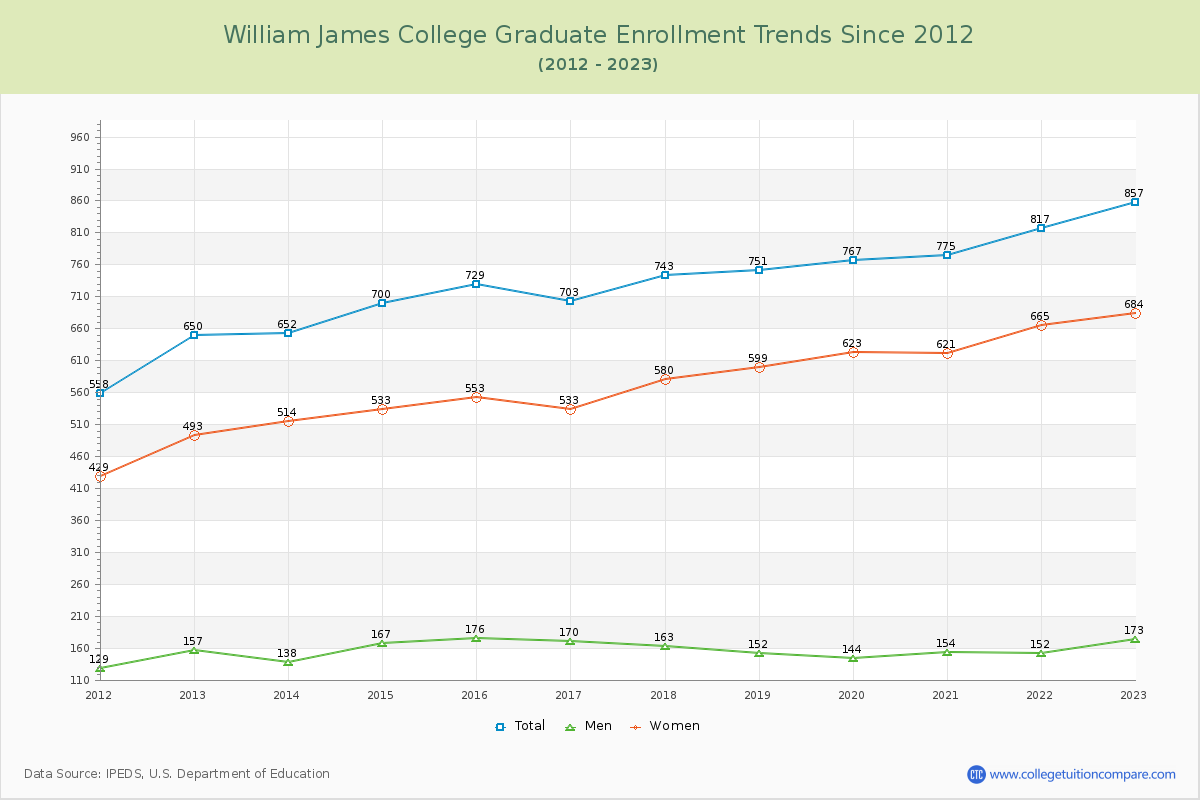
4.46% of total students is undergraduate students and 95.54% students is graduate students. The number of undergraduate students has increased by 40 and the graduate enrollment has increased by 207 over past 10 years.
The female to male ratio is 3.88 to 1 and it means that there are far more female students enrolled in William James than male students.
The following table and chart illustrate the changes in student population by gender at William James College since 2012.
| Year | Total | Undergraduate | Graduate | ||||
|---|---|---|---|---|---|---|---|
| Total | Men | Women | Total | Men | Women | ||
| 2012-13 | 650 | 0 | 0 | 0 | 650 | 157 | 493 |
| 2013-14 | 652 2 | 0 0 | 0 0 | 0 0 | 652 2 | 138 -19 | 514 21 |
| 2014-15 | 700 48 | 0 0 | 0 0 | 0 0 | 700 48 | 167 29 | 533 19 |
| 2015-16 | 729 29 | 0 0 | 0 0 | 0 0 | 729 29 | 176 9 | 553 20 |
| 2016-17 | 703 -26 | 0 0 | 0 0 | 0 0 | 703 -26 | 170 -6 | 533 -20 |
| 2017-18 | 748 45 | 5 5 | 1 1 | 4 4 | 743 40 | 163 -7 | 580 47 |
| 2018-19 | 765 17 | 14 9 | 4 3 | 10 6 | 751 8 | 152 -11 | 599 19 |
| 2019-20 | 796 31 | 29 15 | 9 5 | 20 10 | 767 16 | 144 -8 | 623 24 |
| 2020-21 | 805 9 | 30 1 | 7 -2 | 23 3 | 775 8 | 154 10 | 621 -2 |
| 2021-22 | 854 49 | 37 7 | 9 2 | 28 5 | 817 42 | 152 -2 | 665 44 |
| 2022-23 | 897 43 | 40 3 | 11 2 | 29 1 | 857 40 | 173 21 | 684 19 |
| Average | 754 | 14 | 4 | 10 | 740 | 159 | 582 |