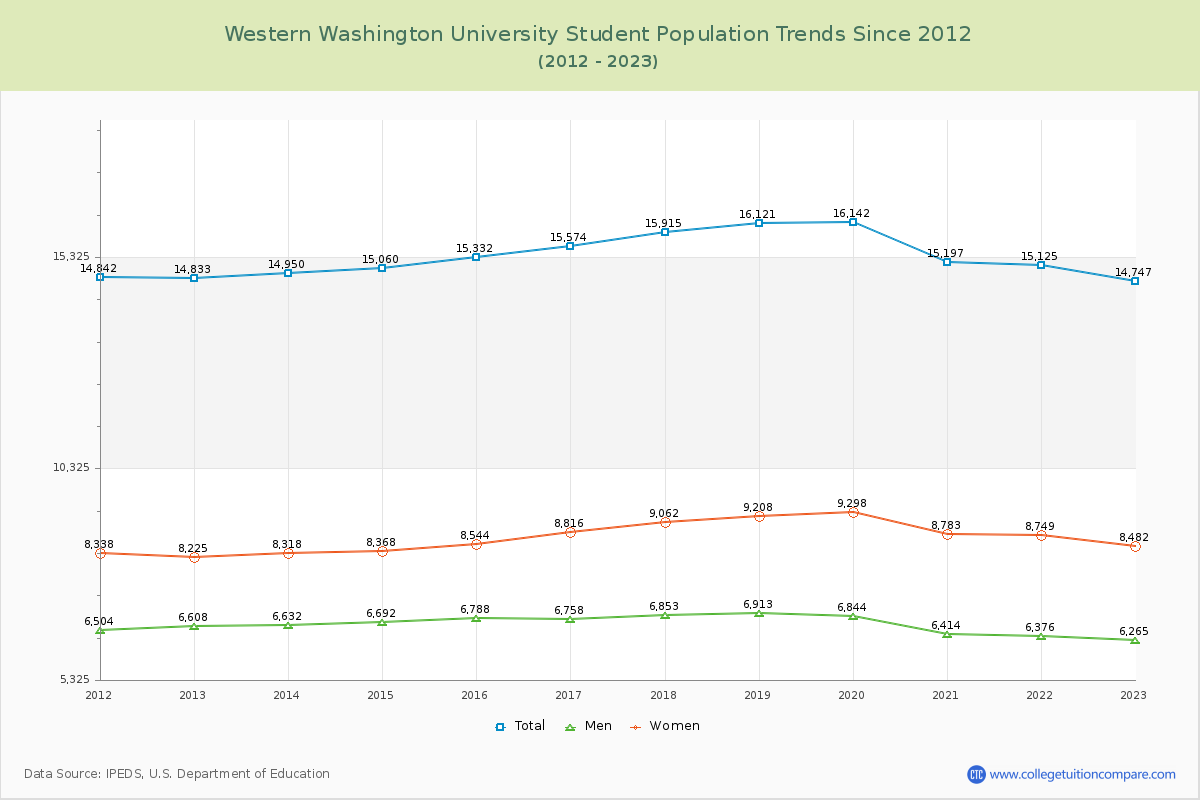
Student Population Changes
The average student population over the last 12 years is 15,363 where 14,747 students are attending the school for the academic year 2022-2023.
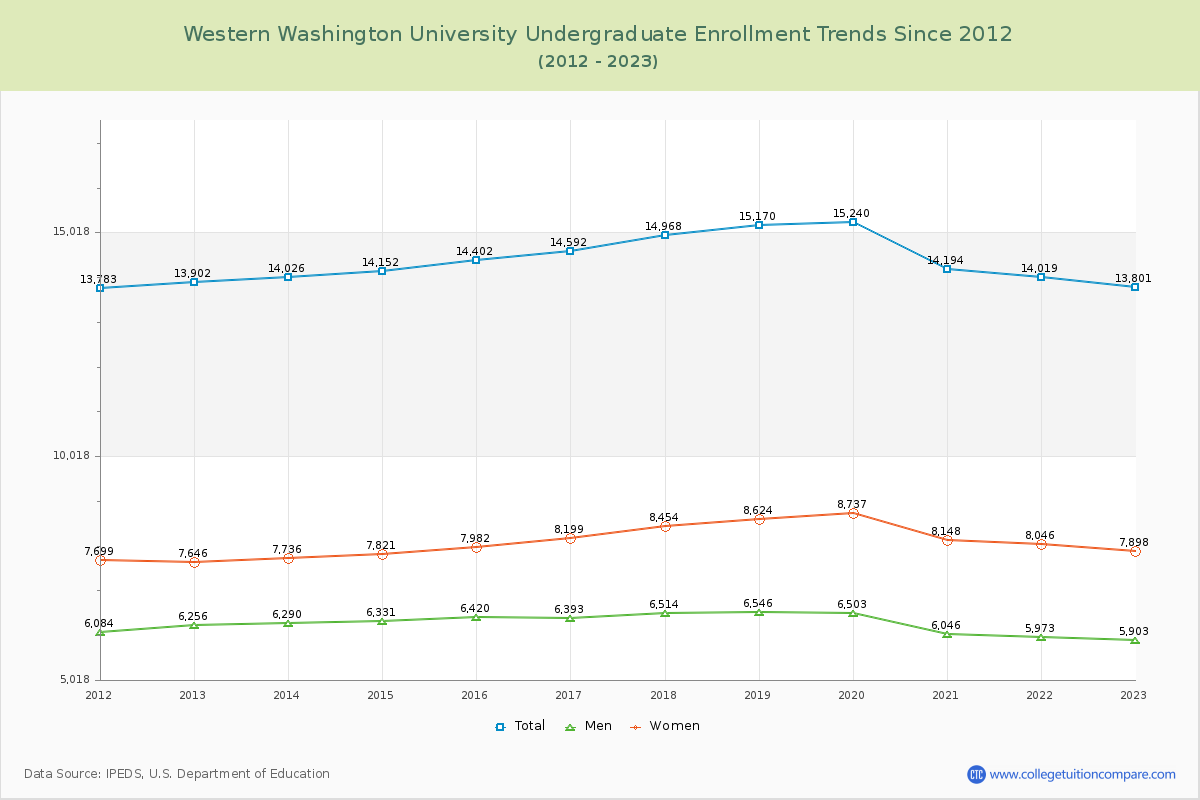
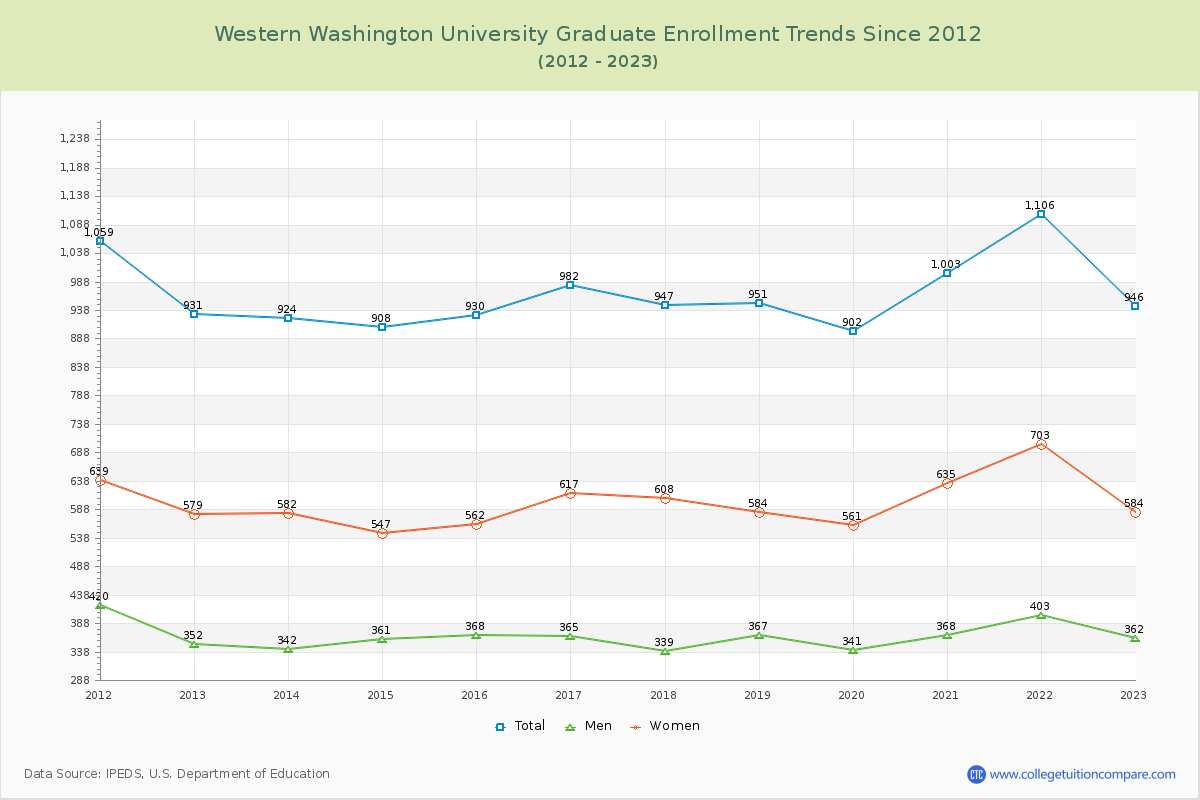
93.59% of total students is undergraduate students and 6.41% students is graduate students. The number of undergraduate students has decreased by 101 and the graduate enrollment has increased by 15 over past 10 years.
The female to male ratio is 1.35 to 1 and it means that there are more female students enrolled in Western Washington than male students.
The following table and chart illustrate the changes in student population by gender at Western Washington University since 2012.
| Year | Total | Undergraduate | Graduate | ||||
|---|---|---|---|---|---|---|---|
| Total | Men | Women | Total | Men | Women | ||
| 2012-13 | 14,833 | 13,902 | 6,256 | 7,646 | 931 | 352 | 579 |
| 2013-14 | 14,950 117 | 14,026 124 | 6,290 34 | 7,736 90 | 924 -7 | 342 -10 | 582 3 |
| 2014-15 | 15,060 110 | 14,152 126 | 6,331 41 | 7,821 85 | 908 -16 | 361 19 | 547 -35 |
| 2015-16 | 15,332 272 | 14,402 250 | 6,420 89 | 7,982 161 | 930 22 | 368 7 | 562 15 |
| 2016-17 | 15,574 242 | 14,592 190 | 6,393 -27 | 8,199 217 | 982 52 | 365 -3 | 617 55 |
| 2017-18 | 15,915 341 | 14,968 376 | 6,514 121 | 8,454 255 | 947 -35 | 339 -26 | 608 -9 |
| 2018-19 | 16,121 206 | 15,170 202 | 6,546 32 | 8,624 170 | 951 4 | 367 28 | 584 -24 |
| 2019-20 | 16,142 21 | 15,240 70 | 6,503 -43 | 8,737 113 | 902 -49 | 341 -26 | 561 -23 |
| 2020-21 | 15,197 -945 | 14,194 -1,046 | 6,046 -457 | 8,148 -589 | 1,003 101 | 368 27 | 635 74 |
| 2021-22 | 15,125 -72 | 14,019 -175 | 5,973 -73 | 8,046 -102 | 1,106 103 | 403 35 | 703 68 |
| 2022-23 | 14,747 -378 | 13,801 -218 | 5,903 -70 | 7,898 -148 | 946 -160 | 362 -41 | 584 -119 |
| Average | 15,363 | 14,406 | 6,289 | 8,117 | 957 | 361 | 597 |